1. Machine Setting and Probes
Basic ultrasound machines can fit perfectly to perform LUS; modern machines usually have harmonics and artifact-erasing software that have to be deactivated to perform a proper LUS exam. In fact, most of the LUS signs are artifacts generated by the air–tissue interface and should not be erased by advanced software [
2]. No specific probe is recommended to perform a general lung examination [
8]. A micro-convex probe with a wide range of frequency can be useful, as well as a combination of a linear high-frequency probe and a convex/phased-array low-frequency one [
2]. It depends on the clinical question that needs to be answered, on the setting in which ultrasonography is performed, and on the sonographer’s confidence. High frequency linear probes have a better definition of the superficial tissues (i.e., for the assessment of pleural line, pleural movements, and artifacts derived from the pleural line), and low frequency probes, such as the cardiac one, provide a better visualization of deeper findings (e.g., consolidations and effusions) and may be more useful for assessing the lung bases [
2,
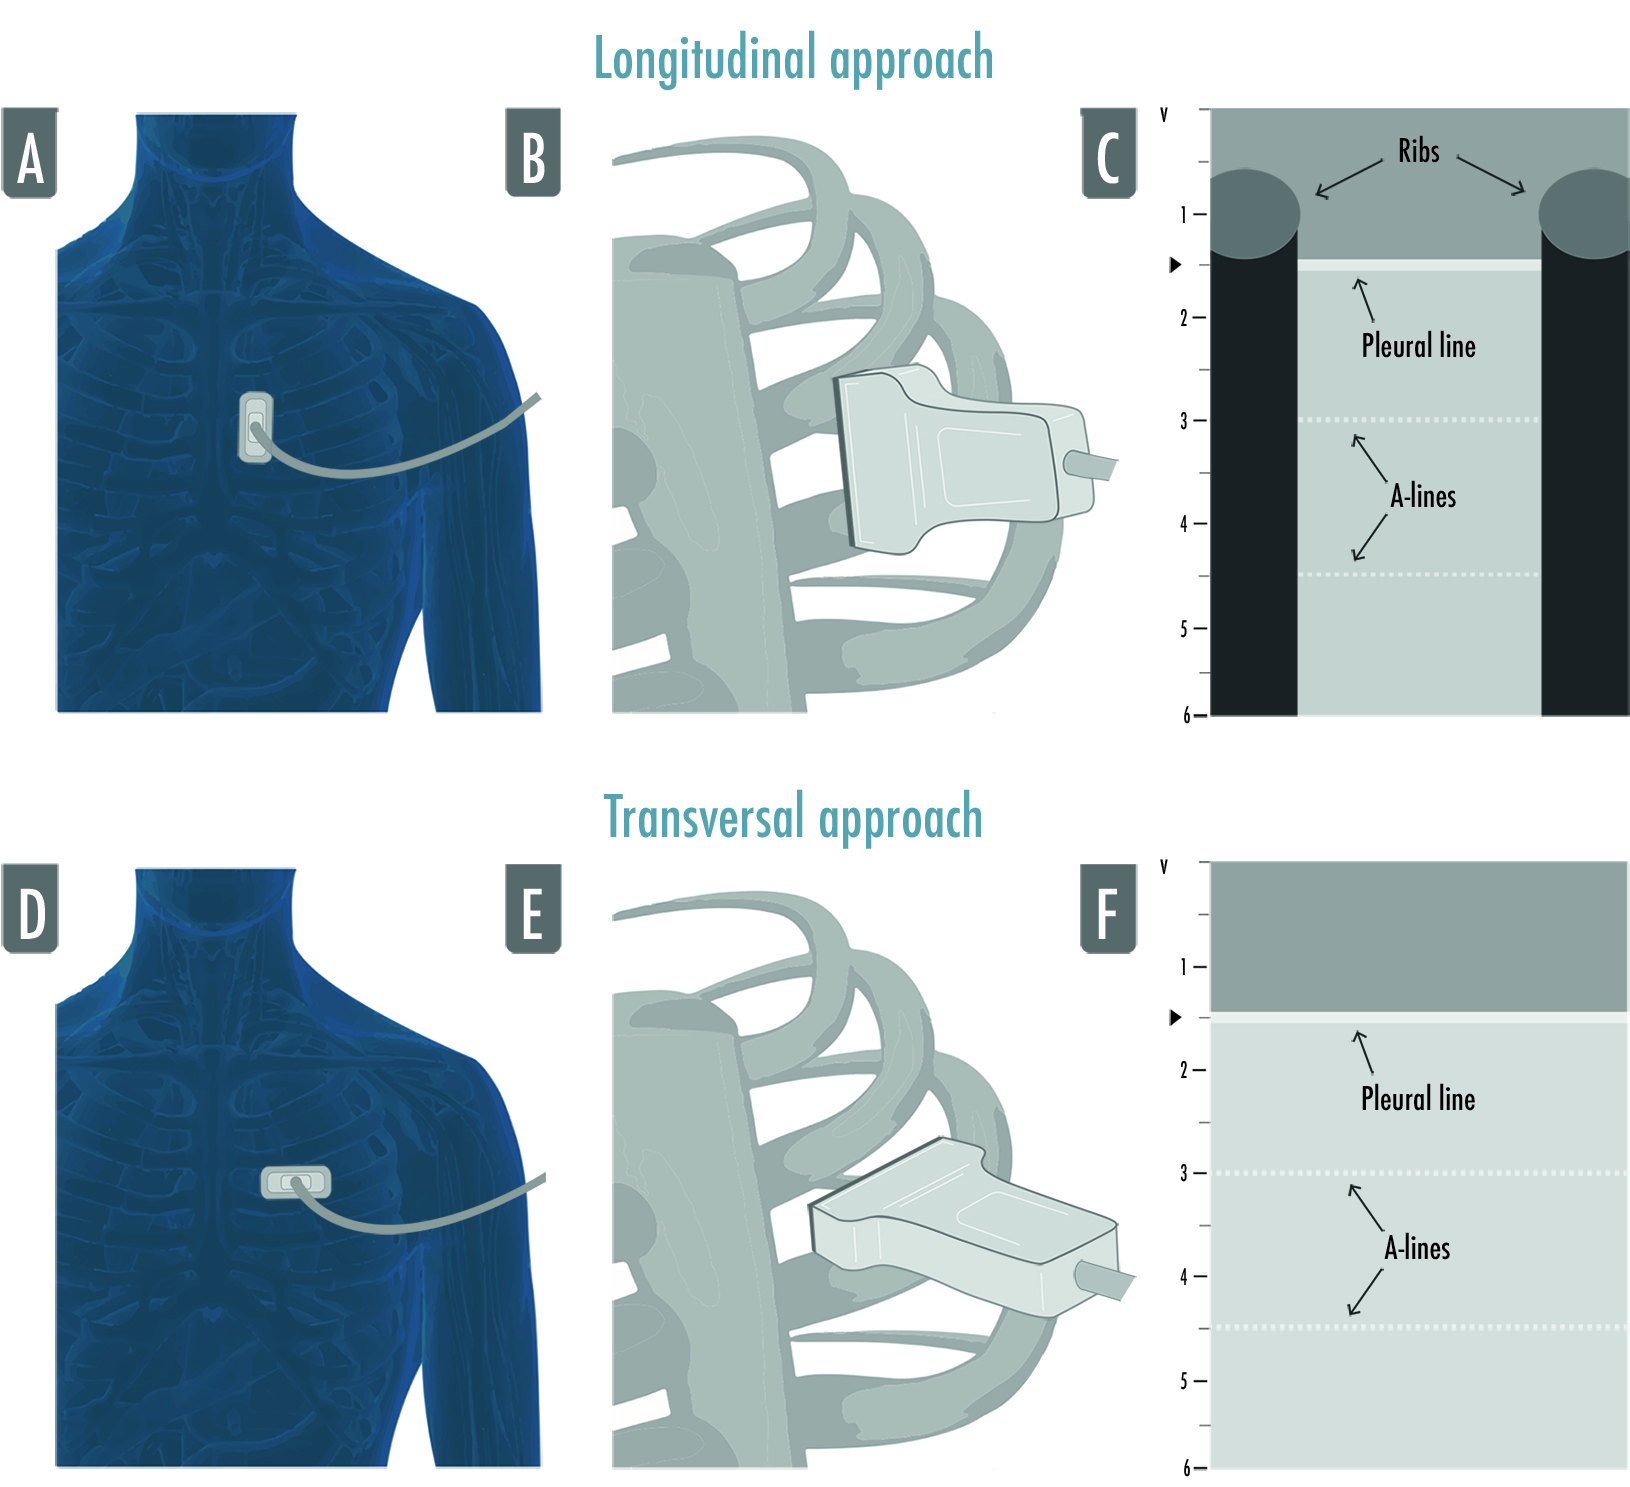
8]. The “focus”, which is the depth where the ultrasound machine gives the maximum image resolution, usually indicated as a marker next to the centimetric depth scale of the ultrasound image, has to be placed as near as possible to the pleural line: LUS artifacts are generated from the pleural line, so a better definition of the pleural line allows for a better visualization of the artifacts. The depth has to be adjusted according to the anatomical characteristics of the patients, the lung region examined, and the probe used; usually a 6–8 cm deep image is adequate for the evaluation of anterior and lateral regions whether the posterior fields may require a deeper setting, mainly if consolidations/effusions are visualized. The probe’s orientation can be longitudinal (where the upper and lower ribs and the pleura are visualized forming what is referred to as the “bat sign”) or transversal (where the probe is positioned between two ribs, perfectly aligned to them, permitting the visualization of a larger part of pleura without the rib shadows) (
Figure 1) [
9].
Figure 1. The figure illustrates both approaches to lung ultrasound: the longitudinal approach (A–C) and the transversal approach (D–F). In the longitudinal approach, the probe is aligned to the craniocaudal axis of the patient and perpendicular to the ribs’ axis (A,B), giving the characteristic ultrasonographic image of the two ribs and their shadows defining the pleural line in the middle, the so-called bat sign (C); in the transversal approach the probe is placed in the intercostal spaces, parallel to the ribs’ axis (D,F), so that a larger pleural section can be displayed without any rib’s shadows visualized (F).
2. LUS Examination
Two types of LUS examination can be identified: a comprehensive exam and a focused exam.
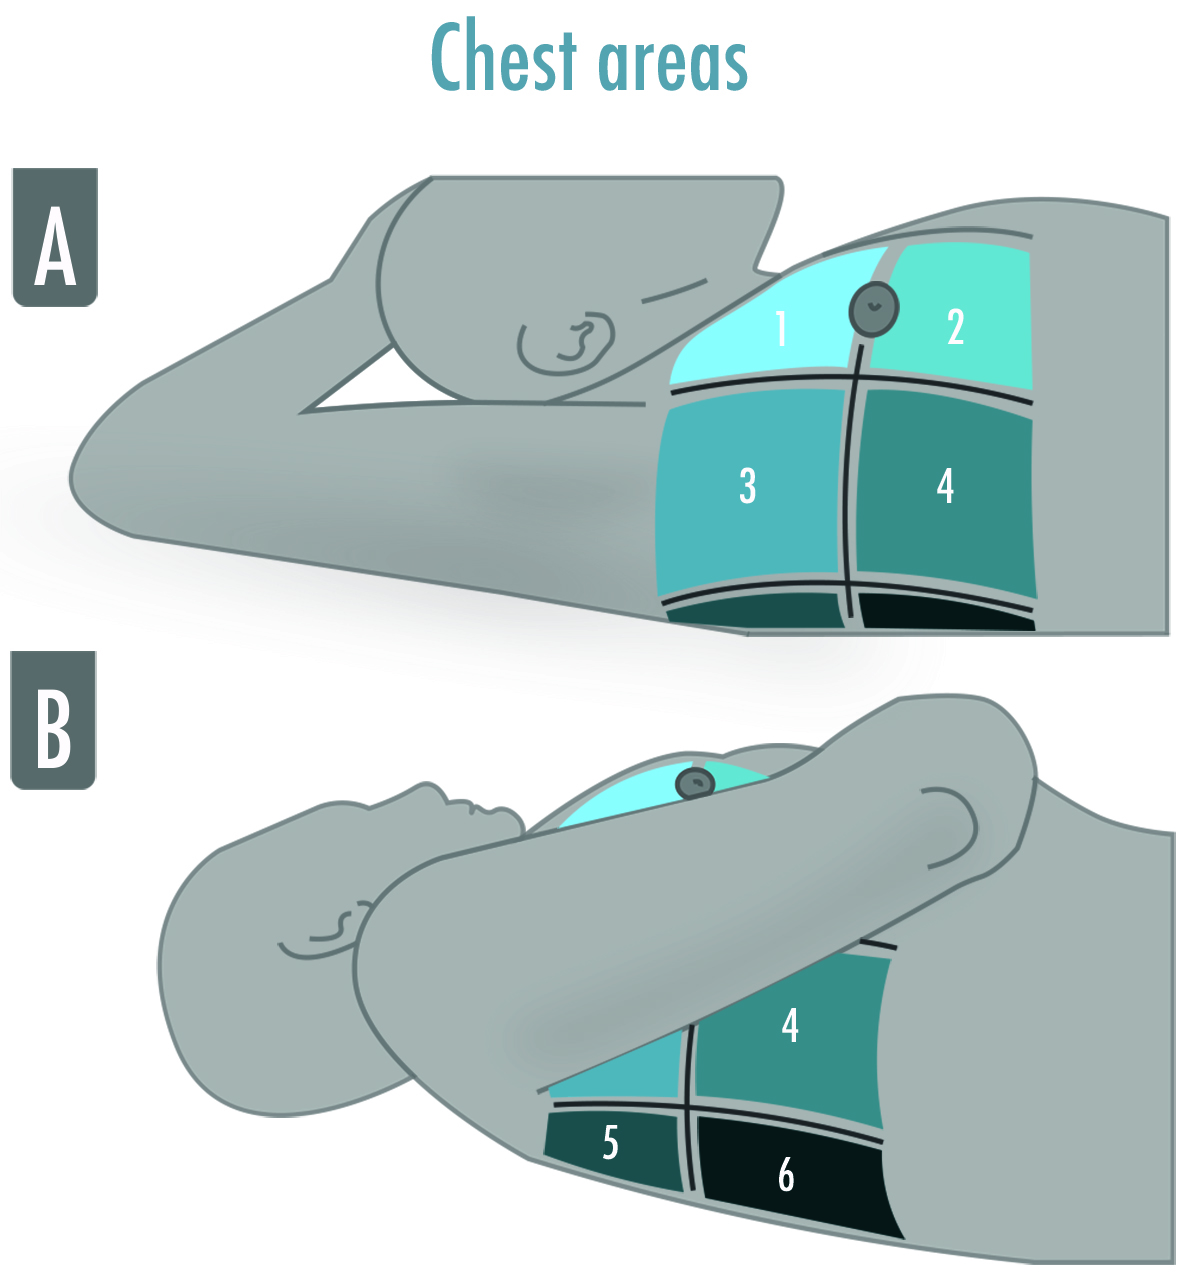
A comprehensive standard LUS examination includes twelve regions, six per side, and is indicated in the critically ill to assess and monitor pulmonary aeration similar to a complete and systematic evaluation: zone 1 and 2 are superior and inferior anterior scans, 3 and 4 are the lateral ones, and 5 and 6 are the posterior ones (Figure 2).
Figure 2. The illustration shows the six-areas division of a hemithorax in a supine patient for a comprehensive lung ultrasound examination. The anterior and the posterior axillary lines divide the hemithorax into three parts, which are finally divided into superior and inferior. The areas may be numbered from “1” to “6”, corresponding, respectively, to the anterior–superior and the inferior–posterior areas. (A) Zone 1 and 2 are superior and inferior anterior scans, zone 3 and 4 are superior and inferior lateral scans; (B) Zone 5 and 6 are superior and inferior posterior scans.
A focused LUS examination is simpler and wants to answer specific clinical questions, such as “Does my trauma patient have pneumothorax?” or “Did I completely drain the pleural effusion?”. In this case, the choice of probe and areas examined may vary according to the answer sought by the sonographer.
3. Obtaining and Optimizing LUS Images
Bearing in mind that LUS artifacts derive from the tissue–air interface at the pleural line, it is mandatory to clearly detect the pleural line in order to avoid misinterpretation. The pleural line is usually located 0.5 cm below the ribs’ line, and it always corresponds to the parietal pleura whether the visceral one can be present or not [
8]. Once the intercostal space is identified in the longitudinal scan, the tilting of the probe is useful to orient the ultrasound beam perfectly perpendicular to the pleura; the rocking helps in visualizing the pleural line as parallel to the probe footprint. These movements allow us to optimize the visualization of A-lines, a marker of a good quality image. Once the intercostal space is identified, a rotation centered on the pleura is useful to entirely visualize the pleural line while avoiding ribs’ shadows, switching from a longitudinal to a transversal scan.
4. Semeiotic
The main signs of LUS are artifacts generated by the high difference in acoustic impedance of subcutaneous tissues above the pleurae and air beneath them. They can be visualized in bidimensional images with the brightness-mode (B-mode). Additionally, the one-dimensional motion mode (M-mode) can be useful for fine motion assessment.
The main LUS signs are:
- -
-
Bat sign: the pleural line (bat’s body) is a horizontal hyperechoic line usually visualized in adult patients 0.5 cm below the ribs (bat’s wings) in a longitudinal approach; this is a basic landmark useful for proper identification of intercostal space and pleura. It is important, especially in those patients where it is difficult to identify the intercostal space as in case of subcutaneous emphysema or morbid obesity [
9];
- -
-
A-lines: horizontal artifacts visualized as hyperechoic lines below the pleural line; repeated at a constant distance equal to the distance between the pleural line and the probe [
10]; they are generated by the reverberation of the ultrasound beam between the pleura and the probe. The A-lines tell us there is air beneath the pleural line and correlate well with the high gas/volume ratio [
8]; when associated with lung sliding, they correspond to normal lungs; otherwise, they can also be visualized in the case of hyperinflation and pneumothorax [
2];
- -
-
B-lines: vertical artifacts originating from the pleural line, moving synchronously with it, erasing the A-lines and reaching the bottom of the screen. They are generated by increased density beneath the visceral pleura (altered air/tissue ratio) [
11];
- -
-
Lung sliding: movement of the pleural line synchronous with tidal ventilation, it indicates that visceral and parietal pleura are in touch and regional ventilation is present [
2];
- -
-
Seashore sign: straight lines above the pleural line and sandy pattern below the pleural line visualized in M-mode, confirm the lung sliding [
2];
- -
-
Stratosphere sign: straight horizontal lines above and beneath the pleural line visualized in M-mode corresponding to an absence of pleural line movement, suggesting parietal and visceral pleura may not be in touch (i.e., pneumothorax), but also present in emphysematous bullae, pleural adherences, and severe hyperinflation;
- -
-
Lung Pulse: movement of the pleural line synchronous to the cardiac rhythm caused by the transmission of the heart beats; heart beats are always visible between breaths, but the sign is defined as a lung pulse only in the absence of lung sliding. It indicates that the pleurae are in touch, but regional ventilation is impaired (e.g., selective intubation, initial phase of atelectasis, pulmonary contusion, hyperinflation) [
12,
13];
- -
-
Lung Point: contact point between collapsed lung and pneumothorax air collection; a normal LUS pattern is visualized close to a motionless pleura; in M-mode, it could be visualized as an alternation between seashore and stratosphere sign, it represents the lateral edge of the intrapleural air layer [
14].
LUS signs visualized in the case of consolidations and effusions:
- -
-
Shred sign: subpleural echo-poor images delimitated by irregular borders, indicating juxtapleural small consolidation [
2];
- -
-
Tissue-like pattern: homogeneous texture of a lobe, similar to abdominal parenchyma, corresponds to a complete loss of aeration [
15];
- -
-
Air bronchogram: hyperechoic intraparenchymal images visualized within a tissue-like pattern that corresponds to air trapped within the consolidation and that could be classified in absent, static (not patent airway), and dynamic (patent airways); the latter is then subclassified in linear/arborescent (specific for ventilator associated pneumonia) or punctiform (low specificity);
- -
-
Pleural effusions: hypo or anechoic space between the pleurae usually visualized in the most dependent areas of the chest. Its position could change in accordance with the patient’s posture, and the lung could be floating in it or compressed by it in a tissue-like pattern. Its echogenicity could help in differentiating the effusion’s type: transudative (i.e., homogeneously anechoic) or exudative (i.e., anechoic or homogeneously echogenic with internal echoes, fibrin strands, or septation).
5. Score for Lung Aeration Quantification
A twelve-zone examination, six per side, has been validated in the critically ill to assess and monitor pulmonary aeration for a complete and systematic evaluation (
Figure 2) [
16]. A score from 0 to 3 is given to each scan (score 0 = normal aeration with A-pattern or no more than two B-lines; score 1 = moderate loss of aeration with three or more well-spaced B-lines or coalescent B-lines/subpleural consolidation occupying < 50% of the pleural line; score 2 = severe loss of aeration with B-lines, coalescent or not, or a subpleural consolidation occupying clearly > 50% of the pleural line; score 3 = complete loss of aeration with consolidation, a tissue-like pattern). The global LUS score corresponds to the sum of regional scores and ranges between 0 and 36 points (
Figure 3) [
8].
Figure 3. The lung ultrasound score is represented in the illustration above. Score 0 corresponds to the visualization of the A-lines only or with less than three B-lines per scan; score 1 is given if three or more well defined B-lines or coalescent B-lines/sub-pleural consolidations are visualized but they cover < 50% of the inspected zone; score 2 corresponds to the presence of multiple B-lines (coalescent or not) or sub-pleural consolidations occupying > 50% of the visualized pleura; score 3 is finally assigned when a clear tissue-like pattern is observed.
This entry is adapted from the peer-reviewed paper 10.3390/arm91030017


