1. Introduction
Rainfall simulators represent often-used equipment for soil research. According to the process of the formation of water drops, rainfall simulators can be divided into simulators that generate drops by spraying (Spraying Rainfall Simulators—SRS)
[1][2][3][4][5][1,2,3,4,5] and by dripping (Dripping Rainfall Simulators—DRS)
[6][7][8][9][6,7,8,9]. In addition to the mentioned groups, there is also a group of simulators that generate drops using the combined action of the two processes (Combined Rainfall Simulators—CRS). They usually involve nozzles or drippers that primarily create precipitation and different metal meshes, modifying the precipitation. They are created in an attempt to compensate for the shortcomings of simulators from the two previously mentioned groups
[10][11][12][13][14][15][10,11,12,13,14,15]. Rainfall factors that are significant in terms of their impact on soil are the amount, intensity, duration and regime of precipitation
[16][17][18][19][16,17,18,19], distribution raindrop sizes
[20][21][22][20,21,22], spatial distribution
[23], raindrop size, falling speed
[24][25][24,25], direction of fall
[26][27][26,27], direction of movement
[18], kinetic energy
[28], momentum
[29] temperature
[30] and chemical composition of rainfall
[31].
It is important to keep in mind that simulator design and performance are mutually conditional, so to understand the simulator design it is necessary to analyze their performance as well
[32]. By analyzing the rainfall simulators and comparing them with each other, the main differences in their performance were noted. SRS provide a distribution of water drop sizes that is more similar to natural precipitation, enable the establishment of the terminal velocity of the drops at a lower height and are advantageous in terms of the ease of manufacture, portability, the surface they can cover, handling and the price of the simulator
[33][34][33,34]. On the other hand, DRS generate precipitation in a wider range of intensity, with the possibility of changing the intensity of precipitation without a significant change in the size of the drops and achieving greater uniformity of the spatial distribution of precipitation
[9][34][35][36][9,34,35,36]. Simulators with only one dripper, by their design, enable a special analytical approach in the study of soil with the individual erosive action of drops on the soil
[22][37][38][39][40][41][42][22,37,38,39,40,41,42].
2. DRS for Soil Research Performances
2.1. Wetted Area
The wetted area of dripping rainfall simulators with more than one dripper (DRS
>1) represents the surface of the experimental plot that is exposed to simulated rainfall. The shape is most often rectangular but can also be round, and its dimensions are determined by the shape and dimensions of the projected drippers surface
[7][43][44][45][46][7,58,59,60,61].
In the analysis, two sets of data were combined: the exact and approximate wetted area. The first set represents explicitly stated values of the area or dimensions of the wetted area. The second dataset represents the wetted area data based on the assumption that the dimensions or a covered area of the water tank with drippers above correspond to the dimensions and area of the wetted area below. The second dataset gives values that are usually slightly overestimated; however, for a general analysis, this can be neglected.
The largest number of simulators covers a wetted area between 0.2 and 0.6 m
2. A smaller number of simulators have a wet surface area below 0.2 m
2 and in the range of 0.8–1.0 m
2, while the number of simulators with a wetted area larger than 1.0 m
2 is significantly lower. One rainfall simulator had a wetted area of 36 m
2 [9]. Wetted areas covered by rain simulators of a modular design were not included in the analysis, but only the wetted areas were covered by separate modules.
2.2. Drop Size
Natural or simulated rainfall drop size is defined by the diameter of a sphere whose volume is identical to the drop volume, although raindrop shape usually is not entirely spherical
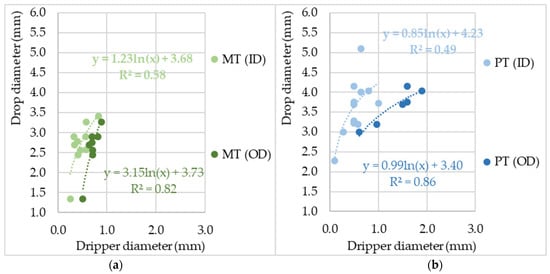
[47][48][49][62,63,64]. The choice of drippers for the DRS is often based on the experience of previous research or personal empirical knowledge, under the assumption that drippers in the form of tubes and holes with a smaller internal diameter (ID) generate drops of a smaller diameter and vice versa, neglecting other factors that affect the size of the drops. However, when fitting logarithmic functions, the dripper diameter of metal and plastic tubes (MT and PT) showed a strong relation for the dripper’s outer diameter (OD), while the relation for the dripper’s ID is moderate-to-weak (
Figure 1a,b). For some of the drippers, both the ID and OD values were available, so their pairs can be noticed
ion the graph
ic.
Figure 1. The influence of MT (a) and PT (b) drippers OD and ID on the drop diameter. Note: drippers whose corresponding drop diameter sizes were modified by the action of air, vibrations and inserted threads, and drops and drippers whose diameters were given in a range, were excluded from the analysis.
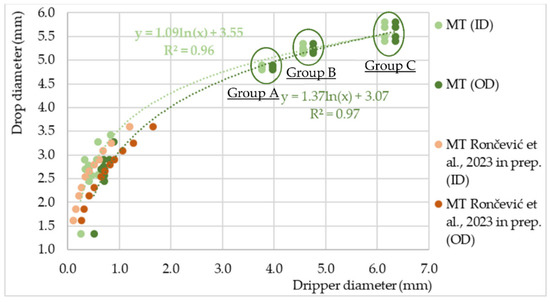
However, when increasing the range of the MT drippers’ diameter size the relation becomes very strong, R
2 = 0.96 and 0.97, for both the ID and OD. Additionally, the logarithmic function that describes that relation is in accordance with data obtained by
[50][65], where water drops were generated using hypodermic needles (
Figure 2). On the other hand, observations by
[51][66] showed that as the dripper diameter increased, the detached drop weight became less dependent on the dripper diameter.
Figure 2. The influence of MT and PT drippers’ ID and OD size on the drop’s diameter with expanded diameter range (groups A, B and C) of MT drippers
[52][67] in comparison to research of
[50][65] Note: drippers whose corresponding drop diameters size were modified by the action of air, vibrations and inserted threads, and drops and drippers for which the diameter was given in a range, were excluded from the analysis. The equations shown exclude the data from the research of
[50][65].
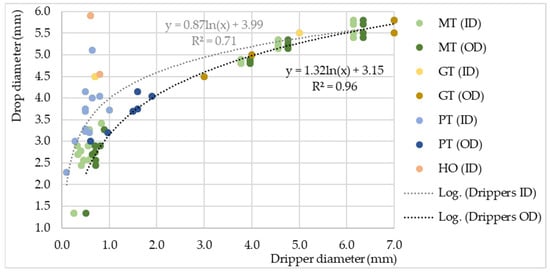
In general, the relation between drippers and drop diameter, described using the logarithmic equation, shows a very strong relation for the dripper’s OD, and a weaker but still strong relation for the ID (
Figure 3). That is in accordance with
[12], who roughly estimated that at the same water pressure, the OD size of the dripper determines the size of the drop.
Figure 3. The influence of different types of drippers’ ID and OD on drop diameter size (GT—glass tubes, and HO—holes in boards and tubes). Note: drippers whose corresponding drops diameter size were modified by the action of air, vibrations and inserted threads, and drop and dripper diameters given in a range, were excluded from the analysis.
It is obvious that with the increase in the ID of the plastic tubes, the relation deviates from the logarithmic curve that represents all drippers together. Additionally, there are HO drippers whose values deviate from the logarithmic curve too, but they are specific because they have an almost infinite outer diameter (Figure 3). It is suggested that a possible reason for such a deviation could be the dripper material. However, based on the research of [68–72], drippers made from different materials such as glass, brass, stainless steel, Teflon, all show no significant difference in drop size. The material type rather determines the thickness of the tube wall. Therefore, when describing the relation between the dripper diameter and drop size, the assumption is that metal tube drippers have a different logarithmic distribution than plastic or glass tubes, because of their thinner wall (Figures 1a,b and 3), regardless of whether they are sharp or blunt.
However, drop size is not exclusively correlated with dripper diameter, surface tension or dripper tip geometry. The size of the drop depends on numerous other factors; among them are dripping intensity, dripping tip position and geometry, length-to-diameter ratio, water temperature and environmental atmosphere condition [52][53][54][67,72,76]. In addition to the dripper diameter and type, the dripping speed is also a factor that was taken into account for soil research using rainfall simulators. [25]. With the rise in the dripping speed, the drop size of the MT drippers rises too, until it starts to decline at some point [50][65].
Additionally, the influence of water temperature on the size of the generated drop is significant
[54][76]. Water used in rainfall simulations with DRS can be distilled water
[37][39][55][56][37,39,77,78] or water available from the environment, which is most often water from the water supply network
[57][58][59][60][61][62][79,80,81,82,83,84].
Modifications of dripper performance via air flow and vibration were carried out in order to expand the range of drop sizes, primarily with the aim of also generating drops with smaller diameters
[63][64][90,91]. Additionally, threads inserted in drippers were applied primarily to achieve capillary movement of water in the dripper and reduce flow, despite the fact that they change the diameter of the generated drop
[65][66][44,92].
The sizes of the drops generated by the drippers are mostly in the range between 2 and 6 mm, while the number of drops smaller than 2 mm is relatively small (
Figure 4). Although it is stated that the diameter of the drops of natural precipitation can reach 6, 7 and even 8 mm, it rarely exceeds 4 mm
[67][68][69][94,95,96]. Falling drops are stable at terminal velocity until they reach a diameter of 4.6 mm, after which they break up into smaller ones due to the air resistance encountered during their fall, becoming definitely unstable with a diameter above 5.5 mm
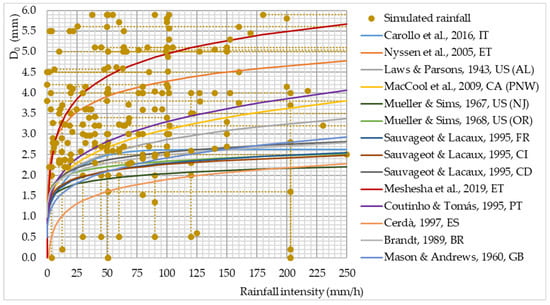
[70][97]. On the other hand, the maximum value of the median volume diameter (D0) of natural precipitation is only 2.0–2.5 mm at an intensity of 25–200 mm/h [98], which is in agreement with the observations of other researchers [21,99], whereas higher values have been reported also [100–102]. However, these D0 values refer most often to rains of a relatively high intensity, while rains of a lower intensity occur more often and achieve relatively lower D0 values [103].
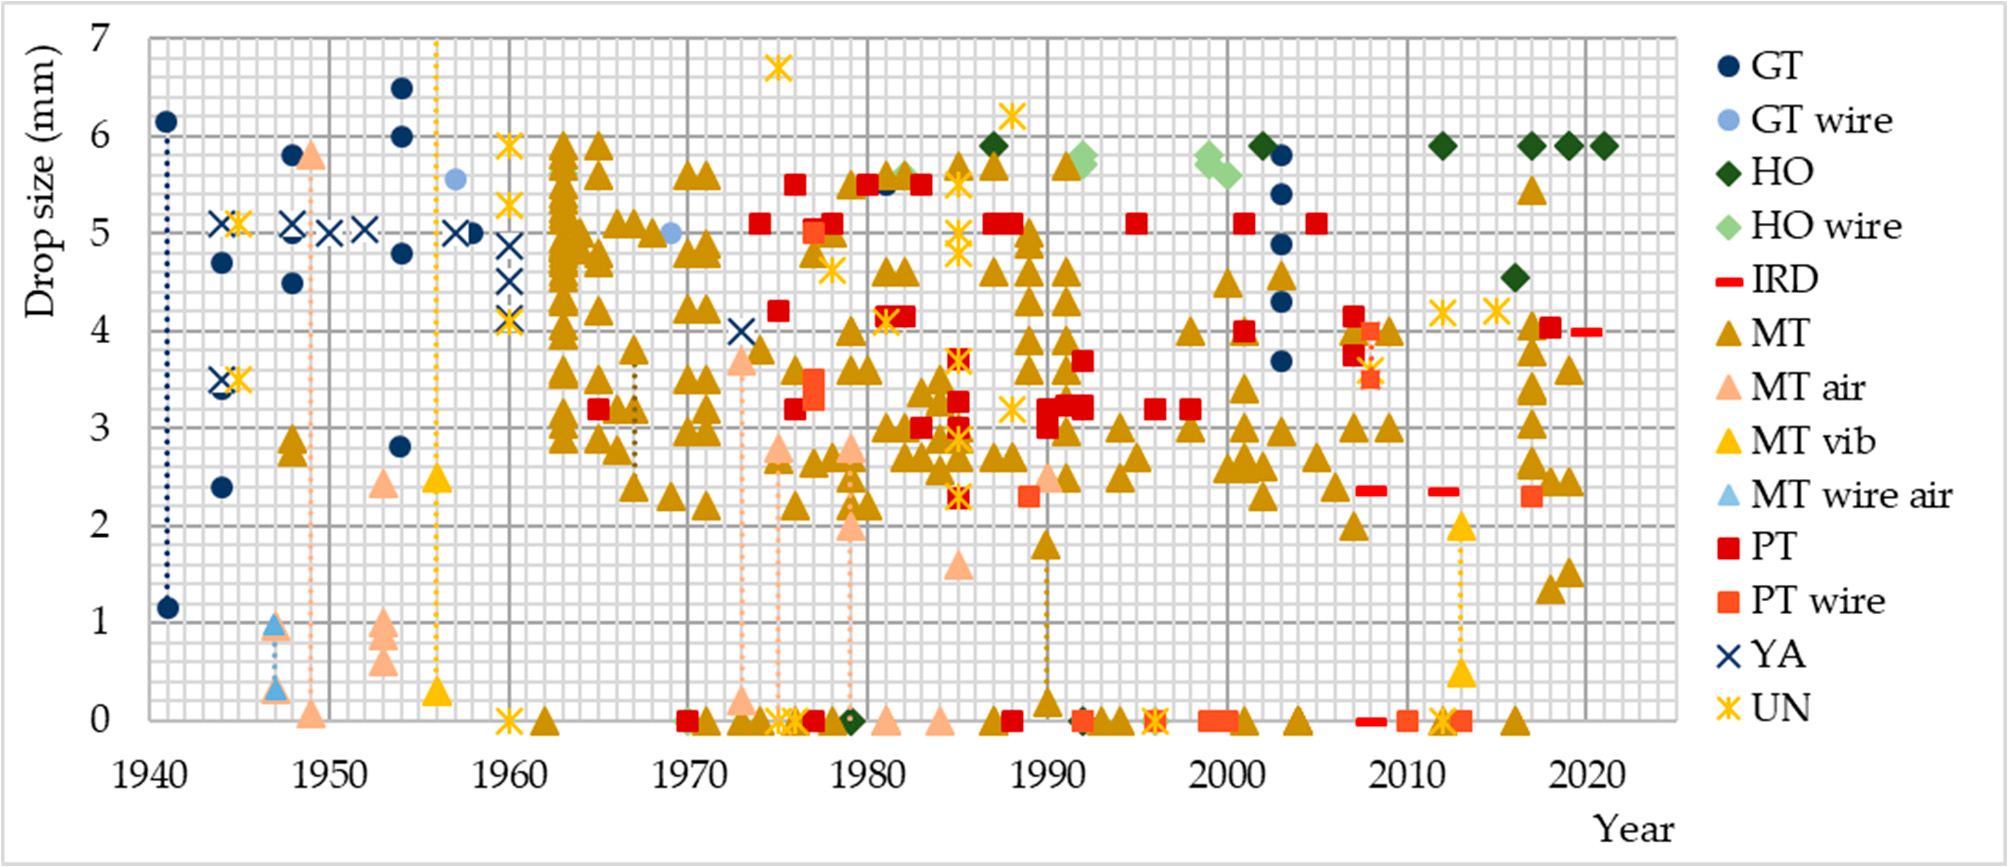
Figure 4. Type and subtype (modified performance drippers) of drippers and corresponding sizes of generated drops used in previous rainfall simulations (GT—glass tubes, GT wire—glass tubes with threads, HO—holes in dripper reservoir, HO wire—holes in dripper reservoir with threads, IRD—irrigation drippers, MT—metal tubes, MT air—metal tubes under the influence of air flow, MT vib—metal tubes under the influence of vibration, MT wire air—metal tubes with threads under the influence of air flow, PT—plastic tubes, PT wire—plastic tubes with threads, YA—hanging yarn and UN—unspecified dripper type). Note: for markers located on a horizontal line with a value of 0, the diameter of the generated drops was not specified [32]. Also, dotted lines represent simulated drop diameter values that are given in a range.
2.3. Rainfall Intensity and Duration
The rainfall intensity of DRS is regulated by regulating the pressure or water flow in the hydraulic system of the simulator
[32][71][72][73][74][32,107,108,109,110].
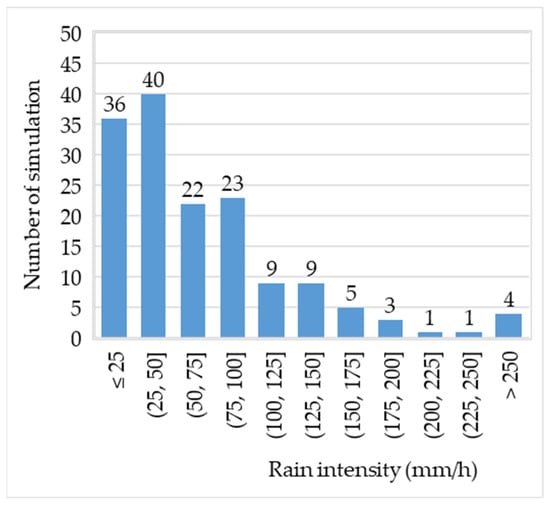
The most common values of simulated rainfall intensities range up to 50 mm/h, and then their number gradually decreases for the ranges of 50–100 mm/h, 100–150 mm/h and over 150 mm/h, with a maximum value of over 1600 mm/h (
Figure 5).
Figure 5. Number of simulations at different intensities of simulated precipitation. Note: simulations with a single dropper or those for which intensity values are given in a range are not included in the analysis.
Rainfall intensity is correlated with drop size median volume (D
0), which, as suggested by
[75][111], is the best parameter for representing the drop size distribution of rainfall. However, the relationship is site specific
[76][112] (
Figure 6). With an increase in the intensity of precipitation, the value of D
0 also increases
[75][77][78][79][80][81][101,111,113,114,115,116]. However, some researchers state that after reaching a rainfall intensity of about 70–100 mm/h, the D
0 hardly changes and stabilizes
[82][83][84][85][86][87][98,103,117,118,119,120], while some even report that the D
0 decreases
[83][88][89][90][103,121,122,123] (
Figure 6).
Figure 6. D
0 as a function of intensity for natural and simulated rainfalls. Note: two capital letters after reference represent the ISO Alpha-2 country code that designates countries in which measurements have been conducted
[21][77][78][91][92][93][94][95][96][97][98][99][21,54,99,100,101,102,113,124,125,126,127,128]. Note: dotted lines represent simulated D
0 and rainfall intensity values that are given in a range.
Given that DRS
>1 generate precipitation whose drop size uniformity coefficient is theoretically 100% (in practice it will be somewhat lower), the values of the D
0 should correspond to the diameter of any such generated drop. Although it is possible using DRS
>1 to generate precipitation intensity in the range of the D
0 that occurs in nature, there is a relatively small number of simulated precipitations that corresponds to natural precipitation. D
0 values usually rise until a rainfall intensity between 50–75 mm/h is reached, achieving maximum D
0 values ranging from 2.0–2.7 mm at a precipitation intensity ranging from 75–200 mm/h (
Figure 6).
The duration of the simulated rainfall is determined by the availability of water necessary for the simulation and the intensity of the rainfall. If the water necessary for the simulation is available in unlimited quantities, the duration of the simulation is also unlimited, while on the other hand, if the amount of water is limited, the duration of the simulation directly depends on the intensity of precipitation [32]. The largest number of simulations was conducted for a duration of less than 30 min, then the number of simulations gradually decreased to a duration of 2 h, while only a few simulations were conducted for a duration longer than 2 h.
In addition to the D0, rainfall intensity is also correlated with rainfall duration. The simulated and natural precipitation intensity for the return period of 1–5 years for different geographical areas mostly coincides (Figure 7).
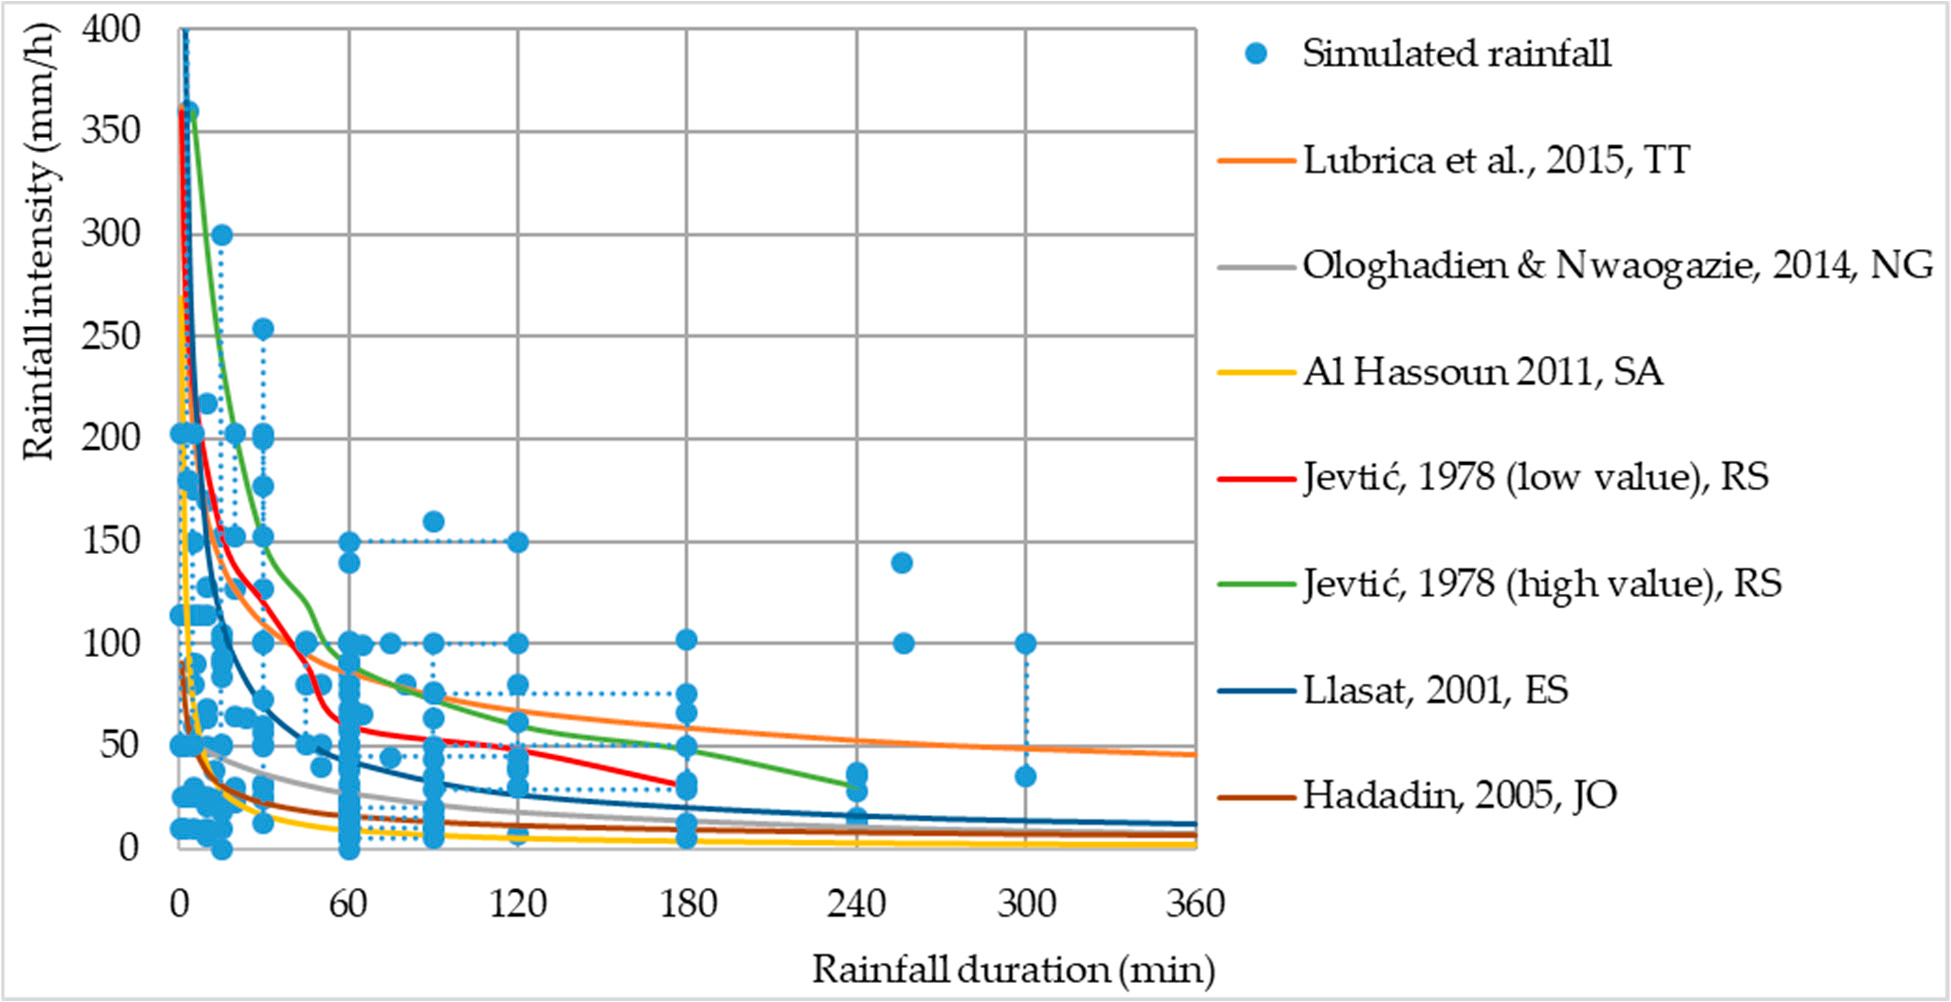
Figure 7. Rainfall intensity as a function of the duration of natural and simulated rainfalls. Note:
two capital letters after reference represent the ISO Alpha-2 country code that designates countries in which measurements have been conducted [23,129–133]. Note: dotted lines represent simulated rainfall duration and rainfall intensity values that are given in a range.
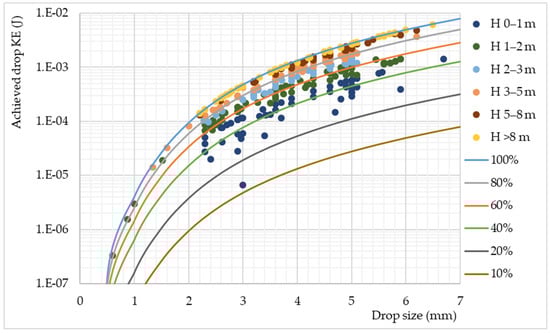
2.4. Kinetic Energy (KE)
The KE of rainfall is determined by the size distribution of raindrops and their falling speed. Since the diameter of the drop and the height of the fall are known for DRS
>1, it is possible to calculate the KE of such precipitation. There are several works that determined the terminal velocity of drops of different diameters under given conditions
[100][101][102][103][104][57,104,134,135,136] however, during simulations, due to the insufficient height at which the drops were placed, terminal velocities were often not reached. Given that the change in drop velocity does not occur linearly with the change in drop height and is different for drops of different diameters, there is no single equation that could represent this relationship
[100][57]. For the purposes of the research, a mathematical model by
[100][57] for determining the terminal and achieving the speed of drops of different diameters at different heights of drops was applied for the determination of the achieved speed, i.e., the KE of drops in the previous simulations (
Figure 8).
Figure 8. Achieved drop KE of simulated precipitations for different heights based on the mathematical model of
[100][57]. Note: the analysis did not include simulations for which drop height values were given in a range.
For 1-mm drops, the required height to achieve 90% of terminal velocity would be proximately 1.5 m, and for 2-mm drops it would be about 4.0 m, after which it increases to about 5.5 m for bigger drops
[100][57].
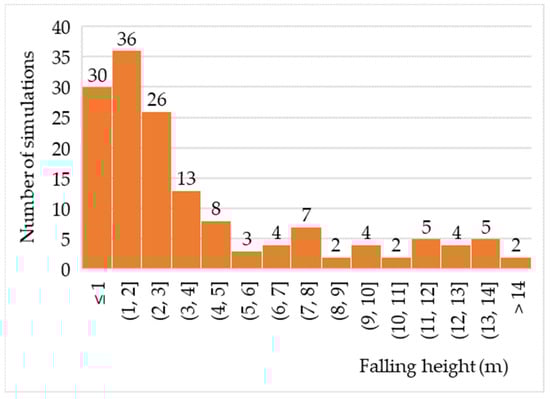
Figure 9 shows the representation of different fall heights during the simulations, where it can be seen that most simulations were conducted at a fall height of up to 2 m (43.7%), and then the percentage decreases gradually as the height gets closer to 5 m (31.1%). Falling heights over 5 m occupy 25.2% of all simulations and occur relatively equally, while the highest recorded falling height is 14 m. However, depending on the diameter of the drop, the presented values of the drop height may or may not be satisfactory in terms of achieving the terminal drop speed
[100][57].
Figure 9. Number of simulations at different heights of simulated precipitation
[32]. Note: data whose values are given in ranges are not included in the analysis.
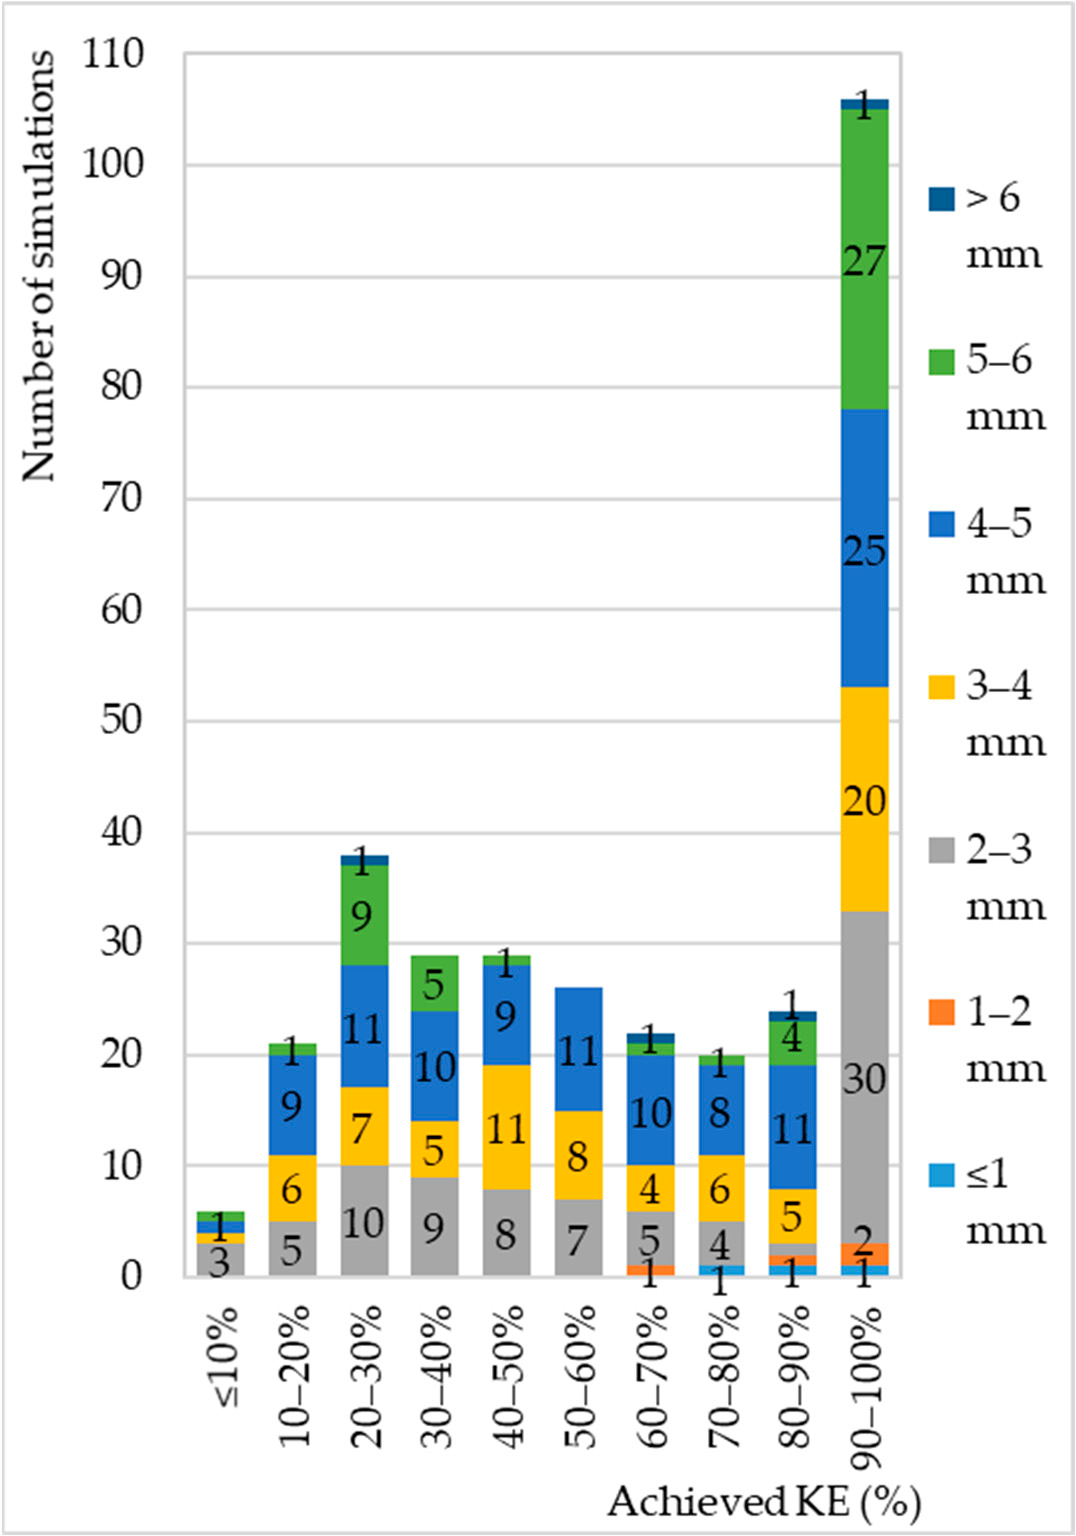
The number of simulations with a KE lower than 30% have a steep rise within categories, after which their number slowly falls with the increase in the KE until reaching the category of 90-100%, which comprises 33.0% of simulations. Most the simulations (58.6%) occur in the range between 20 and 90% KE, while only 8.4% are lower than 20% KE. Drops smaller or equal to 2-mm diameter achieved a KE in a range of 60-80% in 28.6% of the simulations, while 71.4% of the simulations achieved over 85% of the KE.
Figure 9. The number of simulations at different values of the achieved KE in relation to falling
drops of different diameters. Note: data whose values of drop diameter or fall height are given in
ranges are not included in the analysis.
3. Conclusions
DRS can provide rainfall that corresponds well with natural rainfall, except in terms of the drop size distribution and wetted area, which can be cited as the biggest shortcoming of DRS; on the other hand, usually there are more factors that do not correspond to the natural conditions, such as the median drop size volume and kinetic energy.