Imaging in Gastric Cancer: Comparison
Please note this is a comparison between Version 1 by Cesare Maino and Version 3 by Dean Liu.

Gastric cancer represents one of the most common oncological causes of death worldwide. In order to treat patients in the best possible way, the staging of gastric cancer should be accurate. In this regard, endoscopy ultrasound (EUS) has been considered the reference standard for tumor (T) and nodal (N) statuses in recent decades. However, thanks to technological improvements, computed tomography (CT) has gained an important role, not only in the assessment of distant metastases (M status) but also in T and N staging.

  • stomach neoplasms
  • positron emission tomography computed tomography
  • tomography
  • magnetic resonance imaging

1. Endoscopic Ultrasonography (EUS)

EUS is a combined technique used for endoscopy and high-frequency ultrasound (5–12 Hz) that provides high-resolution images with a limited penetration depth (between 1 and 6 cm). Dilatation of the lumen (200–400 mL) with water may contribute to a better assessment of the gastric walls.
The normal gastric wall is presented as a 5- to 9-layered structure [1][17], according to the high resolution of the probes: not all layers correspond to the histological ones, since some of them can present echoes due to interfaces. The two inner layers (hyper and hypo-echoic, respectively) represent the superficial mucosa and the muscularis mucosa. The 3rd (hyperechoic) layer corresponds to the submucosa, the 4th (hypoechoic) to the muscularis propria, and the 5th (hyperechoic) to the serosa, which is usually not easily distinguishable from the surrounding hyperechoic adipose tissue.
Nowadays, there is no consensus on the normal thickness of the gastric wall, but 2–4 mm should be considered the normal range [2][18].
GC usually presents as inhomogeneous hypoechoic wall thickening that is focal or diffuse, affects one or more layers, has possible growth outside the wall and eventually infiltrates other structures [1][17].

T and N Staging

The overall accuracy of EUS for T staging ranges from 65 to 92.1%. In particular, the sensitivity and specificity for serosa involvement range from 77.8 to 100% and from 67.9% to 100%, respectively [3][9]. By grouping GC according to the WHO classification, the sensitivity for more invasive tumors increases and ranges from 88.1% for T1 to 99.2% for T4 [4][19].
Although EUS is considered the imaging modality of choice for locoregional staging of GC, it has several limitations. First, it is an operator-dependent technique that is invasive and is associated with sedation-related complications. In addition, not all gastric regions can be easily assessed, and special attention is paid to the lesser curvature, subcardiac region and gastroesophageal junction. The same problems occur with extensive ulceration and with large lesions [5][20].
Nodal metastases are visualized on EUS as roundish, hyperechoic metastases located in perigastric zones. The overall accuracy of EUS in N staging generally ranges from 66 to 90% [6][7][21,22] with low sensitivity values for stages N2 and N3 [6][21]. One of the most important advantages of EUS in N staging is the possibility of fine needle aspiration (EUS-FNA), which contributes to the improvement of the overall accuracy. In this regard, the sensitivity, specificity and positive predictive value of EUS-FNA increase to 92%, 98% and 97%, respectively [8][23].
In addition, EUS has a limited depth of penetration and is therefore of limited use in the evaluation of distant metastases, which are usually investigated by other diagnostic methods [8][23].
Table 1. Details of the most important papers regarding the usefulness of EUS in the staging of GC patients.
Ref # Manuscript Type Main Findings
[4][19] Meta-analysis
-
EUS results depend on the disease stage
-
Pooled sensitivity levels for T1 and T2 were 88.1 and 82.3%, respectively, while they were 89.7 and 99.2% for T3 and T4
-
Pooled sensitivity levels for N1 and N2 were 58.2% and 64.9%
Although recommendations are not yet available, the use of butylscopolamine bromide for hypotension and the use of water as an oral contrast agent may be considered useful, as for CT. The fat-suppressed T1-weighted gradient echo sequence, T2 weighted images with single-shot fast spin echo or turbo spin echo, and true fast imaging with steady-state precession (true-FISP) are common sequences for the detection of gastric cancer [15][42].

TNM Staging

As mentioned above, CT can be considered a useful tool for the staging of GC patients. However, MRI should also be considered for these purposes. In fact, a meta-analysis [17][44] comparing the diagnostic value of the most common imaging modalities for the staging of GC was published in 2012. This showed that the overall accuracy in the T-stage assessment of MRI was statistically better than that of CT (82.9% ± 3.7% vs. 71.5% ± 2.7%). MRI also appeared to be better than CT in terms of sensitivity in assessing the N parameter of GC (85.3% and 77.2%, respectively). Another meta-analysis [18][45] showed that the pooled sensitivity of MRI in diagnosing GC stages T1, T2, T3 and T4 was 66%, 85%, 86% and 88%, respectively, and it was 86% for correctly assessing the N parameter. When analyzing the diagnostic values according to the T stage, some authors [19][46] reported that CT and MRI had accuracy levels of 37.5% and 50% for the T1 stage and 81.2% and 88.7% for the T2 stage, respectively; moreover, they showed no significant differences in accuracy in the evaluation of T3 and T4 lesions, suggesting that MRI may be more suitable for identifying EGC. These aspects were confirmed in a similar study [20][47], which reported that MRI was superior for detecting T1 lesions compared with CT (50% vs. 37.5% accuracy for MRI and CT, respectively) [21][37], with overall accuracy levels of 60% and 48% for the T stage and 68% and 72% for the N stage, respectively. Finally, a 2017 systematic review [22][48] found that both the specificity and sensitivity of MRI were greater than those of CT (86% vs. 83% and 88% vs. 86%, respectively), although without statistical significance. Advances in imaging techniques, such as the introduction of diffusion-weighted imaging (DWI), may provide important data for the definitive diagnosis of various pathologic entities. In this context, DWI can help to distinguish T4 from the lower stages of GC with a high reliability [23][49]. The authors reported a sensitivity of 92.1%, specificity of 75%, and accuracy of 89.1% for ≤T2 vs. ≥T3 lesions and a sensitivity of 75%, specificity of 88.5%, and accuracy of 82.6% for ≤T3 vs. T4 lesions in 46 patients (Figure 19).
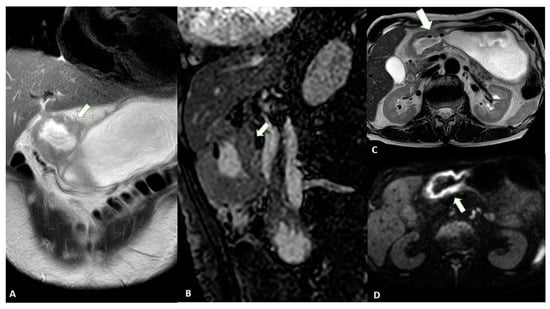
Figure 19. MRI images of a T3 gastric cancer of the gastric antrum in a 79-year-old male patient. (A) Coronal 2D image and (C) Axial 2D image of the Turbo Spin Echo (TSE) T2 sequence showing a circumferential lesion (arrow) invading the subserosa layer with an intermediate signal intensity; (B) Coronal 2D Balance Fast Field Echo (BFFE) sequence showing a circumferential lesion (arrow) with a low signal intensity; (D) Axial Diffusion Weighted Image (DWI) showing an area of signal restriction (arrow) corresponding to the tumor.
Another study reported that the diagnostic accuracy of DWI in T staging, lymph node staging and distant metastasis is comparable to that of CT, with DWI performing better in the detection of nodal metastasis [24][50]. In addition, some authors [25][51] have highlighted the use of DWI in the assessment of the T stage in patients with gastric cancer. By evaluating 51 patients who underwent MRI, the authors demonstrated that DWI can significantly increase the overall detection accuracy for all lesions (88.2% vs. 76.5%, p = 0.031). MRI is also an efficient tool for the diagnosis of distant metastases, such as those in the liver and peritoneum. A recent review and meta-analysis compared the diagnostic accuracy of MRI with hepatobiliary contrast with CT [26][52]: it was demonstrated that the sensitivity of MRI was significantly higher (sensitivity and specificity per lesion of 86.9–100.0% and 80.2–98.0% versus 51.8–84.6% and 77.2–98.0% for MRI and CT respectively). In addition, the authors demonstrated that the sensitivity of MRI increases for lesions smaller than 10 mm (RR = 2.21, 95% CI = 1.47–3.32, p < 0.001). In addition, DWI should be considered a useful tool for the evaluation of peritoneal dissemination. Indeed, a recently published meta-analysis highlights the good diagnostic value for the detection of peritoneal carcinomatosis, with pooled sensitivity and specificity values of 89% (95% confidence interval [CI]: 83–93%) and 86% (95% CI: 79–91%), respectively. When included studies were grouped by primary tumor, a pooled sensitivity of 97% (95% CI: 68–100%) was reported for gastrointestinal malignancies [27][53].
Table 24.
Details of the most important papers regarding the usefulness of MRI in the staging of GC patients.
Ref # Manuscript Type Main Findings
[17][44] Meta-analysis
-
MRI performed better in preoperative staging in comparison with CT
-
Agreement between pre- and postoperative TNM staging was not perfect
[5][20] Original study
-
The accuracy for detecting intramucosal cancer was 78%
-
Accuracy was lower in lesions located in the upper stomach
[6][21] Original study
-
Overall accuracy of 74.7%
-
Accuracy for T staging of 61.7%
-
Accuracy for N staging of 66%
[7][22] Original study
-
EUS and CT produce comparable results regarding T and N staging
-
EUS produces better staging of T2 and T3 lesions

2. Computed Tomography (CT)

Before performing CT, the patient must be fasting for at least 6 h, and pharmacological hypotonization is achieved with 10–20 mg of butylscopolamine bromide administered intramuscularly or intravenously 10 to 15 min before the examination [9][24]. To achieve optimal gastric distension, negative (air) or neutral (water or methylcellulose) contrast agents are usually used to better visualize the enlargement of each layer of the gastric wall [10][25]. The administration of intravenous contrast medium is mandatory for the examination of the gastric walls. CT images should be acquired at least in the unenhanced phase and approximately 70 s after injection, the optimal time for GC enhancement. To assess the presence of vascular variants of the stomach, arterial phase imaging can be added [11][26]. Finally, postprocessed reconstructions (multiplanar reconstructions—MPR) in the coronal and sagittal planes can provide a better assessment of the tumor location and depth. Virtual gastroscopy (VG) is a CT-reconstructed three-dimensional (3D) endoluminal image set that simulates an endoscopic view. For VG, air is the preferred oral contrast agent. Limitations of this technique include the additional time (10 to 20 min) required to process the images and the higher level of technical expertise needed. Normal gastric walls show a multilayered pattern with an inner enhancing layer that histologically corresponds to the gastric mucosa. The intervening hypoattenuating layer represents the submucosa, and the outer, slightly hyperattenuating layer of variable thickness corresponds to the muscularis propria and serosa layer [12][27]. Gastric cancer presents as focal or diffuse wall thickening characterized by inhomogeneous enlargement that destroys normal gastric wall structures [12][27]. Therefore, the size of the gastric wall thickening and the degree of enhancement may affect the detection rate and accuracy of T-staging. In particular, focal thickening of greater than 5 mm in a well-expanded stomach is considered a neoplastic lesion [13][28].

3. Magnetic Resonance Imaging (MRI)

In the past, MRI had a limited role in the evaluation of GC, especially because of the presence of motion artifacts, the long examination time, and the high cost [14][41]. However, in recent decades, major advances have been made in MRI technology that have improved the diagnostic performance in many areas of medicine, including oncology. These improvements include rapid breath-hold imaging techniques, abdominal bandage placement, the administration of anti-inflammatory drugs, and the use of phased array coils. MRI has the great advantage of providing superior soft tissue contrast and multiple imaging sequences without radiation-related risks. In addition, the high quality soft tissue imaging achieved with MRI allows the visualization of the anatomic wall layers [15][42]. However, the guidelines for the treatment of GC do not specify MRI as a possible imaging modality for staging. In addition, the most recent TNM guidelines do not recommend the use of MRI for the imaging assessment of T, N or M parameters in GC [16][43].
[18][45] Meta-analysis
-
Good diagnostic accuracy for preoperative T staging
-
Fair diagnostic accuracy for preoperative N staging
[19][46] Original study
-
The overall sensitivity levels of CT and MRI are comparable
-
MRI accuracy was higher for T1 and T2 (50% vs. 37.5% and 81.2% vs. 68.7%)
[22][48] Meta-analysis
-
MRI had a similar per-patient diagnostic accuracy to PET
-
MRI did not outperform CT in terms of staging
[23][49] Original study
-
DWI can increase the sensitivity of T and N staging
-
Preoperative ADC values correlated with pT staging
-
A significant difference in ADC between ≤T3 and T4 stages was found
[24][50] Original study
-
The sensitivity of DWI in N staging was 75%, 79.3%, and 60% for N1, N2 and N3
-
The specificity of DWI in N staging was 84.6%, 77.3%, and 97.6%, for N1, N2, and N3
[25][51] Original study
-
The accuracy of MRI increased by adding DWI in comparison with using T2WI and contrast-enhanced sequences alone (88.2% vs. 76.5%)

4. Comparison between Techniques

Recently, several studies have compared the two imaging modalities and demonstrated that CT has higher accuracy for T staging than EUS [28][29][30][29,54,55]. In this regard, since 2005 [29][54], it has been highlighted that the accuracy of CT in T-staging almost equals that of EUS and that CT could replace EUS for preoperative staging. Similarly, in a study involving 227 patients [31][56], CT and EUS were shown to have similar T-staging accuracy levels in tumors without ulcerative portions, whereas CT performed significantly better for ulcerative tumors (p < 0.0001). In agreement with the above studies, some authors [32][57] found that the accuracy of T staging with EUS and CT was 87.5% and 83.3%, respectively, whereas the accuracy of N staging was 79.1% and 75.0%. Analogous results were reported [33][58] when comparing VG and EUS for the detection of gastric cancer. The authors showed that the prediction of the T stage was similar between the two techniques with accuracy levels of 82.2% and 83.7%, respectively. In another study in which MRI, CT, and EUS were performed in the same population of gastric cancer patients, the results showed the highest sensitivity for EUS (94%) compared with MDCT (65%) and MRI (76%), underscoring the primary role of this technique in detecting locally advanced tumors. Conversely, MRI and CT yielded significantly higher specificity levels, demonstrating that both techniques are better able to detect tumors without serous invasion [34][59]. In ulcerated EGC, the accuracy of EUS was shown to be lower compared to lesions without ulceration (30.8% vs. 93.3%), while CT showed no significant differences between them (61.5% vs. 86.7%) [35][60]. Finally, a diagnostic meta-analysis [36][61] was used to determine the accuracy of CT and EUS in the staging of GC. The results indicated that EUS is superior to CT for T1 staging (AUC 0.903 and 0.774, respectively), whereas no significant differences were found for T2–T4 lesions (AUC 0.845 and 0.793, 0.814 and 0.804, and 0.846 and 0.930 for T2, T3 and T4, respectively) or stage N1 (AUC 0.690 and 0.693, respectively). Subsequently, the sensitivity of CT was significantly higher for N2 (0.562 vs. 0.301) and N3 (0.211 vs. 0.162).

5. Positron Emission Tomography (PET)

Even through PET-CT is considered a useful diagnostic tool for different cancer types, there is no evidence or recommendations by the most important international guidelines that it is a necessary examination step in the staging of GC [37][62]. By searching the international literature, it is possible to understand the lack of experience worldwide, which may be due to the initial reports which stated that gastric tumors are frequently not fluorodeoxyglucose (FDG)-avid [37][62]. On the other hand, FDG-PET is useful, particularly for the detection of the node status and, consequently, to determine the best treatment option. In this setting, a recently published paper [38][63] demonstrated that the majority of patients have an FDG-avid tumor (80.6%) and that the T stage is strictly associated with the FDG-avidity (T2–3 OR = 3.38 while T4 OR = 7.46). On the other hand, the authors demonstrated that about 25% of nodes are FDG-avid. They finally concluded that the sensitivity and specificity for metastatic disease are more than acceptable (49.3% and 97.1%, respectively). FDG-PET can play a role in determining the management of GC patients. More recently, some authors [39][64] conducted a systematic review of data from 11 studies representing more than 2000 patients from the last decade. The authors reported management changes in 3 to 29% of cases, while no studies reported the risk of recurrence or survival rates in patients staged with or without FDG-PET. Even through FDG-PET has some limitations in the detection and T staging, different studies have investigated its importance in the evaluation of nodes. CT is known to be a reliable tool for identifying pathological nodes [40][35], even though it is not too robust, as previously mentioned. On the other hand, FDG-PET can be considered a reliable imaging examination method to identify small metabolically active nodes [41][65]. During the last year, a systemic review [41][65] aimed to determine the added value of FDG-PET in the detection of node metastases. The authors underlined that the SUVmax is a metabolic parameter that is commonly used to detect the node status. However, SUVmax is susceptible to the blood glucose concentration, the timing of the uptake, respiratory motion, and the interobserver variability. To endorse the usefulness of SUVmax, a published study that enrolled 151 patients with confirmed node metastasis demonstrated that 18% of the patients showed positive FDG uptake and, by using a cutoff value of 2.8, it was possible to predict relapse-free survival (RFS) and (OS) [42][66]. By combining pathological data and imaging features, they demonstrated that SUVmax can be considered an independent prognostic factor for OS (HR = 2.80). Not only metabolic activity but also number counts can be used. In 2016, by retrospectively enrolling 50 patients, some authors [43][67] demonstrated that the number of metabolically positive nodes correlated with histological results (r = 0.694, p = 0.001). In the final model, the authors demonstrated that only surgical outcomes (R1 vs. R0) and the number of metabolically positive nodes (≤2 vs. ≥3) were independent factors for poor OS. To move forward and better depict primary tumors, in recent years, the use of labeling peptides has been proposed with the introduction of 1,4,7,10-tetraazacyclodecane-1,4,7,10-tetraacetic acid (DOTA), a universal chelator that is capable of forming stable complexes with radiotracers of the metal Gallium (Ga). Moreover, different labeling peptides were developed to be taken up by gastric cancer cells with a special focus on fibroblast-activated protein (FAP) conjugated with DOTA. In this setting, different studies have reported that Ga-FAPI is taken up more intensely by tumors than FDG, resulting in a higher sensitivity for the detection of primary lesions and metastases [44][68]. In 2022, a study [45][69] enrolled 61 patients and compared FDG and Ga-FAPI. The authors demonstrated a higher positive detection rate for Ga-FAPI in comparison with FDG in the evaluation of primary tumors. On the other hand, they concluded that both modalities underestimated N staging compared with pathological N staging. Similar results were found in two studies that enrolled 35 and 25 patients with gastric cancer, respectively [46][70]. Moreover, one of them [46][70], demonstrated that Ga-FAPI exhibited a higher sensitivity level compared to FDG for the N status (97.4% vs. 42%) and the detection of distant metastases (97.2% vs. 43.1%). Similar results were reported regarding the node status, indicating that Ga-FAPI detected more positive nodes than FDG (637 vs. 407), even if both modalities underestimated them in comparison with pathological staging [46][70]. Finally, even though the application of PET is not yet recommended by international guidelines, all reported studies demonstrated its potential for detecting not only the primary tumor, reducing the false negative rate, but also nodal involvement and distant metastases.