The Proteomics Toolbox to Study Compartmentalized cAMP Signalling: Comparison
Please note this is a comparison between Version 2 by Dean Liu and Version 3 by Dean Liu.

cAMP is a second messenger that regulates a myriad of cellular functions in response to multiple extracellular stimuli. New developments in the field have provided exciting insights into how cAMP utilizes compartmentalization to ensure specificity when the message conveyed to the cell by an extracellular stimulus is translated into the appropriate functional outcome. cAMP signaling uses different mechanisms, including protein–protein interactions (PPIs) and protein phosphorylation, to relay, process, and translate signals into cellular responses. cAMP signaling compartmentalization heavily relies on the formation of local signaling domains where cAMP signaling components involved in a specific cellular response cluster together. Within such domains, cAMP signals are translated into specific cellular responses via the phosphorylation of target proteins. As such, mapping the domain interaction landscape and defining the downstream phosphorylation events are the key aspects of compartmentalized signaling studies.

  • cAMP signaling
  • cAMP compartmentalization
  • G-protein coupled receptor
  • A-kinase anchoring protein
  • phosphodiesterases
  • protein kinase A
  • proteomics

1.Introduction

cAMP signaling uses different mechanisms, including protein–protein interactions (PPIs) and protein phosphorylation, to relay, process, and translate signals into cellular responses. cAMP signaling compartmentalization heavily relies on the formation of local signaling domains where cAMP signaling components involved in a specific cellular response cluster together. Compartmentalization is critically dependent on the assembly of multiple signaling components that come together via protein–protein interactions to become functional signaling units. Within such domains, cAMP signals are translated into specific cellular responses via the phosphorylation of target proteins. As such, mapping the domain interaction landscape and defining the downstream phosphorylation events are the key aspects of compartmentalized signaling studies. Typically, the proteomics analysis of PPIs and protein phosphorylation is usually performed in a quantitative manner, so the changes in phosphorylation events across experimental conditions can be compared, and true signalosome components can be distinguished from the background. Below researchers describe the proteomics toolbox can be utilized to identify the molecular components of these domains and to define the dynamic cellular cAMP signaling landscape.

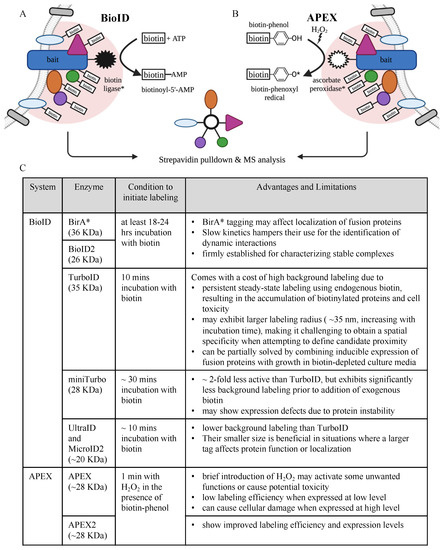
2. Protein Interaction and Proximity Profiling—Basic Principles

In MS-based interaction proteomics, the constituents of protein signaling complexes are systematically mapped. Several MS-based interactomics strategies, including affinity purification-MS (AP-MS), proximity labeling-MS (PL-MS), crosslinking-MS and coFractionation-MS (coFrac-MS), have been comprehensively reviewed recently [1]. Among these methods, AP-MS and PL-MS are the most commonly adopted for PPI studies. The AP-MS workflows involve multiple steps, including (i) cell lysis, (ii) incubation of lysate with a specific antibody, followed by capturing with protein A/G beads or with resins conjugated with epitope tag-specific antibodies, (iii) several extensive washing steps to remove non-specific binding proteins and elution of the enriched proteins, and (iv) identification of the eluted proteins by LC-MS/MS. Since purification is performed post-lysis, one challenge is that some detected PPIs may be spurious and non-physiological as the bait and prey may be brought together by chance upon lysis, giving rise to biological false positives. Technical false positives often arise from nonspecific protein binding to the affinity matrices. In addition, mapping the interaction landscape of integral membrane proteins remains a technical challenge. Detergents used to solubilize membrane proteins may disrupt antigen-antibody recognition and membrane protein complexes [2]. Additionally, the success of AP-MS often depends on stable protein interactions, while weak and transient interactors can be lost easily during cell lysis and extensive washing steps.
In recent years, PL-MS has been developed to overcome these limitations. Since its introduction in 2012 [3], PL-MS has been used for PPI mapping and proximity profiling in several cell models and organisms. The technique is based on the labeling of the “neighboring” proteins to the bait protein. These include proteins that physically interact with the bait and other proteins that are in close proximity to the bait. In this approach, the bait protein is expressed as a fusion protein with an enzyme capable of biotin labeling—either as an exogeneous protein or endogenously, under the control of the target gene promoter, using CRISPR/Cas9-mediated genome editing technology [4][5]. Biotin is then added, followed by its catalysis by the fused enzyme into reactive biotin intermediates. These intermediates subsequently diffuse away to biotinylate proteins in the vicinity, a process named promiscuous biotinylation. The labeling strength of these intermediates is limited by the distance of the prey away from the bait. This gives rise to an important concept coined as the “effective labeling radius”. The same experimental settings, but with the expression of free enzyme, are commonly used as a control to reveal false positives that are randomly labeled or that are labeled due to their non-specific association with the enzyme.
If transient interactions have ceased and the binding partners have moved away from the bait protein at the time of extraction, that is not a problem since interacting, and other relevant proteins have already been “marked”. The denaturing condition can then be applied to solubilize the whole proteome without the need to preserve protein interactions. This characteristic of PL approaches is a great advantage for spatiotemporal proteomics. Biotinylated proteins are then purified using avidin/streptavidin-coated beads and are identified by MS. As the biotin-avidin association is the strongest known non-covalent interaction, multiple stringent washing steps can be performed to minimize background contaminants. Similar to AP-MS, to distinguish bona fide proximal proteins from irrelevant labeled proteins, the PL experiment is usually combined with quantitative proteomics approaches, either based on isotopic labeling or label-free quantification.
There are two main enzyme systems used in PL-MS, which are promiscuous biotin ligases, or BioID, in the case of proximity-dependent biotin identification and peroxidases, or APEX, in the case of peroxidase-catalyzed proximity labeling (Figure 1). The promiscuous biotin ligase catalyzes the conversion of biotins to the highly reactive biotinoyl-5′-AMP intermediates to react with proximal primary amines (i.e., lysine residues), leading to the promiscuous biotinylation of surrounding proteins within an estimated radius of 10 nm [6]. Depending on the types of promiscuous biotin ligases used, proximity labeling can occur within ten minutes and up to 18–24 h after the addition of exogeneous biotin [6][7][8][9][10][11] (Figure 1). APEX utilizes modified soybean ascorbate peroxidase to catalyze the oxidation of biotin-phenol to produce highly reactive biotin phenoxyl radicals, which can react with neighboring electron-rich amino acids such as tyrosine and possibly tryptophan, cysteine, and histidine [12]. The reaction requires H2O2 treatment in the presence of biotin-phenol to produce the radicals, and labeling can be achieved in as short a time as 1 min [12], meaning that the biotin labeling can be timely controlled through H2O2 availability. This becomes very practical for studies that require cell incubation with ligands for a period of time before initiating the labeling. Additionally, the short half-life of the radicals (<1 ms) and their inability to cross membranes ensures that labeling occurs only within an estimated radius of 20 nm and is contained only within the candidate space [12]. These are, in fact, the key advantages of APEX over BioID. Several current developments in PL-MS have focused on the use of different fusion biotinylating enzymes with a small size to reduce mislocalization and to improve the efficiency and speed of labeling so as to capture PPIs at a higher temporal resolution. These include BioID2 [7], TurboID [8], miniTurbo [8], UltraID [9] and MicroID2 [10] biotin ligases and APEX2 ascorbate peroxidase [13] (Figure 1). The experimental details of PL-MS have been reviewed by several recent publications [1][14][15][16].
Figure 1. Schematic representation of PL-MS systems. (A) In BioID, a target (bait) protein is fused to a modified biotin ligase that catalyzes the conversion of biotin to biotinoyl-5′-AMP. This highly reactive form of biotin covalently attaches to accessible lysine residues within the labeling radius (depicted as a pink semi-circle) of ~10 nm. (B) APEX is based on the expression of bait protein fusion to the ascorbate peroxidase derivative that catalyzes the oxidation of biotin-phenol to reactive biotin-phenoxyl radical in the presence of H2O2. The radical reacts with electron-rich amino acids within a 20 nm radius, resulting in the biotin labeling of proximal proteins. Cells are lysed, and biotinylated proteins are enriched using streptavidin beads and analyzed by LC-MS/MS. (C) Summary of biotin labeling enzymes developed for BioID- and APEX-based PL-MS [7][8][9][10][11][12][13][17]. The figure was created with Biorender.com.

3. Phosphoproteomics

cAMP signals are translated into specific cellular responses largely through protein phosphorylation. Accordingly, mapping the cAMP-dependent phosphorylation landscape is key to establishing the topology and functions of cAMP signaling domains. Current state-of-the-art phosphoproteomics technologies allow investigators to identify and quantify at a depth of >10,000 phosphorylation sites in a population of cells in one setting, with high specificity and reproducibility [18][19]. This unprecedented resolution provides a new perspective on the molecular mechanisms underlying diseases and the identification of potential therapeutic targets.
It has been well documented that the identification and quantification of phosphorylated peptides are constrained by their low abundance and stoichiometry relative to their non-phosphorylated counterparts. Besides, during MS data analysis, the proper assignment of a phosphate group among several phosphorylatable residues within a peptide sequence has also posed a considerable challenge [20]. Due to the inherently low stoichiometry, the phosphoproteomics workflows heavily rely on enrichment protocols prior to MS analysis [21]. While the detailed may vary in different workflows, the combination of initial fractionation, phosphopeptide enrichment, stable isotope labeling, and LC-MS/MS has become the method of choice. To enhance the coverage of phosphopeptides, orthogonal peptide fractionation strategies, such as low-pH strong cation exchange (SCX) or high-pH reversed-phase chromatography, are often performed prior to the enrichment [19][22][23][24][25][26]. For quantification, both stable isotope labeling approaches and label-free quantification have been employed [18][19][25][26].
Several affinity enrichment strategies have also been developed to isolate phosphopeptides [21]. For global enrichment of phosphopeptides, immobilized metal affinity chromatography (IMAC) and metal oxide affinity chromatography (MOAC) are the two most popular approaches. IMAC is based on the interaction of positively charged metal ions such as Fe3+ or Ti4+ with the negatively charged phosphate groups in the phosphopeptides [23][24]. As the name implies, MOAC uses metal oxides, such as TiO2, to capture phosphopeptides through the formation of the bidentate binding mode of phosphates to the metal oxide surface [27]. In terms of enrichment efficiency, the two methods are generally comparable, with each showing preferences toward distinct phosphopeptide subpopulations [28][29]. This is not surprising as the two enrichment techniques bind differently to the phosphopeptides. Of note, researchers have found that the SCX-Ti4+-IMAC enrichment method, developed by Heck’s laboratory, shows advantages when it comes to the identification of PKA phosphorylation events [24]. Phosphorylation sites of basophilic kinases, such as PKA or PKC, usually display high basic residue (R/K) content in the neighborhood that can hinder the enrichment of the peptides. The SCX-Ti4+-IMAC method was shown to specifically enrich this subset of phosphopeptides [24], therefore, providing extra benefit in the analysis of PKA substrates. Additionally, a more targeted enrichment platform for PKA phosphorylated substrate identification was developed by the same laboratory [30]. The method utilizes specific antibodies against the PKA phosphorylation consensus to capture peptides bearing the motif from cell lysate digests. The high specificity and selectivity of the platform were illustrated by the fact that 98% of the phosphopeptides identified in the study were found to harbor the PKA consensus motif [30].
Phosphoproteomics data analysis involves the identification and quantification of phosphopeptides and the localization of the phosphorylation sites. Even though peptides may be tentatively identified as phosphorylated, it might not be possible to assign the actual sites of modification. In fact, the correct localization of phosphorylation sites is a critical aspect of phosphoproteomic data analysis. Site localization can be complicated when multiple potential phosphoresidues are present within a single peptide, and peptides harboring adjacent or multiple phosphorylated residues can become problematic. In order to resolve the ambiguity between multiple potential sites, the site-determining fragments ions exclusive to a specific site location must be obtained in MS/MS spectra. If these fragment ions are not generated efficiently during fragmentation, the site localization will be significantly impaired. For this purpose, several peptide fragmentation modes have been developed to produce good-quality fragmentation spectra for the assignment of phosphorylation site(s) and are described elsewhere [31]. For a large-scale proteomics experiment involving thousands of phosphopeptides, probability-based site-localization algorithms have been developed and implemented in the main software tools to determine the most likely phosphorylation site(s) and are extensively reviewed elsewhere [32]. In terms of quantification, confident site localization is important since only the phosphopeptides in which phosphorylation sites are assigned can be used for quantitation.
To translate a list of differentially regulated phosphorylation events into biological insight, Gene Ontology (GO) enrichment analysis can be performed to deconvolute the biological processes in which the list of proteins harboring the phosphopeptides are involved [33]. Another important bioinformatic task is the identification of the protein kinases/phosphatases responsible for the observed changes in phosphorylation. Generally, the prediction is based on the kinase phosphorylation motif, and several prediction tools are available and extensively reviewed elsewhere [34]. Interestingly, studies using these prediction tools and investigating the cAMP-associated phosphoproteome have found that phosphorylation mediated by several other kinases, in addition to PKA, is upregulated in response to an increase in cAMP levels [35][36][37]. These studies have also found that many phosphopeptides are downregulated by cAMP. Overall, these observations indicate that cAMP activates complex signaling networks involving other kinases as well as phosphatases. These networks are bound to be relevant for the regulation of cellular function, although researchers currently have very little understanding of the role that this more extensive and complex wiring of intracellular signaling plays in cell physiology.
The specific examples of the proteomics applications to address particular questions in cAMP signaling compartmentalization are described in detail in  https://doi.org/10.1161/CIRCRESAHA.122.321448 and https://doi.org/10.3390/ijms24054667

References

  1. Low, T.Y.; Syafruddin, S.E.; Mohtar, M.A.; Vellaichamy, A.; NS, A.R.; Pung, Y.F.; Tan, C.S.H. Recent progress in mass spectrometry-based strategies for elucidating protein-protein interactions. Cell. Mol. Life Sci. 2021, 78, 5325–5339.
  2. Lee, Y.-C.; Bååth, J.A.; Bastle, R.M.; Bhattacharjee, S.; Cantoria, M.J.; Dornan, M.; Gamero-Estevez, E.; Ford, L.; Halova, L.; Kernan, J.; et al. Impact of detergents on membrane protein complex isolation. J. Proteome. Res. 2018, 17, 348–358.
  3. Roux, K.J.; Kim, D.I.; Raida, M.; Burke, B. A promiscuous biotin ligase fusion protein identifies proximal and interacting proteins in mammalian cells. J. Cell Biol. 2012, 196, 801–810.
  4. Samavarchi-Tehrani, P.; Abdouni, H.; Samson, R.; Gingras, A.-C. A Versatile Lentiviral Delivery Toolkit for Proximity-dependent Biotinylation in Diverse Cell Types. Mol. Cell. Proteom. 2018, 17, 2256–2269.
  5. Vandemoortele, G.; De Sutter, D.; Moliere, A.; Pauwels, J.; Gevaert, K.; Eyckerman, S. A Well-Controlled BioID Design for Endogenous Bait Proteins. J. Proteome Res. 2019, 18, 95–106.
  6. Kim, D.I.; Kc, B.; Zhu, W.; Motamedchaboki, K.; Doye, V.; Roux, K.J. Probing nuclear pore complex architecture with proximity-dependent biotinylation. Proc. Natl. Acad. Sci. USA 2014, 111, E2453–E2461.
  7. Kim, D.I.; Jensen, S.C.; Noble, K.A.; Kc, B.; Roux, K.H.; Motamedchaboki, K.; Roux, K.J. An improved smaller biotin ligase for BioID proximity labeling. Mol. Biol. Cell 2016, 27, 1188–1196.
  8. Branon, T.C.; Bosch, J.A.; Sanchez, A.D.; Udeshi, N.D.; Svinkina, T.; Carr, S.A.; Feldman, J.L.; Perrimon, N.; Ting, A.Y. Efficient proximity labeling in living cells and organisms with TurboID. Nat. Biotechnol. 2018, 36, 880–887.
  9. Kubitz, L.; Bitsch, S.; Zhao, X.; Schmitt, K.; Deweid, L.; Roehrig, A.; Barazzone, E.C.; Valerius, O.; Kolmar, H.; Béthune, J. Engineering of ultraID, a compact and hyperactive enzyme for proximity-dependent biotinylation in living cells. Commun. Biol. 2022, 5, 657.
  10. Johnson, B.S.; Chafin, L.; Farkas, D.; Adair, J.; Elhance, A.; Farkas, L.; Bednash, J.S.; Londino, J.D. MicroID2: A Novel Biotin Ligase Enables Rapid Proximity-Dependent Proteomics. Mol. Cell. Proteom. 2022, 21, 100256.
  11. May, D.G.; Scott, K.L.; Campos, A.R.; Roux, K.J. Comparative Application of BioID and TurboID for Protein-Proximity Biotinylation. Cells 2020, 9, 1070.
  12. Rhee, H.W.; Zou, P.; Udeshi, N.D.; Martell, J.D.; Mootha, V.K.; Carr, S.A.; Ting, A.Y. Proteomic mapping of mitochondria in living cells via spatially restricted enzymatic tagging. Science 2013, 339, 1328–1331.
  13. Lam, S.S.; Martell, J.D.; Kamer, K.J.; Deerinck, T.J.; Ellisman, M.H.; Mootha, V.K.; Ting, A.Y. Directed evolution of APEX2 for electron microscopy and proximity labeling. Nat. Methods 2015, 12, 51–54.
  14. Trinkle-Mulcahy, L. Recent advances in proximity-based labeling methods for interactome mapping. F1000Res 2019, 8, F1000.
  15. Bosch, J.A.; Chen, C.L.; Perrimon, N. Proximity-dependent labeling methods for proteomic profiling in living cells: An update. Wiley Interdiscip. Rev. Dev. Biol. 2021, 10, e392.
  16. Gingras, A.-C.; Abe, K.T.; Raught, B. Getting to know the neighborhood: Using proximity-dependent biotinylation to characterize protein complexes and map organelles. Curr. Opin. Chem. Biol. 2019, 48, 44–54.
  17. Chua, X.Y.; Aballo, T.; Elnemer, W.; Tran, M.; Salomon, A. Quantitative Interactomics of Lck-TurboID in Living Human T Cells Unveils T Cell Receptor Stimulation-Induced Proximal Lck Interactors. J. Proteome Res. 2021, 20, 715–726.
  18. de Graaf, E.L.; Giansanti, P.; Altelaar, A.F.; Heck, A.J. Single-step enrichment by Ti4+-IMAC and label-free quantitation enables in-depth monitoring of phosphorylation dynamics with high reproducibility and temporal resolution. Mol. Cell. Proteom. 2014, 13, 2426–2434.
  19. Humphrey, S.J.; Azimifar, S.B.; Mann, M. High-throughput phosphoproteomics reveals in vivo insulin signaling dynamics. Nat. Biotechnol. 2015, 33, 990–995.
  20. Dephoure, N.; Gould, K.L.; Gygi, S.P.; Kellogg, D.R. Mapping and analysis of phosphorylation sites: A quick guide for cell biologists. Mol. Biol. Cell 2013, 24, 535–542.
  21. Low, T.Y.; Mohtar, M.A.; Lee, P.Y.; Omar, N.; Zhou, H.; Ye, M. Widening the bottleneck of phosphoproteomics: Evolving strategies for phosphopeptide enrichment. Mass Spectrom. Rev. 2021, 40, 309–333.
  22. Gauci, S.; Helbig, A.O.; Slijper, M.; Krijgsveld, J.; Heck, A.J.; Mohammed, S. Lys-N and trypsin cover complementary parts of the phosphoproteome in a refined SCX-based approach. Anal. Chem. 2009, 81, 4493–4501.
  23. Villén, J.; Gygi, S.P. The SCX/IMAC enrichment approach for global phosphorylation analysis by mass spectrometry. Nat. Protoc. 2008, 3, 1630–1638.
  24. Zhou, H.; Low, T.Y.; Hennrich, M.L.; van der Toorn, H.; Schwend, T.; Zou, H.; Mohammed, S.; Heck, A.J. Enhancing the identification of phosphopeptides from putative basophilic kinase substrates using Ti (IV) based IMAC enrichment. Mol. Cell. Proteom. 2011, 10, M110.006452.
  25. Humphrey, S.J.; Karayel, O.; James, D.E.; Mann, M. High-throughput and high-sensitivity phosphoproteomics with the EasyPhos platform. Nat. Protoc. 2018, 13, 1897–1916.
  26. Mertins, P.; Tang, L.C.; Krug, K.; Clark, D.J.; Gritsenko, M.A.; Chen, L.; Clauser, K.R.; Clauss, T.R.; Shah, P.; Gillette, M.A.; et al. Reproducible workflow for multiplexed deep-scale proteome and phosphoproteome analysis of tumor tissues by liquid chromatography–mass spectrometry. Nat. Protoc. 2018, 13, 1632–1661.
  27. Pinkse, M.W.; Uitto, P.M.; Hilhorst, M.J.; Ooms, B.; Heck, A.J. Selective isolation at the femtomole level of phosphopeptides from proteolytic digests using 2D-NanoLC-ESI-MS/MS and titanium oxide precolumns. Anal. Chem. 2004, 76, 3935–3943.
  28. Matheron, L.; van den Toorn, H.; Heck, A.J.; Mohammed, S. Characterization of biases in phosphopeptide enrichment by Ti(4+)-immobilized metal affinity chromatography and TiO2 using a massive synthetic library and human cell digests. Anal. Chem. 2014, 86, 8312–8320.
  29. Yue, X.; Schunter, A.; Hummon, A.B. Comparing multistep immobilized metal affinity chromatography and multistep TiO2 methods for phosphopeptide enrichment. Anal. Chem. 2015, 87, 8837–8844.
  30. Giansanti, P.; Stokes, M.P.; Silva, J.C.; Scholten, A.; Heck, A.J. Interrogating cAMP-dependent kinase signaling in Jurkat T cells via a protein kinase A targeted immune-precipitation phosphoproteomics approach. Mol. Cell. Proteom. 2013, 12, 3350–3359.
  31. Potel, C.M.; Lemeer, S.; Heck, A.J.R. Phosphopeptide Fragmentation and Site Localization by Mass Spectrometry: An Update. Anal. Chem. 2019, 91, 126–141.
  32. Locard-Paulet, M.; Bouyssié, D.; Froment, C.; Burlet-Schiltz, O.; Jensen, L.J. Comparing 22 Popular Phosphoproteomics Pipelines for Peptide Identification and Site Localization. J. Proteome Res. 2020, 19, 1338–1345.
  33. Ashburner, M.; Ball, C.A.; Blake, J.A.; Botstein, D.; Butler, H.; Cherry, J.M.; Davis, A.P.; Dolinski, K.; Dwight, S.S.; Eppig, J.T.; et al. Gene ontology: Tool for the unification of biology. The Gene Ontology Consortium. Nat. Genet. 2000, 25, 25–29.
  34. Savage, S.R.; Zhang, B. Using phosphoproteomics data to understand cellular signaling: A comprehensive guide to bioinformatics resources. Clin. Proteom. 2020, 17, 27.
  35. Golkowski, M.; Shimizu-Albergine, M.; Suh, H.W.; Beavo, J.A.; Ong, S.E. Studying mechanisms of cAMP and cyclic nucleotide phosphodiesterase signaling in Leydig cell function with phosphoproteomics. Cell. Signal. 2016, 28, 764–778.
  36. Beltejar, M.-C.G.; Lau, H.-T.; Golkowski, M.G.; Ong, S.E.; Beavo, J.A. Analyses of PDE-regulated phosphoproteomes reveal unique and specific cAMP-signaling modules in T cells. Proc. Natl. Acad. Sci. USA 2017, 114, E6240–E6249.
  37. Subramaniam, G; Schleicher, K; Kovanich, D; Zerio, A; Folkmanaite, M; Chao, YC; Surdo, NC; Koschinski, A; Hu, J; Scholten, A; Heck, AJR; Ercu, M; Sholokh, A; Chan Park, K; Klussmann, E; Meraviglia, V; Bellin, M; Zanivan, S; Hester, S; Mohammed, S; Zaccolo M. Integrated Proteomics Unveils Nuclear PDE3A2 as a Regulator of Cardiac Myocyte Hypertrophy. Circ Res. 2023, doi: 10.1161/CIRCRESAHA.122.321448.
More