Your browser does not fully support modern features. Please upgrade for a smoother experience.
Please note this is a comparison between Version 1 by Jun Zhang and Version 2 by Sirius Huang.
Spectroscopy technology is anow popular methods for quantitative and qualitative analysis in fields such as agricultural products and foods by combining with various chemometric methods. In fact, this is the application basis for spectroscopy and spectral imaging techniques in other fields such as genetics and transgenic monitoring. There has been considerable research using spectroscopy (especially near infrared (NIR) spectroscopy) for the effective identification of agricultural products and foods. The principles and characteristics of NIR spectroscopy and its applications in the detection of transgenic agricultural products and foods are described.
- chemometric analysis
- transgenic agricultural products and foods
- near-infrared spectroscopy
1. The Principles and Characteristics of NIRS
Near infrared spectroscopy (NIRS), with a wavelength range between 780 and 2500 nm, can be divided into short-wave NIR (with a range of 780–1100 nm) and long-wave NIR (with a range of 1100–2500 nm) [1][3], and is sometimes used together with a range of 350–780 nm visible range light to form a Vis-NIR spectrum for relevant detection. The state, composition, and structure of the molecule can be obtained by analyzing the primary overtones and oscillations between the hydrogen-containing groups, such as C-H, N-H, O-H, etc., by NIRS [2][4]. The common near-infrared spectrometers consist of a light source, a beam splitter system (wavelength selector), a sample detector, and an optical detector, and some are equipped with a data processing/analysis system for simplicity. The use of these parts should be chosen according to their use. NIR spectroscopy has transmission, diffuse reflection, transmission and reflection detection methods, and the choice of different detection methods is also demand-dependent.
After data acquisition with the spectrometer, the general steps for spectral analysis include: (1) spectral data preprocessing [3][5]; (2) feature wavelength selection [4][6]; (3) model establishment and evaluation [5][7]. The main analysis steps are shown in Figure 1.
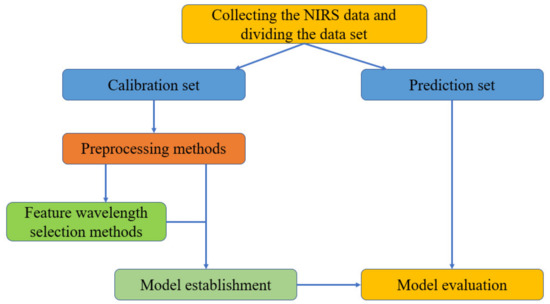
Figure 1.
The general analyzing steps of NIRS data.
1.1. The Spectral Preprocessing Methods
The sample spectrum data collected by the spectrometer contains only not the chemical information of the sample itself, but also other irrelevant information and noise, such as electrical noise, sample background, stray light, etc. [3][5]. Therefore, in the application of chemometric methods for spectral analysis, it is necessary to preprocess the original spectral data to eliminate the irrelevant information and noise in the data, which is a necessary step in the analysis.
Smoothing, derivative, multiple scattering correction (MSC), baseline correction, standard normal transformation (SNV), orthogonal signal correction (OSC), and combinations of these methods are common spectral preprocessing methods [6][7][8][8,9,10].
Smoothing preprocessing is one of the most widely used methods for removing spectral noise. Moving average smoothing (MS) and Savitzk-Golay (SG) smoothing are commonly used smoothing methods. Derivative preprocessing is to eliminate the baseline offset and drift, enhance the spectral band features, and overcome the spectral band overlap [9][11]. The direct difference method and SG derivative method are the commonly used derivative preprocessing methods [10][12]. Baseline correction pretreatment successfully eliminates baseline drift and tilt caused by the instrument’s backdrop and the uneven surface of the sample by artificially pulling the baseline of the absorbance spectrum back to 0 baseline [11][13]. Multiple scattering correction (MSC) preprocessing is mainly used to eliminate the effect of scattering on the spectrum and effectively enhance the spectral information related to the content of sample components; the spectral errors due to factors such as optical path changes or sample dilution can be eliminated [2][12][4,14]. Standard normal variate transformation (SNV) is the processing of spectral data with a mean value of 0 and a standard deviation of 1 [13][15]. Orthogonal signal correction (OSC) is a spectral preprocessing algorithm based on the involvement of physical and chemical values of samples [14][15][16,17]. In order to improve the robustness and prediction ability of the model, the information unrelated to the physical and chemical values of spectral data is removed by orthogonal projection and then analyzed by corresponding modeling methods.
In NIRS preprocessing analysis, MSC and SNV are two well-known methods for reducing spectral distortion due to dispersion, and they have been proven to be effective in correcting the problems of inhomogeneous particle distribution and refractive index variation in food applications [16][17][18,19]. Although these preprocessing methods were aimed to reduce unmodeled variability in the spectra data in order to improve the features sought in the spectra, which are usually linearly related to the phenomenon of interest. However, if incorrect preprocessing techniques are used, the essential information may at risk of information removal [8][10].
1.2. The Feature Wavelength Selection Methods
When all wavelength variables are used for modeling, it may be computationally intensive and time consuming, and sometimes the absorption of NIR spectra is not obvious and the overlap is serious, which contains redundant information, so it is normal to eliminate the irrelevant information and filter out the independent variables with high correlation when modeling. When the useless variable is introduced into the model, it will affect model stability and prediction precision. Therefore, it is necessary to extract the feature wavelength variables from the full spectrum before modeling. At present, the commonly used methods for selecting the characteristic wavelengths [4][18][19][6,20,21] include principal component analysis (PCA), competitive adaptive reweighting (CARS), the genetic algorithm (GA), the successive projection algorithm (SPA), and uninformative variable elimination (UVE), etc.
PCA is a popular linear dimensionality reduction approach that is used to map high-dimensional data into a low-dimensional space using some type of linear projection. It is expected that the variance of the projected dimension is the largest, so that fewer data dimensions can be used and more original data points can be retained, which can reduce dimension and eliminate redundant information [2][4]. CARS is a variable selection method proposed to simulate the “survival of the fittest” principle in Darwin’s evolution theory [20][22]. The idea of GA is to optimize the PLSR model based on the RMSECV of selected variables by genetic iteration [21][22][23,24]. SPA is a method to improve modeling speed and prediction accuracy by reducing the covariance between variables and obtaining the wavelength with the least redundant information [4][23][6,25]. UVE is a wavelength selection algorithm based on the PLSR coefficients, which is used to eliminate the full-wavelength variables, the stability of which is less than the noise, thereby improving the predictive power of the model [24][26]. Sometimes, one feature wavelength selected algorithm is used, and the modeling effect is not very effective, and is therefore often used in combination with other feature wavelength selection methods [24][26].
1.3. Model Establishment and Evaluation
For NIR spectroscopy, a calibration model of the spectra is finally established in a linear and nonlinear way for qualitative or quantitative analysis after the pretreatment or feature wavelength selection.
With the rapid development of statistics, it is an inevitable trend to use mathematical analysis methods [5][7] for more scientific classification and quantitative detection, which can be linear, non-linear, or supervised or unsupervised modes. The common qualitative and quantitative methods are k-nearest (KNN) [25][27], linear discriminant analysis (LDA) [9][26][11,28], partial least squares discriminant analysis (PLS-DA) [27][28][29,30], extreme learning machine (ELM) [25][27], Support vector machine (SVM) [10][29][30][12,31,32], back propagation neural network (BPNN) [31][33], partial least squares regression (PLSR) [32][33][34,35], and radial basis function neural network (RBFNN) [25][27], etc.
After the model is established, the stability and accuracy of the model is evaluated, and the high-quality correction model is selected. Indicators often employed include accuracy, correlation coefficient, standard deviation of calibration and prediction set samples, etc.
NIRS and chemometrics methods are a pair of twin technologies that have been developing in tandem with each other. In recent years, deep learning algorithms, represented by convolutional neural networks (CNN), have been used for quantitative and qualitative modeling of NIR spectra [34][35][36,37]. Compared with traditional machine learning methods, the convolutional neural network can extract the features embedded in the spectral data step by step through multiple convolution and pooling layers, and to a certain extent, the preprocessing of spectra and the selection of variables before modeling can be reduced.
Among the most popular deep learning-based models, the DeepSpectra model has outperformed all the other models [36][38]. The combination of deep learning and spectral detection methods is a promising approach for the quality assessment of food and agricultural products, as well as for genetic modification detection [36][37][38,39].
2. The Applications of NIRS for the Detection of Transgenic Agricultural Products and Foods
In the last few decades, NIRS has demonstrated its power in the detection of agricultural products and foods, and there are now a series of applications in meat detection [38][40], agricultural materials and foods safety control [39][40][41][41,42,43], and fruits and vegetables detection [42][43][44,45]. Taking maize testing as an example, NIRS has been used in a range of applications in the identification of variety purity identification [25][44][45][27,46,47], vigor [46][48], internal components such as moisture and protein [47][48][49][49,50,51], fungal toxins [50][51][52,53], and frost damage [52][54]. Today, there is also equipment that can be used for online monitoring of agricultural products and foods using handheld/portable NIR spectroscopy for industrial applications [53][54][55,56].
With the in-depth study of spectroscopy technology, researchers have started to introduce NIRS technology into the identification of transgenic food and agricultural products, as shown in Table 1.
Table 1.
Studies on the detection of transgenic agricultural products and foods using near-infrared spectroscopy.
| Author | Object | Preprocessing Methods | Models | Results | Reference |
|---|---|---|---|---|---|
| Soo-In Sohn et al. | Transgenic Brassica napus L. | SG, smoothing filter, SNV, Normalization | LDA, CNN, GBT, SVM, RF | The highest accuracy of the combination of SG and SVM was 100%. | [26][28] |
| Soo-In Sohn et al. | Transgenic Brassica napus L. | Normalization, SNV, SG | LDA, Deep Learning, SVM, GLM, DT, NB, FLM, RF |
99.4% classification accuracy for SNV and SVM, 99.1% classification accuracy for SG and deep learning | [9][11] |
| Lijuan Xie et al. | Transgenic Tomatoes | MSC, 1st and 2nd derivatives | DA, PLS-DA | PLS-DA with the classification accuracy of 100% | [13][15] |
| Lijuan Xie et al. | Transgenic Tomatoes | MSC, SG 1st, 2nd | SIMCA, DPLS | DPLS with the classification accuracy of 100% | [12][14] |
| Lijuan Xie et al. | Chlorophyll Content of Transgenic Tomato Leaves | MSC, 1st and 2nd derivatives | PLS-DA | PLS-DA with the classification accuracy of 100% | [55][57] |
| Lijuan Xie et al. | Transgenic tomato leaf | MSC, 1st and 2nd derivatives | DA, PLS | With the classification accuracy of 89.7% | [56][58] |
| Lijuan Xie et al. | ethylene content in tomatoes | SNV, MSC, 1st and 2nd derivatives | PLSR, SMLR | PLSR and SMLR can determine the ethylene content in tomato. | [33][35] |
| Wenchao Zhu et al. | Leaves of transgenic rice, SPAD in leaf | MSC, OSC | LS-SVM | SPA-LS-SVM method can quickly identify transgenic rice leaves and accurately predict the SPAD value. | [15][17] |
| Takefumi Hattori et al. | Transgenic rice straw | 1st and 2nd derivatives, SNV | PLSR | SNV-PLSR obtained a strong correlation between laboratory wet chemistry values and NIR predicted values. | [32][34] |
| Long Zhang et al. | Transgenic Rice | SNV, PCA | PLS-DA | The correct classification rate of the validation test was 100.0%. | [57][59] |
| Yong Hao et al. | Transgenic Rice | NWS, SNV, MSC, SG 1st-Derivative | PLS-DA, SVM | Model achieved good analytical results with 100% accuracy rate. | [58][60] |
| Mayara Macedo da Mata et al. | Transgenic cotton | SNV, 1st derivative | PLS-DA | NIR and Raman prediction sets had classification errors of 2.23% and 0.0%, respectively | [27][29] |
| Jin Hwan Lee et al. | Transgenic soybean | 1st, 2nd derivatives | PLS-DA | 2nd derivatives and PLSDA had results with 97% accuracy | [28][30] |
| Jiang Wu et al. | Transgenic soybean | SNV | BPNN | BPNN had 100% identification rate | [31][33] |
| Xuping Feng et al. | Transgenic maize | SG smoothing | KNN, SIMCA, NBC, ELM, RBFNN | The classification rates of full-spectrum and the feature wavelength were 100% and 90.83% in ELM model. | [25][27] |
| Cheng Peng et al. | Transgenic maize | SG smoothing | PLS, SVM | The accuracy of the SVM model based on full-band spectra of transgenic maize powder was 90.625%. | [10][12] |
| Haosong Guo et al. | Transgenic sugarcane | SG, MW | LDA | The corresponding validation recognition rates of transgenic and non-transgenic samples achieved 99.1% and 98.0%, respectively. | [59][61] |
| Guisong Liu et al. | Transgenic sugarcane | SG | PCA, LDA, HCA | The optimal SG-PCA-LDA model for positive and negative samples were 94.3% and 96.0%, respectively, and that of the optimal SG-PCA-HCA model for positive and negative samples were 92.5% and 98.0%, respectively. | [60][62] |
| Yafeng Zhai et al. | Transgenic wheat | Normalization | BPR | A model for identification of wheat varieties was developed using PCA combined with biomimetic pattern recognition method. | [61][63] |
| Aderval S. Lunaet al. | Transgenic soybean oils | MC, MSC, OSC, SG 1st, 2nd derivatives | SVM-DA, PLS-DA | The classification rate of SVM-DA was 100% in the training group and 100% and 90% in the validation group for non-GMO and GMO soybean oil samples. In PLS-DA model, the classification rates were 95% and 100% for the training group and 100% and 80% for the validation group of non-GMO and GM soybean oil samples, respectively. | [62][64] |
| Jianguo Zhu et al. | Transgenic oils | MSC, first derivative (FD), MWS, SG1 preprocessing | SVM | MSC had the best prediction performance with the accuracy rate of 91.6%. The prediction accuracy of SVM was improved to 98.3% by using the SPA algorithm. | [29][31] |