1. Operating Principle
The laser ultrasonic method is based on the contactless introduction and detection of ultrasonic signals in the material. The core of the system is an excitation laser and a detection laser—most commonly Nd:YAG lasers are used for both—and integrated interferometry, such as a Fabry-Perot or a two-wave mixing interferometer. The pulsed excitation laser transmits up to several mJ of energy to the material surface, where either thermoelastic excitation or ablative excitation occurs. Both variants generate a more or less intense stress field, resulting in a broadband ultrasonic signal (usually in the range of 500–50 MHz). In the case of thermoelastic excitation, mainly surface and plane waves are generated, while ablative excitation tends to produce more pronounced longitudinal waves. These waves pass through the material and are reflected at the back side, creating an echo. The detection laser can be mounted either in transmission or reflection mode, where the smallest deflections of the surface, due to reflection lead to a frequency shift, which is processed by an interferometer into signals that can be evaluated
[1][107].
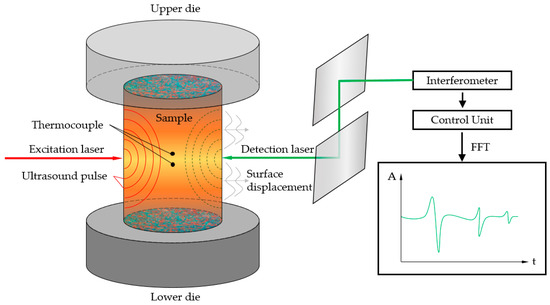
Figure 1 shows a schematic visualization of a
laser ultrasonic (LUS
) system.
Figure 1.
Schematic representation of the operating principle of a LUS System.
Apart from other types of waves generated by the excitation laser, such as surface waves or Lamb waves—an interaction of bulk waves occurring to (a-) symmetric vibrations in thin samples -, the essential ones here are the bulk waves. The bulk waves in a solid body can be subdivided depending on the mode of propagation. If the displacement of the involved particles is in the direction of propagation and results in compression, these waves are called longitudinal or compression waves; if the atomic motion is perpendicular to the direction of propagation, these waves are called transverse or shear waves. Bulk waves have the same frequency propagation, which means that they travel at the same speed, or in other words are non-dispersive. Since the compression waves propagate about twice as fast as the shear waves, these two types of waves can be clearly distinguished
[1][107]. By analyzing the different types of waves in terms of propagation mode, direction and velocity, frequency and/or temperature dependence, or penetration depth into the material, different properties of the material can be determined.
The most important analysis parameters of the detected signals are the Time of Flight (ToF), i.e., the propagation velocity, and the amplitude or its decrease after passing through the material, i.e., the attenuation. These two parameters can be used to generate a wide range of information about the microstructural or geometric configuration of the component, by conducting suitable evaluation operations. The evaluation of the velocity of sound provides specific information about
-
Geometry
-
Phase transformation
-
Phase composition
-
Recrystallization
-
Texture
while the evaluation of the attenuation covers the aspects of
In the following subsections the underlying principles of gaining insight into microstructural changes are briefly described.
1.1. Ultrasonic Velocity
The propagation speed of ultrasonic waves (especially longitudinal
cL and shear waves
cT) depends on the density and the stiffness tensor
[2][108]. Assuming a polycrystalline, isotropic material, with a small grain size in relation to the sample size, the following relationships between the speed of sound, density and elastic constants (
K,
S,
ν) for longitudinal and transverse waves can be assumed:
for the sound velocity of longitudinal waves and
for that of transverse waves.
K is referred to as the Compression Module,
S is the Shear Module, and
ν is the Poisson ratio. In the simplest case, the propagation speed can be determined by ToF measurements. For a sample of thickness
h, the propagation velocity can be derived from the time required for the wave to be reflected at the back of the sample and to be returned:
If the density ρ of the inspected material is known, the Young’s modulus (via known relationships with the compressive and shear moduli) or Poisson’s ratio ν can be determined very accurately over temperature, by measuring the speed of sound.
Since polycrystalline metals generally exhibit preferential grain orientations as a result of the manufacturing process (solidification and preferential dendrite growth or forming processes), it is of particular importance to be able to determine the predominant orientation.
Due to the high sensitivity of laser ultrasonic measurements with respect to the velocity of sound, individual entries of the elastic stiffness tensor can further be determined. Since the propagation velocity differs depending on the direction of propagation, the preferred direction can be determined using reference crystals. Conversely, orientation distribution coefficients (ODC) can also be calculated from ultrasonic signals.
Recrystallization phenomena, respectively the recrystallized fraction, can similarly be measured by measuring the changes in texture, and in turn the change in ultrasonic velocity. Since recrystallization is preceded by a certain strain and thermal activation, the changes in the measured sound velocity can be assigned to the recrystallized fraction via the Johnson-Mehl-Avrami (JMAK) function.
Especially for phase transformation or allotropic transformations of metals, a very precise prediction can be obtained with this measuring system. Since the acoustic velocity differs strongly depending on the crystal structure, the phase composition rule (lever rule) can provide an exact determination of the predominant fractions
[3][109]. The speed of sound is also changed considerably during a transition from ferromagnetic to paramagnetic material (Curie temperature).
1.2. Attenuation
The second important aspect, which can be analyzed from the ultrasonic signals and related to microstructural properties of the material, is attenuation. This manifests itself in the reduction of the amplitudes of subsequent echoes. The total attenuation can be attributed to three significant phenomena and added as:
The three contributions are made by diffraction α
D, internal friction
αIF, and the contribution of grain scattering
αsc. The contribution of diffraction can be estimated qualitatively by the Fresnel parameter, while the contribution of internal friction (caused for example by magneto-mechanical damping, interstitial atoms, or dislocation motion) can be minimized by suitable algorithms, since this contribution is frequency independent to a large extent
[4][110]. In turn, conclusions about recovery processes can be derived from the dislocation motion
[5][111]. The contribution to be extracted is that of the grain boundary scattering, which provides information about the predominant grain size in the material. The contribution of grain scattering is primarily noticeable in metals with high elastic anisotropy and is the dominant contributor to the total damping, especially in metals of this type, such as steel, nickel, or cobalt. The grain size
D is a temperature-dependent factor and damping increases as grain size increases. The contribution of the grain size to the total damping can be calculated via the power-law function
where
C corresponds to a temperature dependent material constant. The value of the exponent
n depends on the ratio of the wavelength to the grain size. Below are the following three regimes:
-
Rayleigh regime (λ≫D):αSc=CrD3f4(�≫�):���=���3�4
-
Stochastic regime (λ≈D):αSc=CSDf2�≈�:���=����2
-
Diffusion regime (λ≪D):αSc=CDD−1�≪�:���=���-1
It is usually assumed that this ratio lies between the Rayleigh and the Stochasitic regime, which is why the value of 3 is usually chosen for n. However, this value can also be fitted specifically for a material, as described in
[6][112].
To estimate the grain size, the power-law Formula (6) can be fitted into the measured attenuation curves:
Here,
a represents a frequency-independent contribution that includes, for example, internal friction or external factors such as variations in laser intensity. The expression
b represents the frequency dependent grain size contribution and can be assigned to the actual grain size via
with Γ(
T) =
1C(T)−−−−√1�(�), which contains the material and temperature dependent Information.
Appropriate model calibration with ex-situ tests can be used to draw in-situ conclusions about grain size evolution in thermal and thermomechanical tests, based on the reference echo model or the single echo technique.
The correlations of damping as well as velocity with microstructure have been tested and published based on numerous investigations on a variety of materials. For example, grain size or grain growth investigations are discussed in
[7][8][9][10][11][12][13][14][113,114,115,116,117,118,119,120]. Recrystallization effects can be found in
[15][16][17][18][19][20][21][22][23][121,122,123,124,125,126,127,128,129], whereas texture measurements where conducted for instance in
[24][25][26][130,131,132]. Further information of phase transformation and composition can be found in
[27][28][29][30][31][133,134,135,136,137].
2. Laser Ultrasonic in a Smart Production Lab
2. LUS in a Smart Production Lab
As already indicated, the LUS method is implemented to support the holistic construction of a SPL with regard to the creation of a DM/DS/DT, and to support it along the depicted value chain as a holistic auxiliary and quality inspection tool.
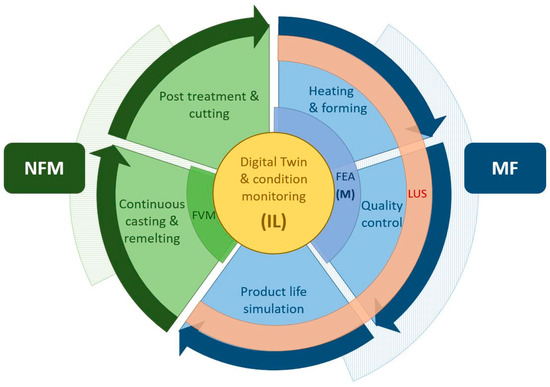
The MUL 4.0 project progressing at the Montanuniversität Leoben, in the form of a comprehensive SPL, encompasses parts of the holistic value chain. This value chain covers multiple technically different and geographically separated production sites, which are connected via a production network in order to transparently gather, store, and share data for analysis purposes. The starting point of the value chain, as depicted in
Figure 2, is the Chair of Nonferrous Metallury (NFM), which specifically deals with aluminum alloys and has a miniature continuous casting facility. It enables the casting of a wide variety of common and newly developed alloys, as well as recycled material. This provides the feedstock for the Chair of Metal Forming (MF), where it is delivered. From here it can be further processed in a variety of methods both cold, or annealed to a specific temperature in a digitized industrial furnace. One possibility would be rolling in a miniature rolling mill that has been transformed into a CPPS. A black box machine learning approach allows rolling from a certain thickness to the desired final thickness in multiple passes, specifying the optimal pass schedule
[32]. Another option would be forging in a hydraulic press capable of forces up to 1 MN. This press is being transformed into a fully integrated CPPS and is capable of recording data such as forces and temperature during upsetting, and automatically transferring them to a Supervisory Control and Data Acquisition (SCADA) system. The data is pre-processed and transmitted to a higher-level tracking system. Based on the raw material, this system can assign the process data to the respective product and provide information about the respective location. This data is additionally used throughout the value chain for input parameters for the FEA, in order to virtually represent the effects of the process conditions on the final product, and thus serve as a QC tool. Finally, the generated product can be heat treated to adjust the optimal material properties and then be machined to the final product. The value chain introduced here is illustrated in
Figure 2.
Figure 2. Visualization of the value chain covered in the Smart Production Lab (SPL) with the area covered by the LUS shown in orange.
Visualization of the value chain covered in the SPL with the area covered by the LUS shown in orange.
The application of the LUS in the SPL is intended to provide a fundamental contribution to the creation of a DT. This consists of a FEA for the respectively considered heating or forming process of the specimen with microstructural information prevailing in the material. As already mentioned, the description of the microstructural behavior requires a large number of material parameters in order to be able to calculate various material responses as a function of strain, strain rate, and temperature, by means of a microstructure model. Therefore, the coupling of a LUS system with a
thermomechanical treatment simulator (TMTS
), which records these characteristic values of the deformation as well as the corresponding time, is inevitable. This coupling enables the acquisition of data of the forming process via the TMTS Gleeble 3800, as well as in-situ data of the microstructural processes by a trigger signal from the same time and its correlation. Although the LUS system only provides information on the velocity and attenuation of the ultrasonic waves, these can be automatically transferred to various microstructural changes using programmed evaluation routines
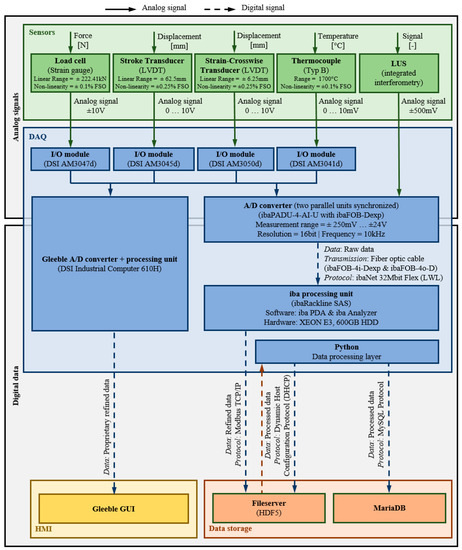
, as exemplified in Section 4. This makes it possible to obtain information about grain size, recrystallization behavior, or phase transformations during the experiment. Based on the corresponding recording of the flow curve and the flow behavior, a microstructural change from the LUS data can be assigned to the corresponding flow curve parameters. For data acquisition from the LUS, a high-frequency Data Aqusition System (DAQ) will be implemented and integrated into the IIoT network, which can record the analog signals from the LUS, at a sufficiently high frequency to ensure high-resolution signal mapping. For this purpose, the fiber optic based ibaPADU-4-AI-I with ibaFOB-Dexp, in combination with the ibaRackline SAS was chosen, which has measurement frequencies of up to 10 kHz with a resolution of 16bit, and thus fulfills the minimum sampling rate of 400 Hz set by the LUS. Since this DAQ has only four analog inputs, which are already occupied by Gleeble sensors, an identical ibaPADU-4-AI-I is implemented in a parallel synchronous operation, which is combined on the iba processing unit ibaRackline SAS and the software iba PDA & iba Analyzer. For improved traceability of the data recording, the Hierarchical Data Format (HDF) HDF5 is implemented here to record the metadata of each data set, and thus to get a more holistic insight into each measurement. These datasets are automatically synchronized by an open-source approach using Python, on a file server shared with the production network at the MF, in its Data processing layer and consequently stored in the production network’s relational open-source MySQL MariaDB database. This approach is visualized in
Figure 3.
Figure 3.
Visualization of the DAQ and data storage method.
Consequently, the data stored in the database is used for further post processing. The quintessence of the LUS data is the derivation of the material parameters essential for semi-empirical microstructure modeling. In addition to material-specific activation energies, etc., the associated forming conditions are necessary for the derivation of these. A typical set of formulas for the description of the material behavior in terms of static, dynamic, and metadynamic recrystallization, as well as grain growth and phase transformation, as a function of the temperature, as well as the corresponding flow curve, contains about 40 material constants
[33][34][17,23] for the complete description of the microstructural processes. These are derived in a deposited evaluation script and are stored in a database. The subroutine required for FEA of the forming process, with corresponding microstructure simulation, can then extract these determined assigned material parameters from this database, and thus perform an accurate simulation of the process for the specific material under investigation. Since the computation time of a forming process with integrated microstructure simulation is too high for simultaneous computation, this results in a DM that is not applicable for the in-situ implementation. Nevertheless, to create a DS or DT that can intervene in-situ in the process, several simulations with varying process parameters can be calculated, and the respective results in turn stored in a database for a number of process variations. These simulations can be performed locally or on a processing unit in the production network, in the form of CC, depending on the availability of computing resources required, and the results are always ultimately included in the superordinate database. For the implementation of a DS or DT, which is to intervene in-situ in a process, it is possible to fall back iteratively on the simulation results with the best-fitting process parameters, and to implement only individual data in the DS/DT. This saves an enormous amount of computational effort and still ensures an intervention in the process due to deviating microstructure conditions.
Furthermore, the LUS can be applied to characterize the raw material provided by NFM and the consequent material changes of the respective forming processes. Therefore, it can be used to rapidly identify significant deviations of a recycled material to a referenced primary material. In this way, it can be assured that the requirements for the use of a secondary metal meet specified tolerances, thereby contributing considerably to the avoidance of material waste. Thus, the LUS acts as an independent CPPS, capable of either using CC or local computing resources. As a result of the holistic data gathering, root causes of deviations in quality can be researched and evaluated, and thus be linked to the causing processes and parameters. In addition, ML can be applied in order to detect possible product quality deviations, due to unsuitable process parameters. Consequently, situationally appropriate decision-making is enhanced, and active measures can be taken, either adjusting the respective process or removing the affected specimen or product.


