Your browser does not fully support modern features. Please upgrade for a smoother experience.
Please note this is a comparison between Version 2 by Rita Xu and Version 1 by Kylie Legg.
The Thoroughbred racing industry faces new and competing pressures to operate within a modern, changing society. Three major moderators drive the focus and productivity of the industry worldwide: economic sustainability, horse biology and social licence to operate.
- horse
- racing
- racehorse welfare
- Thoroughbred industry
1. Introduction
The horse occupies a unique place in modern society. The traditional or historical role of the horse was as a utility or production animal. During the latter half of the 20th century, the predominant use of the horse transitioned from a working animal to one solely for sport and recreation. With this change in role came a shift in the perception of acceptable welfare standards for horses, with most of society now identifying the horse as a companion animal or pet [1,2][1][2]. This contemporary framework places the racing industry in a unique position whereby they utilise the horse in a sport in which horses compete in races for the enjoyment and entertainment of a public audience and economic gain for industry participants.
Betting turnover, and thus the majority of industry revenue, is dependent on the number of races offered, the quality” of the race (the rating of the horses) and the number of participants within each race. These are constrained by the relative size of the racing population and the replacement rate of the racing population. In recent years, there has been increasing public scrutiny on the replacement rate and the issue of life after racing, i.e., what happens to horses once they leave the racing production system [7,8][3][4]. The replacement rate is influenced by the industry structure, which in turn is heavily constrained by the moderator “horse biology”. Like all athletes, horses require appropriate periods of training and recovery to optimise performance and minimise the risk of injury [9][5]. These periods of training (preparation) and recovery (spells) vary with the age of the horse and the racing focus [5][6]. The goal for racing administrators and participants is to balance the economic returns with the biological constraints, primarily through the frequency and intensity of racing.
In recent times, the popularity of horse racing has diminished, with 70% of adult Australians professing little or no interest in the sport [10,11][7][8]. As society becomes increasingly urbanised, fewer people have any familiarity with horses or horse racing. Lack of familiarity with horses has been associated with an increasingly anthropomorphic view of the horse rather than one based on the horse’s ecological niche [2,12][2][9]. These changing social values, combined with new technologies that enable widespread dissemination of information, including the occurrence of injuries and catastrophic events on the racecourse, have contributed to increasing media attention and debate about the acceptable use of animals in sport [13][10]. The continued use of the Thoroughbred in racing requires critical social engagement to continue their social licence to operate [8][4]. These pressures for change from society, external to the racing industry, in turn, impact the structure, pattern and economics of racing. The magnitude and direction of change are dependent on the critical mass of each racing jurisdiction and its capability to respond.
A Bioeconomic Model of Racing and the Sustainability of Each Racing Jurisdiction
The racing industry cannot be defined as a simple biological process. There is a need to balance the economics of the industry with society’s expectations of the acceptable or ideal use of animals in both sport and production. These bioeconomic approaches are common within other animal industries, such as the dairy industry. Within the New Zealand dairy industry, the production system can be modelled to maximise output (milk yield) based on the relevant (and differing levels of) constraints peculiar to each region, using a framework of production economics. From these models, five farm system classifications have evolved, in simple terms, describing the relative contribution of grazed grass (low input) vs. imported feed types (high input) in relation to milk yield [14][11]. Though similar net returns are observed from each production system [15][12], the proportion of farms using each system depends on differing farmer goals, skills, knowledge, available resources and climate. In addition, the farm system used is heavily dependent on economic factors such as feed price and availability and milk pay-out as well as both financial and biological risk and animal welfare legislation [14,16,17][11][13][14]. These differing and competing pressures and constraints drive the choice of production system, to achieve the optimum level of least cost, optimum profit within the broader processes of socioeconomic change [17][14]. This modelling process can be translated to identify and quantify the economic, biological and social constraints and their interaction within the Thoroughbred racing industry. Population level research, both within and between racing jurisdictions, is vital to provide reliable independent data to inform discussion around the key community concerns that threaten the Thoroughbred industry’s social licence to operate. Improving welfare standards for horses as well as economic returns for industry participants is a key focus for the Thoroughbred industry, therefore, research to better understand both individual horse-level and industry-level determinants of a horse’s career duration and success is important. The key drivers of race programming, retirement, injury and economic returns for owners and trainers are important factors for investigation. A conceptual schema for the three major moderators within a racing jurisdiction is presented in Figure 1. In this conceptual model, much like the conceptual framework used to describe training volume in athletes (frequency, duration and intensity) [9][5], each jurisdiction has a unique bioeconomic constraint within which the three moderators interact agonistically against each other. Horse biology (and consideration of the racing environment) has the least opportunity to dramatically alter or influence the other two moderators. However, the differences in focus and social licence between racing jurisdictions create different pressures, weightings and interactions between each of the moderators, changing the optimum balance point for each jurisdiction to operate in equilibrium.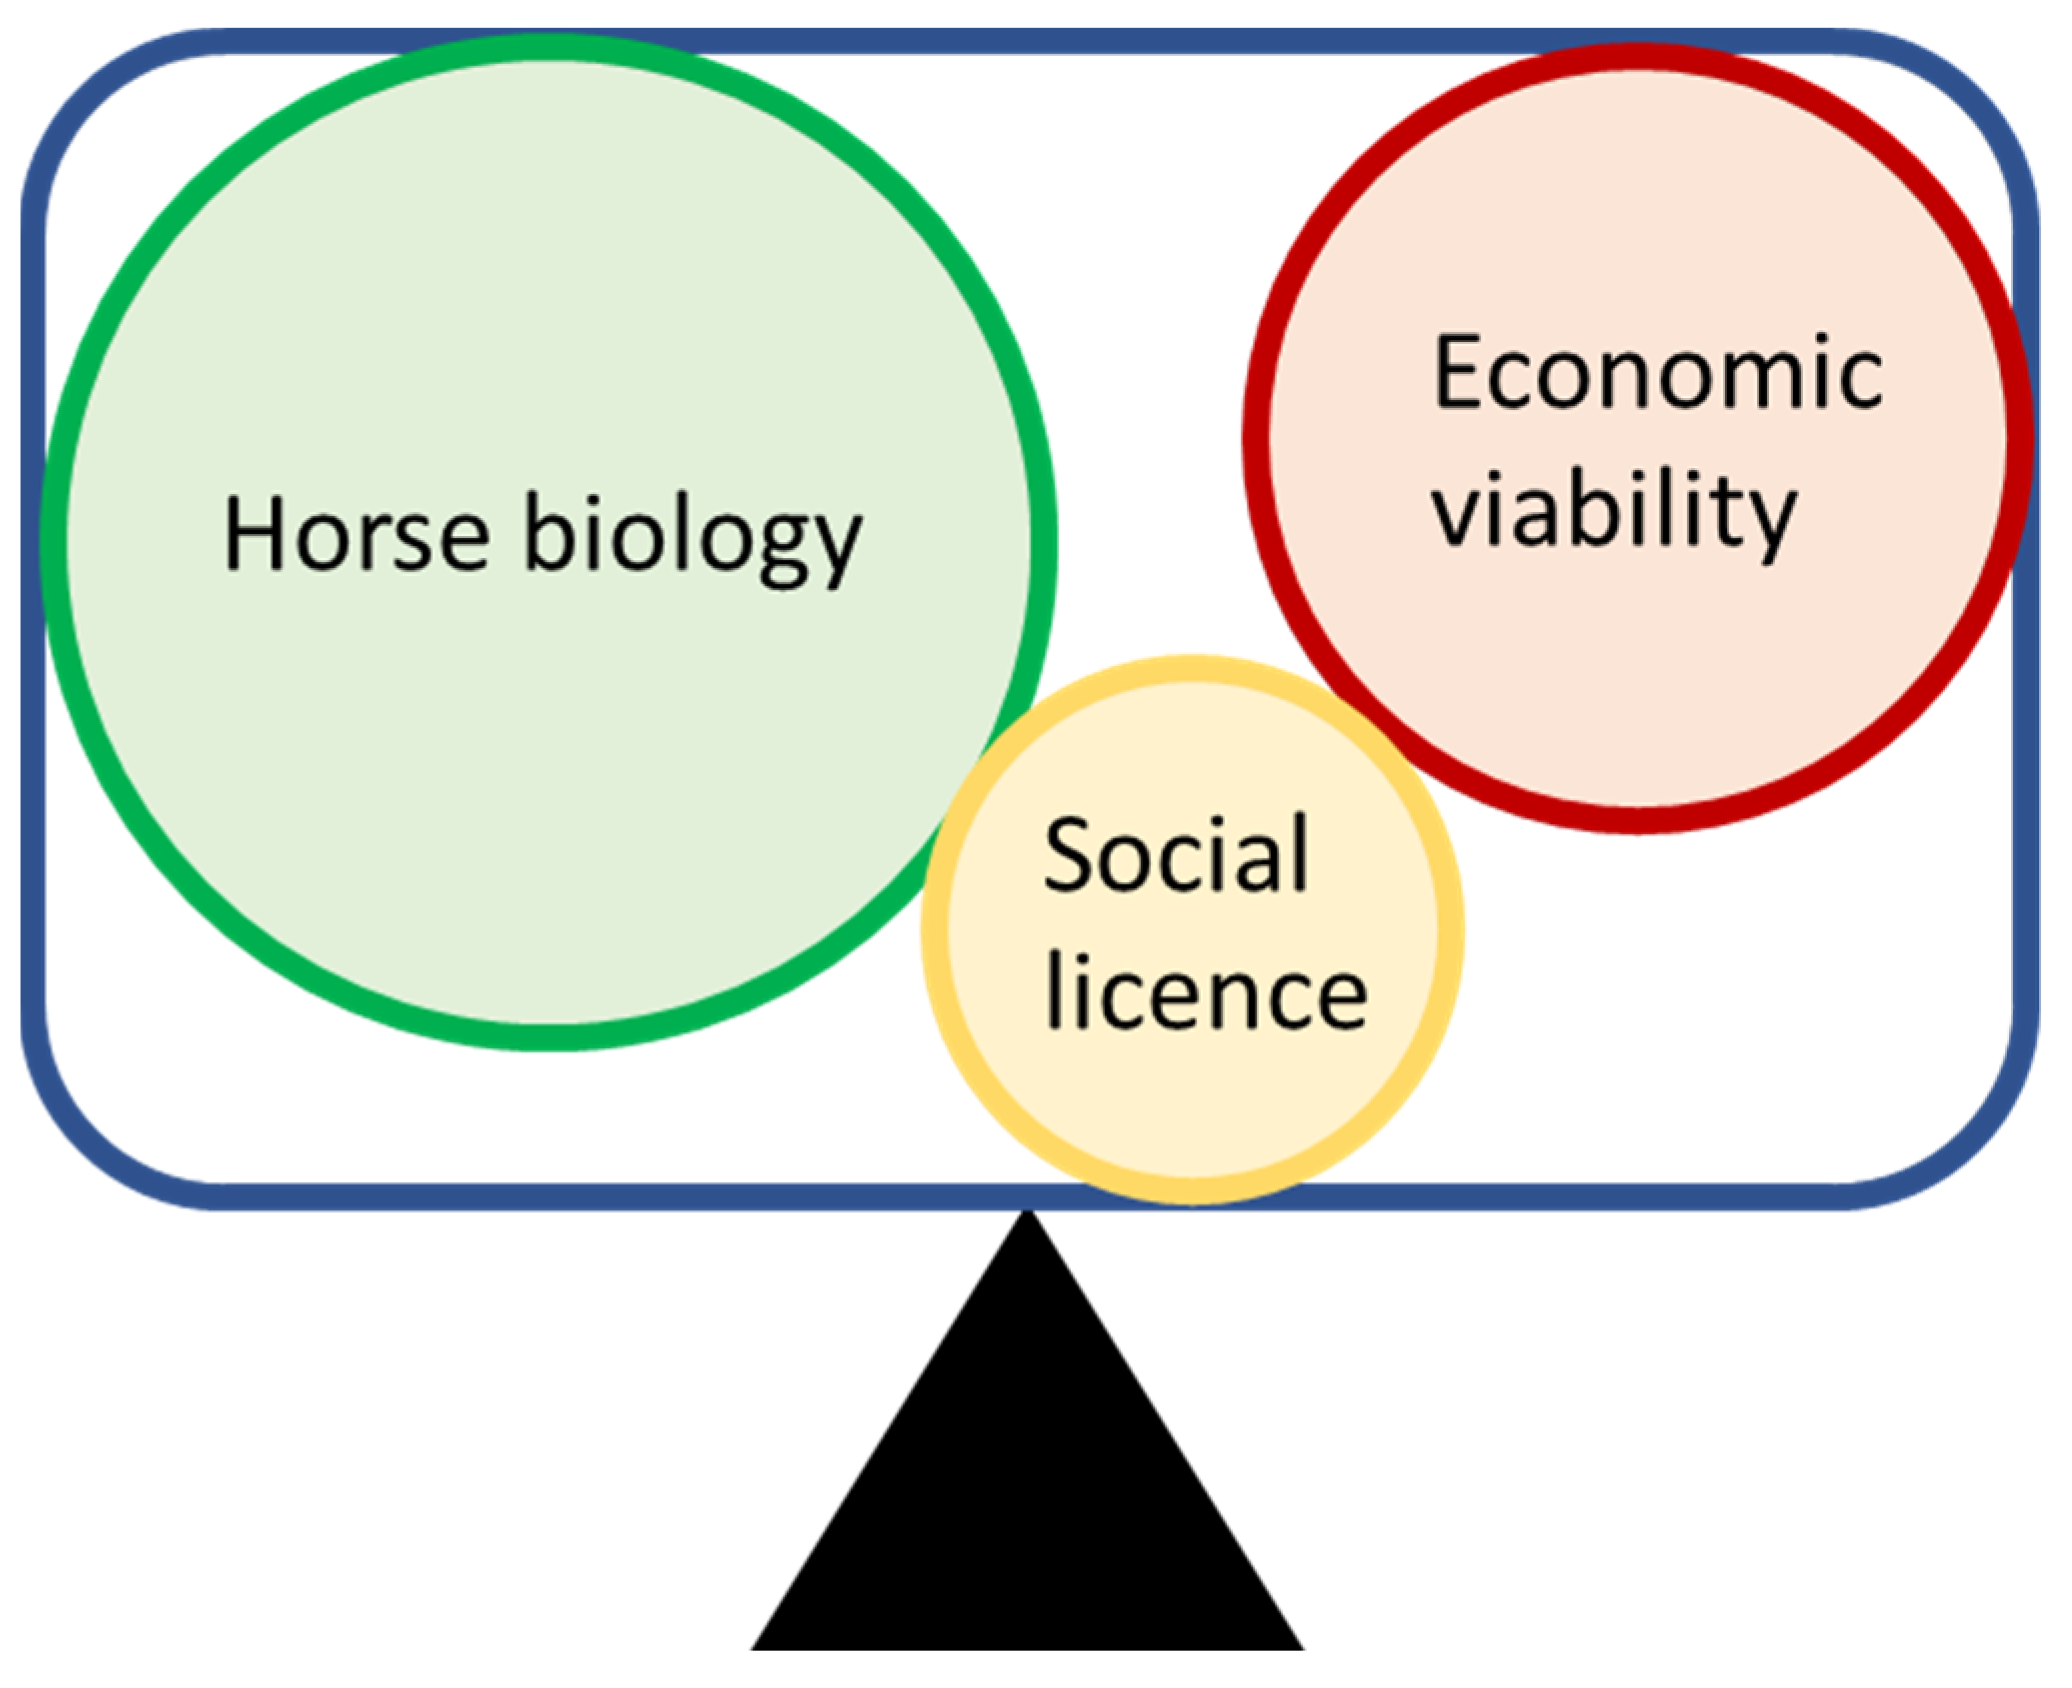
Figure 1. Conceptual schema of the bioeconomic constraints of a racing jurisdiction in equilibrium—alter one moderator and the whole system needs re-adjustment to establish equilibrium. Different jurisdictions would have different weightings for each of the three moderators.
2. Economic Sustainability
The economic impact of the racing industry includes employment, export income and gambling, and in the US is estimated to be 26.1 billion USD [18][15]. Racing is one of the largest industries in Australia, contributing 0.5% to gross domestic product (GDP) [19][16] and in New Zealand, the racing sector is estimated to generate over 1.4 billion NZD (approximately 1%) in GDP [20][17]. Much of the revenue associated with horse racing is derived directly or indirectly via gambling. The strong co-existence of horse racing, gambling and economic viability has resulted in strong external (national or federal government) control and robust internal industry control of racing and processes. Externally, the international racing industry appears relatively homogeneous with the structure and regulation of racing for the major racing jurisdictions coordinated via the International Federation of Horse Racing Authorities (IFHRA) [3][18]. However, summary data on the number of races, prize money offered and the level of wagering on races across the three major racing regions of Asia, Europe and the Americas reflect significant differences in the level of racing and the economic pressures within even these broad regions. As an example, the Asian region holds 40% of all flat races, accounting for 56% of the total stakes money on offer, and is responsible for over 60% of all money gambled on horse racing worldwide. In contrast, the Americas hold almost the same number of races (39% of all flat races) but offer only 29% of total stakes money and are responsible for only 10% of the total international wagering [3][18]. The relatively lower stake money percentage on offer in the USA reflects the large number of races that are claiming races (reported in some states to represent up to 54% of races) [21][19]. A claiming race is a type of horse race in which the horses are all for sale at a specified “claiming” price until shortly before the race and generally includes the lowest quality of horse, with the lowest stakes money of all race types [21][19]. This type of race alters the dynamics of horse ownership and reduces the time frame of interest for the horse owner from a long-term commitment with a focus on individual owner-trainer relationships, to a short-term, transitional perspective of horse ownership. Claiming races are additionally associated with a higher risk profile for catastrophic musculoskeletal injury [22][20], indicating that economics may be given a larger weighting than “horse biology” within the Americas. There are large differences between both broad racing regions and individual jurisdictions in racing population size and the number of horses competing in a race. As field size increases, there are more betting opportunities and funds gambled on the race, with ≥12 horses per race needed to optimise the betting pool (total money gambled) in any given race. Optimisation of the betting pool is important, as a percentage of all money gambled is returned to the industry in the form of race stakes, providing the revenue stream for owners, trainers and jockeys [6,23][21][22]. The Australasian region has a similar sized racing population to the Americas (39% of the worlds racing population of horses), but the average number of starters per race is higher in Australasia, with 10.2 horses per race, compared to a mean of 7.4 horses per race in the Americas. Asia and Europe have a lower total number of horses (18% and 14%, respectively) but maximise betting opportunities with a mean of 11.1 and 10.7 horses per race, respectively. These metrics demonstrate the dependence of most jurisdictions on optimising gambling opportunities, whereas the Americas are unique with their focus on immediate returns from horse ownership. The categories of betting turnover per race start and per horse in the industry provide some comparative metrics on the relative ability of the different industries to provide economic return on their respective horse and racing populations. The betting turnover relative to the number of starters, and perhaps more so with the betting turnover relative to the number of horses in the industry, clearly demonstrates that some jurisdictions such as Hong Kong, Great Britain and Korea are very effective at optimising gambling opportunities. Hong Kong and Singapore are unique populations with a high economic return of product, averaging 12 horses per race, with an average of 7.7 starts for a horse each year. Europe has the lowest frequency of horses racing, with 4.9 starts per horse per year. However, the European flat racing season is mainly truncated to the summer months (approximately 8 months, April to November), whereas in Hong Kong, racing is conducted for 11 months of the year, with a compulsory 1 month break in racing during August. Therefore, the shortened season in Europe provides fewer opportunities for horses to race. In the USA and Australasia, racing is conducted year-round, with 5–6 starts per horse per year. This difference in race starts potentially reflects industry constraints from the environment (e.g., duration of the racing season) as well as cultural traditions or training practices. However, the “off-season” may have other industry benefits, such as providing a yearly “revitalisation” of the industry as fans, horses, and industry participants start each season after the rest period fresh and eager to succeed. These breaks may additionally help to increase and revitalise interest in gambling, and thus, maximise betting turnover, as evidenced by the high betting turnover relative to number of horses racing in both Asia and Great Britain.Breeding Sector
Most racing jurisdictions have some form of vertical integration where the domestic breeding sector generates enough horses to meet the replacement rate within the racing industry. Between jurisdictions, there is considerable variation in the number of foals produced per year relative to the domestic racing population, which reflects the differences in production focus. Some countries breed only for domestic supply, and others have a large export focus for the racing product. The jurisdictions that have a domestic breeding and racing focus have a foal production rate of approximately 30–40% of their current racing population per year. This value aligns with the annual turnover of horses within a racing population of between 20–40% [5,24][6][23]. There are also some unique racing jurisdictions, such as Hong Kong and Singapore, with no domestic breeding programme and are dependent on importing 100% of their Thoroughbreds from overseas nations (mainly Australasia). This contrasts with self-supporting nations such as the Americas and Japan that largely maintain their racing population through foals born domestically. Ireland is a highly export-focused nation, breeding more than twice the required replacement rate to sustain domestic racing [25][24]. New Zealand is essentially a hybrid system, with both a self-sustaining breeding sector and a large export-focused breeding sector [26][25]. These differences in production focus between jurisdictions may alter both the economic focus and the weighting of social concerns regarding wastage and overproduction of raw material (youngstock/foals).3. Horse Biology
The genotype and phenotype of the Thoroughbred racehorse is relatively homogeneous due to over 300 years of selection for racing ability from a relatively narrow genetic base [32][26]. There are some subtle differences between jurisdictions in the early foal-rearing environment. Intervention studies have identified that some of these differences in foal rearing may positively contribute to the growth and development of the musculoskeletal system and thus reduce the subsequent injury risk profile [33][27]. However, the difficulty in obtaining precise measures of early life exercise at a population level has precluded refinement of estimation of the effect size contributed by the early production environment. In 1982, Leo Jeffcott and colleagues published the first epidemiological study to examine wastage within the Thoroughbred racing industry [34][28]. Since this publication, there has been approximately 40 years of attention focused on quantifying different aspects of wastage; from examination of the whole supply chain [35][29] through to very specific race-level risk factors for injuries such as dorsal metacarpal disease in 2-year-old racehorses [36][30]. A number of authors have attempted to examine more holistic measures of race-day injury, including veterinary events, stipendiary stewards reports and failure to finish outcomes [37,38,39][31][32][33]. These metrics are useful for the quantification of negative events during or associated with racing within a jurisdiction. They provide, to a certain extent, an indication of the robustness of specific industry regulation and identification of incidents, but to date, these have rarely been used to provide comparative metrics across jurisdictions [22][20]. Welfare concerns for the Thoroughbred racing industry focus not only on the catastrophic injuries that may be reported within the media but also on the loss of horses from the industry [8,40][4][34]. When the industry is examined as a supply chain, horses that do not enter racing are often included in the group “wastage”. However, this can be a gross oversimplification of the opportunities for progression for a foal born and entry into racing. One proposal from groups antagonistic to racing is that the industry should breed only the number of foals equivalent to that required to replace the racing population. This proposal ignores that the horse is a biological organism, and thus subject to natural variation within the population. There is also the confounding factor that racing, as a sport, aims to identify the elite from within each cohort, so they may, in turn, contribute to the improvement of the next generation. When examined as a supply chain, there are similar rates of attrition in racing and other equestrian sports such as show jumping, dressage and eventing. Within any given year cohort, about one-third to one-half of horses born will not enter sport or racing [34,35][28][29]. Of the remaining two-thirds of the foal crop, one-third will retire or withdraw from training due to voluntary reasons (often lack of ability), one-third will withdraw due to involuntary reasons (predominantly musculoskeletal injury) and one-third will remain within the production system [34,35,41,42][28][29][35][36]. This uniformity of attrition between equestrian disciplines emphasises the consistent expectation of an inherent redundant component of the biological population (horse) to have the opportunity, the talent and the orthopaedic health to have a sporting career. Similar key (biological) limitations in the progression of athletes have been identified in human sport [43][37], reflecting the need to describe and document the underlying biological variation to be able to optimise flow of product (athlete or horse) through the system and target the individuals with the greatest opportunity for success.3.1. Voluntary Losses
Those horses which do not enter racing or are voluntarily retired are collectively labelled “voluntary losses”. Some of the loss of horses before entering training, and voluntary loss within training, can relate to industry structure and economics. The majority of flat racing is focused on horses aged 2 to 5-years old [5,7,44][3][6][38]. However, in Australia, 5% of the annual racing population of horses have only one race start [40][34]. This figure is higher in New Zealand, with a consistent 14% of horses annually having only one race start [5][6]. Due to the export focus of the New Zealand industry, many of these horses with one race start are believed to be exported at the beginning of their careers. These metrics imply that there is early identification within the industry of horses who lack ability or are unsuited to the sport. Voluntary retirement allows for the option of early repurposing in other disciplines [45][39], with voluntary rather than involuntary retirees having increased odds of repurposing as performance horses [46][40]. This may represent a self-supporting industry mechanism to improve horse welfare and economic benefit by not racing individuals that obviously, at initial screening, do not have the physical or mental characteristics to permit them to succeed within the racing or sport industry.3.2. Involuntary (MSI) Losses
For those horses that enter training, musculoskeletal injury (MSI—fracture and soft tissue injury) is the most common reason for involuntary loss from the horse racing industry, accounting for 80% of involuntary interruptions to training and 25% of horses exiting from the industry [47,48][41][42]. For many jurisdictions, there has been quantification of the prevalence and, in some cases, quantification of risk factors for a range of case definitions from condylar fracture of the metacarpal and metatarsal bones [49][43] to all MSI [50,51][44][45]. To date, over 300 different factors have been examined as risk factors for catastrophic musculoskeletal injury [22][20]. These incidents represent perhaps the most emotive and tragic incidents that occur in racing and could be considered the most industry-threatening incidents due to compromised social license [8][4]. The risk factors for MSI, and those for other injuries, and even the holistic measures of racing industry integrity (such as failure to finish a race) can be broadly grouped into horse-, race-, management- and environment-level factors. Despite the homogeneity of racehorse genotype and phenotype, there are subtle differences between jurisdictions in horse-level risk factors (such as age and sex). The interaction of the racing jurisdiction (in this case, country) on risk factors for catastrophic musculoskeletal injury was elegantly demonstrated within the meta-analysis conducted by Hitchens, Morrice-West, Stevenson and Whitton [22][20]. This restudyearch highlighted the confounding effect that the production system (jurisdiction) has on the identification and estimation of the level of risk of specific risk factors. These production interactions relate directly to how the horses are trained and raced, as well as environmental conditions such as racing track surface type and permitted medications.References
- DuBois, C.; Nakonechny, L.; Derisoud, E.; Merkies, K. Examining Canadian equine industry participants’ perceptions of horses and their welfare. Animals 2018, 8, 201.
- Legg, K.A.; Breheny, M.; Gee, E.K.; Rogers, C.W. Responding to risk: Regulation or prohibition? New Zealand media reporting of Thoroughbred jumps racing 2016–2018. Animals 2019, 9, 276.
- Shrestha, K.; Gilkerson, J.R.; Stevenson, M.A.; Flash, M.L. Drivers of exit and outcomes for Thoroughbred racehorses participating in the 2017–2018 Australian racing season. PLoS ONE 2021, 16, e0257581.
- Heleski, C.; Stowe, C.J.; Fiedler, J.; Peterson, M.L.; Brady, C.; Wickens, C.; MacLeod, J.N. Thoroughbred racehorse welfare through the lens of ‘social license to operate—With an emphasis on a U.S. perspective. Sustainability 2020, 12, 1706.
- Rogers, C.W.; Rivero, J.L.L.; van Breda, E.; Lindner, A.; van Oldruitenborgh-Oosterbaan, M.S. Describing workload and scientific information on conditioning horses. Equine Comp. Exerc. Physiol. 2007, 4, 1–6.
- Legg, K.A.; Gee, E.K.; Cochrane, D.J.; Rogers, C.W. Preliminary Examination of the Biological and Industry Constraints on the Structure and Pattern of Thoroughbred Racing in New Zealand over Thirteen Seasons: 2005/06–2017/18. Animals 2021, 11, 2807.
- Wilson, B.J.; Thompson, K.R.; McGreevy, P.D. The race that segments a nation: Findings from a convenience poll of attitudes toward the Melbourne Cup Thoroughbred horse race, gambling and animal cruelty. PLoS ONE 2021, 16, e0248945.
- Markwell, K.; Firth, T.; Hing, N. Blood on the race track: An analysis of ethical concerns regarding animal-based gambling. Ann. Leis. Res. 2016, 20, 594–609.
- Holmes, T.Q.; Brown, A.F. Champing at the Bit for Improvements: A Review of Equine Welfare in Equestrian Sports in the United Kingdom. Animals 2022, 12, 1186.
- Graham, R.; McManus, P. Changing Human-Animal Relationships in Sport: An Analysis of the UK and Australian Horse Racing Whips Debates. Animals 2016, 6, 32.
- Hedley, P.; Kolver, E.; Glassey, C.; Thorrold, B.; van Bysterveldt, A.; Roche, J.R.; MacDonald, K. Achieving high performance from a range of farm systems. In Proceedings of the Dairy3 Conference 4, Hamilton, New Zealand, 3–5 April 2006; pp. 147–166.
- Newman, M.; Savage, J. Benchmarking—Key drivers for successful dairy businesses. In Proceedings of the SIDE (South Island Dairy Event) Conference, Lincoln Universty, Canterbury, New Zealand, 22–24 June 2009.
- Greig, B.J. Changing New Zealand Dairy Farm Systems; In Proceedings of the SIDE (South Island Dairy Event) Conference, Dunedin, New Zealand, 25–27 June 2012.
- Clay, N.; Garnett, T.; Lorimer, J. Dairy intensification: Drivers, impacts and alternatives. Ambio 2020, 49, 35–48.
- Peterson, M.L.; McIlwraith, C.W.; Reiser, R.F. Development of a system for the in-situ characterisation of Thoroughbred horse racing track surfaces. Biosyst. Eng. 2008, 101, 260–269.
- Bailey, C.J.; Rose, R.J.; Reid, S.W.; Hodgson, D.R. Wastage in the Australian Thoroughbred racing industry: A survey of Sydney trainers. Austral. Vet. J. 1997, 75, 64–66.
- Bolwell, C.F.; Rogers, C.W.; Gee, E.K.; Rosanowski, S.M. Commercial equine production in New Zealand. 3. The racing and sport industries. Anim. Prod. Sci. 2017, 60, 2164–2174.
- International Federation of Horse Racing Authorities. IFHRA Annual Report 2019; IFHRA: Boulogne, France, 2019.
- Neibergs, J.S.; Vinzant, P.L. Maximum-likelihood estimates of racehorse earnings and profitability. J. Agribus. 1999, 17, 37–48.
- Hitchens, P.L.; Morrice-West, A.V.; Stevenson, M.A.; Whitton, R.C. Meta-analysis of risk factors for racehorse catastrophic musculoskeletal injury in flat racing. Vet. J. 2019, 245, 29–40.
- Carter, H.O.; Shepard, L.E.; Whitney, M. An Economic Analysis of the California Thoroughbred Racing Industry; Division of Agriculture and Natural Resources, University of California: Davis, CA, USA, 1991.
- Neibergs, J.S.; Thalheimer, R. Price expectations and supply response in the Thoroughbred yearling market. J. Agric. Appl. Econ. 1997, 29, 419–435.
- Thomson, P.C.; Hayek, A.R.; Jones, B.; Evans, D.L.; McGreevy, P.D. Number, causes and destinations of horses leaving the Australian Thoroughbred and Standardbred racing industries. Aust. Vet. J. 2014, 92, 303–311.
- Arango-Sabogal, J.C.; Mouncey, R.; de Mestre, A.M.; Verheyen, K. Retrospective analysis of the population dynamics and racing outcomes of the 2014 and 2015 UK and Ireland Thoroughbred foal crops. Vet. Rec. 2021, 189, e298.
- Chin, Y.Y.; Rogers, C.W.; Gee, E.K.; Stafford, K.J.; Cameron, E.Z. The Pattern of Breeding and Management within the New Zealand Thoroughbred Breeding Industry 2005–2015 (i) the Stallion Population. Anim. Prod. Sci. 2021; under review.
- Todd, E.T.; Ho, S.Y.W.; Thomson, P.C.; Ang, R.A.; Velie, B.D.; Hamilton, N.A. Founder-specific inbreeding depression affects racing performance in Thoroughbred horses. Sci. Rep. 2018, 8, 6167.
- Rogers, C.W.; Firth, E.C.; McIlwraith, C.W.; Barneveld, A.; Goodship, A.E.; Kawcak, C.E.; Smith, R.K.W.; van Weeren, P.R. Evaluation of a new strategy to modulate skeletal development in racehorses by imposing track-based exercise during growth: The effects on 2-and 3-year-old racing careers. Equine Vet. J. 2008, 40, 119–127.
- Jeffcott, L.B.; Rossdale, P.D.; Freestone, J.; Frank, C.J.; Towers-Clark, P.F. An assessment of wastage in Thoroughbred racing from conception to 4 years of age. Equine Vet. J. 1982, 14, 185–198.
- Tanner, J.C.; Rogers, C.W.; Firth, E.C. The association of 2-year-old training milestones with career length and racing success in a sample of Thoroughbred horses in New Zealand. Equine Vet. J. 2013, 45, 20–24.
- Verheyen, K.; Henley, W.; Price, J.; Wood, J. Training-related factors associated with dorsometacarpal disease in young Thoroughbred racehorses in the UK. Equine Vet. J. 2005, 37, 442–448.
- Tanner, J.; Rogers, C.; Bolwell, C.; Cogger, N.; Gee, E.; McLlwraith, W. Analysis of failure to finish a race in a cohort of Thoroughbred racehorses in New Zealand. Animals 2016, 6, 36.
- Gibson, M.J.; Bolwell, C.F.; Gee, E.K.; Legg, K.A.; Rogers, C.W. Race-Level Reporting of Incidents during Two Seasons (2015/16 to 2016/17) of Thoroughbred Flat Racing in New Zealand. Animals 2022, 12, 1033.
- Rosanowski, S.M.; Chang, Y.M.; Stirk, A.J.; Verheyen, K.L.P. Descriptive epidemiology of veterinary events in flat racing Thoroughbreds in Great Britain (2000 to 2013). Equine Vet. J. 2017, 49, 275–281.
- Flash, M.L.; Crabb, H.K.; Hitchens, P.L.; Firestone, S.M.; Stevenson, M.A.; Gilkerson, J.R. Participation of Victorian Thoroughbreds in the racing industry: A whole-of-population benchmark. Aust. Vet. J. 2021, 100, 40–47.
- Ricard, A.; Fournethanocq, F. Analysis of factors affecting length of competitive life of jumping horses. Genet. Sel. Evol. 1997, 29, 251–267.
- Wilsher, S.; Allen, W.R.; Wood, J.L.N. Factors associated with failure of Thoroughbred horses to train and race. Equine Vet. J. 2006, 38, 113–118.
- Green, B.C. Building sport programs to optimize athlete recruitment, retention, and transition: Toward a normative theory of sport development. J. Sport Manag. 2005, 19, 233–253.
- Bolwell, C.F.; Rogers, C.W.; Gee, E.K.; Rosanowski, S.M. Descriptive statistics and the pattern of horse racing in New Zealand. 1. Thoroughbred racing. Anim. Prod. Sci. 2016, 56, 77–81.
- Flash, M.L.; Renwick, M.; Gilkerson, J.R.; Stevenson, M.A. Descriptive analysis of Thoroughbred horses born in Victoria, Australia, in 2010; barriers to entering training and outcomes on exiting training and racing. PLoS ONE 2020, 15, e0241273.
- Crawford, K.L.; Finnane, A.; Greer, R.M.; Phillips, C.J.C.; Woldeyohannes, S.M.; Perkins, N.R.; Ahern, B.J. Appraising the Welfare of Thoroughbred Racehorses in Training in Queensland, Australia: The Incidence, Risk Factors and Outcomes for Horses after Retirement from Racing. Animals 2021, 11, 142.
- Clegg, P.D. Musculoskeletal disease and injury, now and in the future. Part 2: Tendon and ligament injuries. Equine Vet. J. 2012, 44, 371–375.
- Perkins, N.R.; Reid, S.W.J.; Morris, R.S. Profiling the New Zealand Thoroughbred racing industry. 2. Conditions interfering with training and racing. N. Z. Vet. J. 2005, 53, 69–76.
- Parkin, T.D.H.; Clegg, P.D.; French, N.P.; Proudman, C.J.; Riggs, C.M.; Singer, E.R.; Webbon, P.M.; Morgan, K.L. Risk factors for fatal lateral condylar fracture of the third metacarpus/metatarsus in UK racing. Equine Vet. J. 2005, 37, 192–199.
- Ely, E.R.; Avella, C.S.; Price, J.S.; Smith, R.K.W.; Wood, J.L.N.; Verheyen, K.L.P. Descriptive epidemiology of fracture, tendon and suspensory ligament injuries in National Hunt racehorses in training. Equine Vet. J. 2009, 41, 372–378.
- Reardon, R.J.M.; Boden, L.A.; Mellor, D.J.; Love, S.; Newton, J.R.; Stirk, A.J.; Parkin, T.D.H. Risk factors for superficial digital flexor tendinopathy in Thoroughbred racehorses in steeplechase starts in the United Kingdom (2001–2009). Vet. J. 2013, 195, 325–330.
More