Your browser does not fully support modern features. Please upgrade for a smoother experience.
Please note this is a comparison between Version 3 by Jessie Wu and Version 4 by Hang Ta.
Recent progress in microfluidic technology has made it possible to mimic characteristics and responses of the human gut as seen in vivo. In the past decade, researchers have enhanced organ-on-a-chip technology (GOC) models by incorporating sensors and biometers to control parameters that mimic the human gut. Most in vitro GOC models depend upon 2D cell culture models, whereby the intestinal epithelial cell lines (i.e., human colon adenocarcinoma (Caco-2) or human colorectal adenocarcinoma cell line with epithelial morphology (HT-29 cells)) are grown on extracellular matrix (ECM)-coated porous membranes inside Transwell systems or 2D monoculture plates. These models are often used to study the barrier functions and drug absorption; hence they are primarily applied in the pharmaceutical industry. 2D Transwell culture systems are simple and can be used for short-term observations; however, they fail to recapitulate the 3D structures and interactions of the native tissue such as microstructures (i.e., microvilli), mucus production, peristaltic motion, drug metabolism, etc. Another challenge with conventional models is due to the static nature the integration of commensal microbiomes, such as bacteria (i.e., E. coli) due to overgrowth and contamination of the system. To appropriately study the human gut’s physiology, pharmacology or pathology, the system used must recreate the 3D structures and microenvironment of the human gut. This can be achieved by using microfluidic platforms and incorporating live cells, thereby creating a 3D model with dynamic cell culture, and overcoming challenges such as microbial overgrowth. The most common GOC model structure has two channels (upper and lower layer), separated by a porous semipermeable membrane, which depicts the separation between the intestinal lumen and the vasculature. Furthermore, one of the two microchannels represents the lumen of the human gut. This channel aligns with the gut epithelial cells (i.e., IECs). The other channel represents the blood vessels and therefore aligns with vascular endothelial cells. The role of the semipermeable membrane is to facilitate the transport of soluble molecules and nutrients between the gut and the blood vessels.
- gut-on-a-chip
- gut
- cell
1. Materials and Fabrication
The most common material used for microfluidic device fabrication is polydimethylsiloxane (PDMS). PDMS has unique characteristics such as low elasticity, chemical inertness, high electrical resistance, porosity, and non-toxicity [1][2]. PDMS has been widely used because of its low costs and accessibility, optical transparency and gas permeability. PDMS has a refraction index of 1.4, allowing it to be compatible with various optical imaging and analysis methods. One can make pores with sizes ranging from 2 to 10 µm in PDMS. However, one of the major disadvantages of using PDMS for organ-on-a-chip technology (GOC) models is the hydrophobicity, consequently leading to the absorption of lipophilic compounds [3]. Inkjet printing and soft lithography have been used to make PDMS microfluidics devices. Soft lithography is the most used method having two essential steps, photolithography and replica moulding. Briefly, the fabrication process of PDMS-based GOC models is as follows (Figure 1). Liquid PDMS prepolymer is mixed with a curing agent, in a standard weight ratio of 10:1 (base: curing agent). The combined PDMS is poured over a master mould and then placed in a desiccator. The PDMS is then cured for one hour at 75 °C. After curing, PDMS can be carefully peeled from the master mould, and the inlet and outlet holes are punched [4]. The PDMS chip is then washed and dried, ready for plasma treatment. After plasma binding, the PDMS chips are bound to the glass slide/coverslip and incubated for ~2–5 min at 75 °C. The semipermeable membrane, which separates the microchannels, is usually composed of PDMS, polycarbonate (PC), polyester (PE), polyethylene terephthalate (PET) and polytetrafluoroethylene (PTFE). Moreover, biological materials, such as collagen can also be used. To increase the biocompatibility of some materials, membranes and microchannels are coated with natural polymers such as extracellular matrix (ECM) proteins such as collagen, fibronectin and gelatin, as they provide natural moiety for cell adhesion and survival [4][5][6][7]. Although PDMS is the commonly used material, it is unfavourable to cell adhesion, and to address this issue, channels are coated with hydrogel.
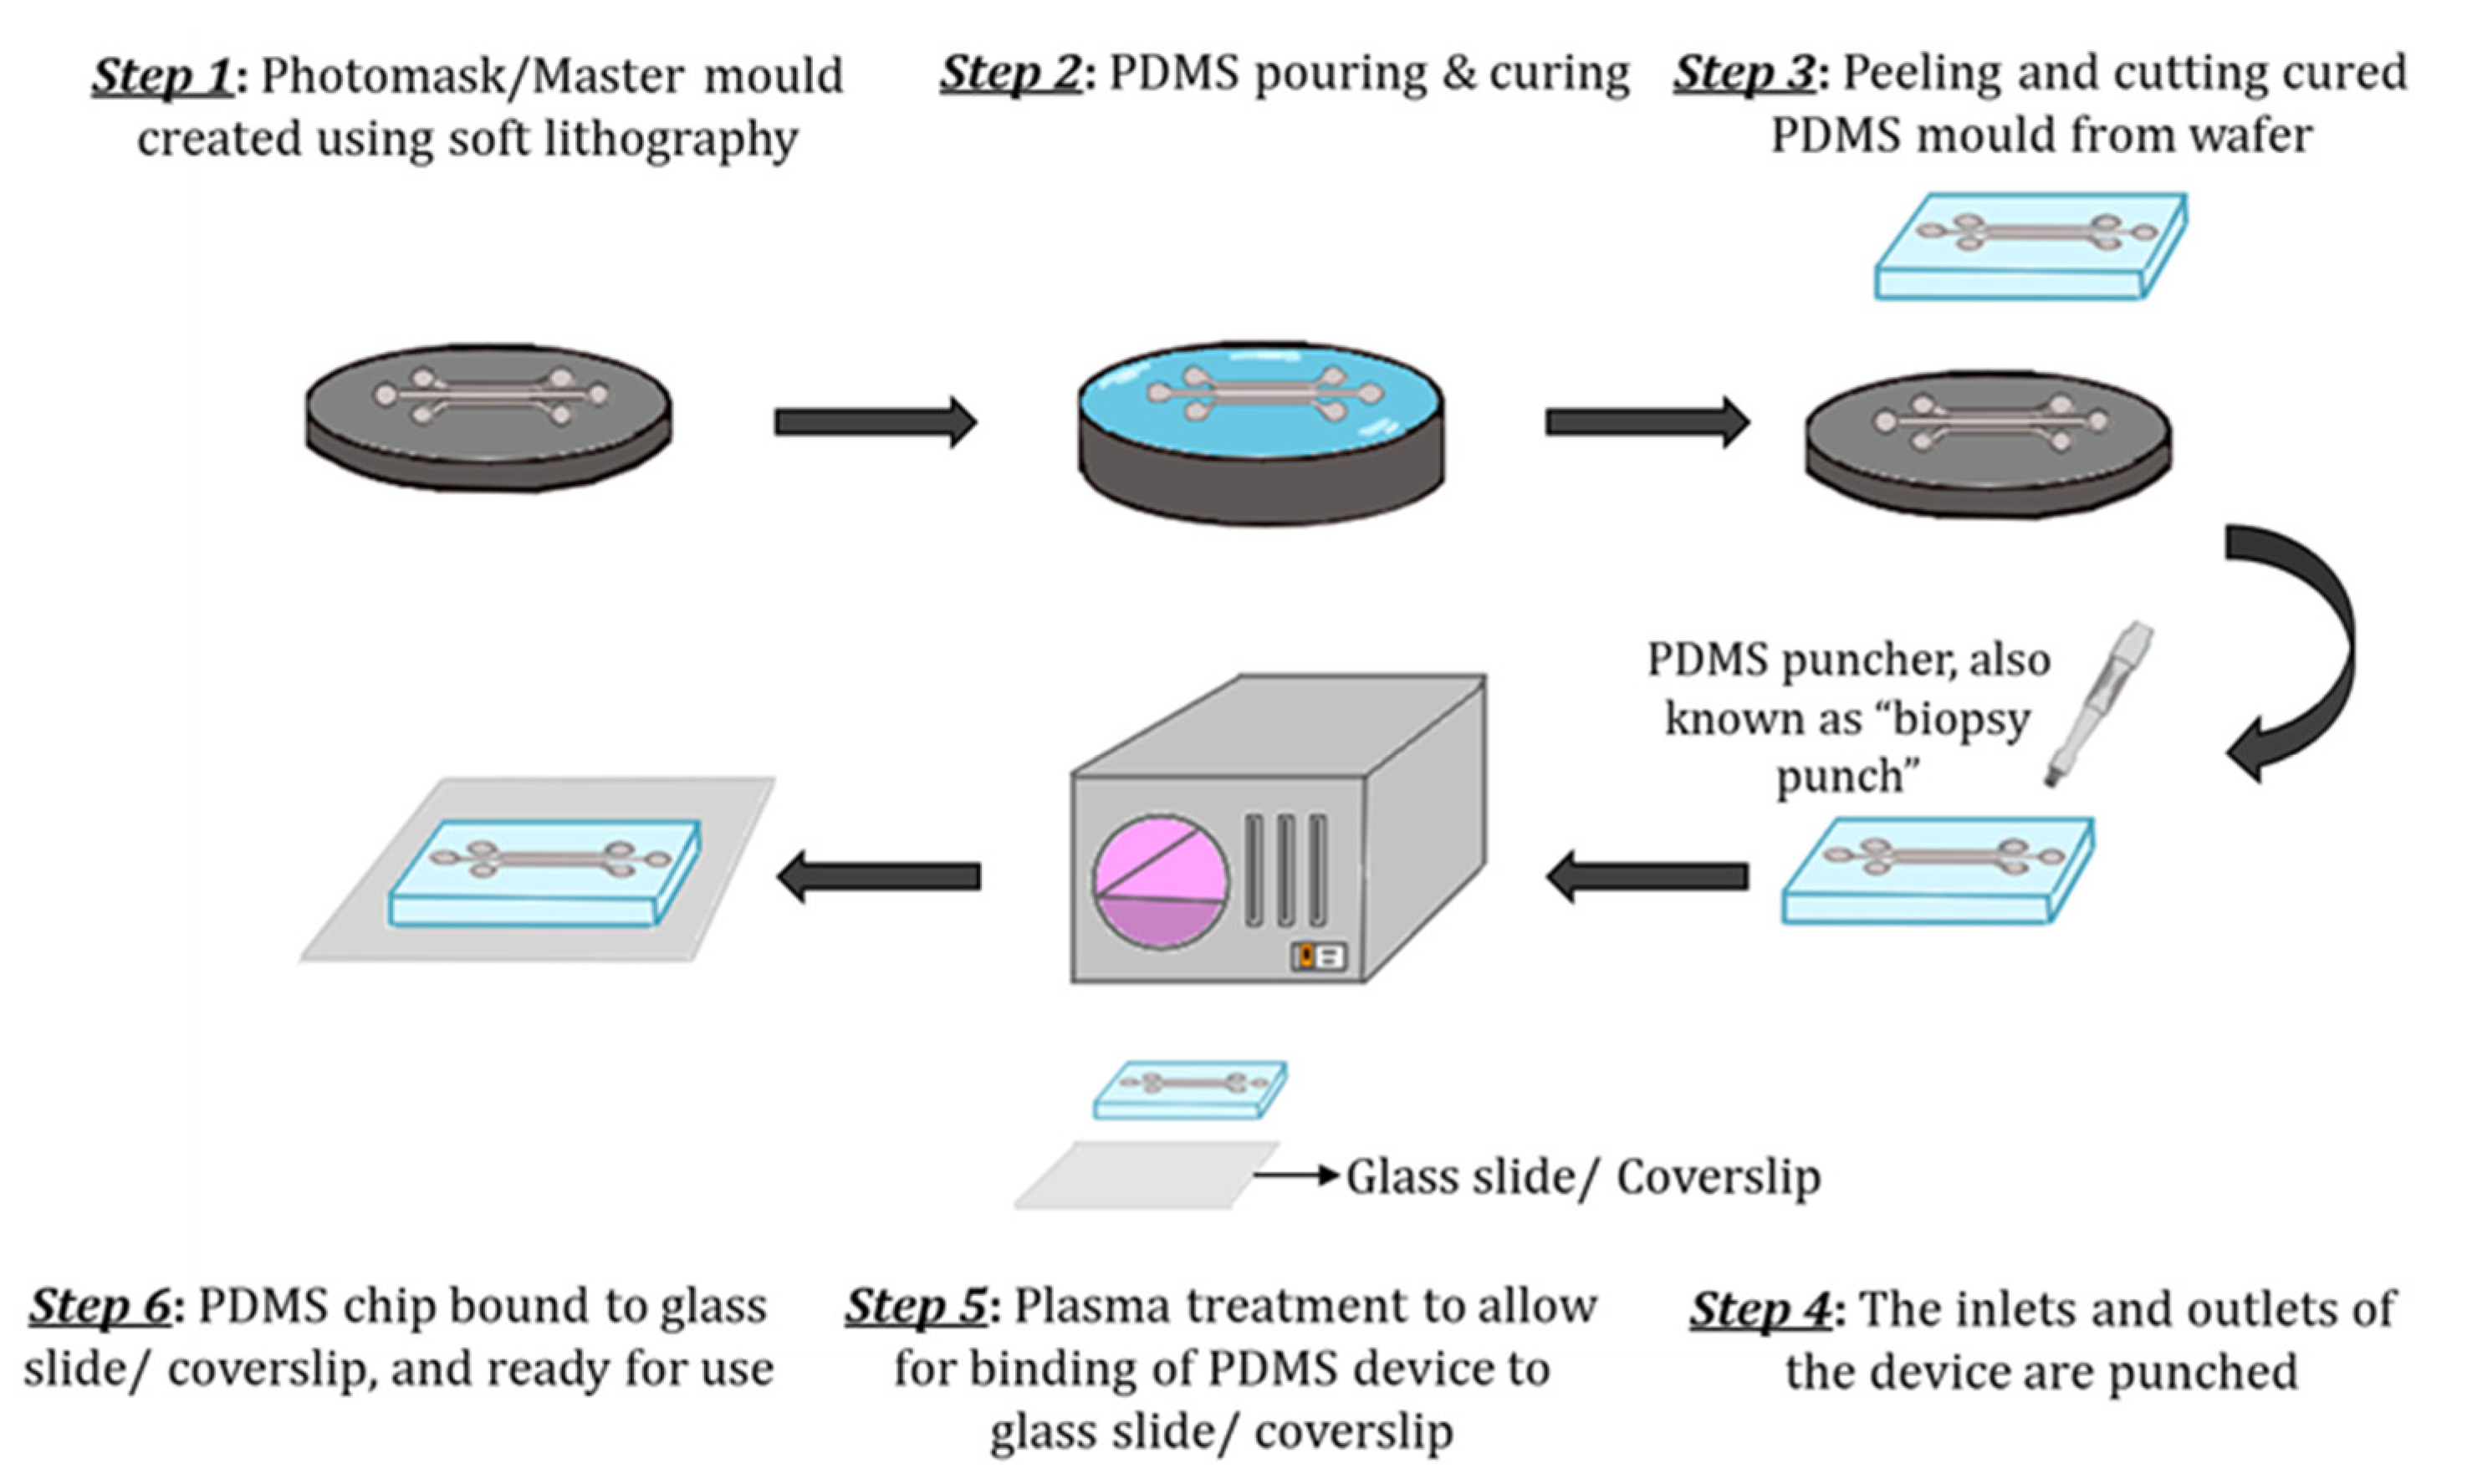
Figure 1. Schematic of the step-by-step process of PDMS device fabrication. (Step 1) The master mould is created using soft lithography. (Step 2) The PDMS mixture (10:1 (base: curing agent)) is poured over the master mould and cured. (Step 3) The solidified PDMS is then cut and peeled from the master mould. (Step 4) The inlets and outlets are punched using a biopsy puncher. (Step 5) The PDMS chip and glass slide/coverslip are activated through plasma treatment. (Step 6) Finally, the PDMS chip is bound to a glass slide/coverslip and cured further for ~2–5 min at 75 °C and is ready to use.
Hydrogels are a polymeric material that has been used to fabricate OoC and GOC models. Hydrogels have a high-water content and can mimic the native ECM. Hydrogels are typically classified as natural, synthetic and hybrids. Natural hydrogels include agarose, collagen, fibrin, etc., [8]. Synthetic hydrogels include polyethylene glycol (PEG) and its derivatives such as PEG- diacrylate (PEG-DA) and polylactic acid (PLA), etc. Collagen is a popular hydrogel for mimicking tissue microenvironments, as it is the most common ECM component of the body [9]. Key characteristics of hydrogels include permeability, porosity, biocompatibility, degradability, and binding sites that allow for precise cell attachment, differentiation, and growth. However, some of the major drawbacks of hydrogels include substandard mechanical properties, poor long-term stability, and batch variability. Hydrogels can also serve as membrane barriers that separate channels but allow for diffusion of nutrients and signalling of molecule exchange, permitting close cell–cell contact, crosstalk, and signalling [10][11]. Moreover, ensuring that the materials used for the microfabrication of GOC models allow for crosstalk between the channels is crucial. Moreover, as mentioned prior, ensuring that parameters such as barrier permeability are measured is pivotal.
1.1. Sensor Integration
Sensor incorporation has enhanced sensing and instrumentation strategies in GOC models. A key parameter that requires constant monitoring in these models is oxygen level, permitting extended co-cultures under desired conditions. In the recently developed GOC model, perfusable channels have oxygen sensors integrated permitting continuous fine-tuning of oxygen levels at both the basolateral and apical sides of epithelial channels. In the HuMiX model, optodes of 5 mm diameter, with a sensitivity up to 0.03% of O2, were bonded into 1.2 mm deep machined pockets using a silicone adhesive, and then cured overnight. Optodes were fixed to both PC enclosures, which were 20 mm adjacent to inlets and outlets of perfusable channels. By this incorporation, authors were able to measure oxygen concentration every 15 min using the sensors, which gave an output to an OXY-4 trace oxygen transmitter/recorder [12].
Similarly, Jalili-Firoozinezhad et al., utilised sensor spots to measure the oxygen concentration in their model. For integration of the sensor spots into their Organ Chip, the authors used a 1 mm biopsy punch to create sensor spots. Then, dipped the discs in uncured PDMS and embedded the discs into the PDMS channel. This was carried out by placing them in moulds at different regions (inlet, middle and outlet), for perfusbale channels, in this case, top and bottom channels. Finally, the authors cured the Organ Chip with the integrated sensors at 60 °C for ~30 min. The two-step moulding process allowed for the accurate placement of the sensors into the relevant regions of interest. Moreover, for the set-up authors used a CCD camera and the VisiSens software that displays the oxygen levels detected by the sensor spots in pseudo colours on a computer. The software calculates oxygen levels through calibration reading defined oxygen levels at 0 and 100% air saturation. For all experiments, the team quantified their oxygen concentration after comparing reading with calibration values [13]. Unfortunately, the number of GOC models with sensors to monitor different parameters are limited and require the use of external techniques for analysis, preventing and delaying real-time decision-making.
1.2. Barrier Integrity
- (a)
-
Transepithelial electrical resistance (TEER)
The transepithelial electrical resistance (TEER) measurement is a common quantitative method used to characterise the barrier function of the layers of the cells inside a GOC or OoC models. TEER represents the resistance of electrical current passing through a cellular monolayer, as a measure of the permeability of ions and barrier function. Whereby, the electrical resistance of a monolayer is measured in Ohms. The classic setup is used to measure TEER (Figure 2), where the cellular monolayer is cultured on a semipermeable filter insert and is defined as two compartments: apical or luminal (upper) and basolateral or abluminal (lower). Two electrodes are used and separated by the cellular monolayer, one is placed in the upper compartment and the other in the lower compartment [14][15]. Transepithelial voltage (Vte) and short circuit current (Isc) also provide information about the cellular barrier. All three parameters (TEER, Vte and Isc) are associated with Ohm’s law, as shown below,
where R represents the resistance (measured in Ohms, Ω), ΔVte is the change in Vte (measured in volts, V) and ΔI is the difference in current flowed (measured in amperes, A). TEER evaluates the electrical resistance across the cell layer and is considered an indicator of the layer’s permeability and robustness [14]. Another method initially determines the resistance across the baseline (R baseline), where there is blank resistance in the membrane (i.e., an absence of cells), then subtracts the readout (R1) which is the resistance across the cell layer on the membrane and multiplies with the growth/surface area of cell culture in cm2 (A) as shown below. The final TEER values are expressed as Ω × cm2 [16][17].
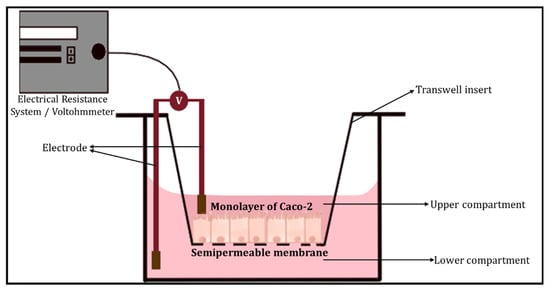
Figure 2. The classic setup used to measure TEER, using an electrical resistance system/Voltohmmeter.
Factors other than the robustness of the cell layer are accounted for in TEER measurements, including arrangements of electrodes and resistance in media [18]. For the GI tract TEER values are defined as ‘tight’, ‘intermediate’ or ‘leaky’ represented by values of ~2000, 300–400 or 50–100 Ω cm2, respectively.
- (b)
-
Dextran permeability
Furthermore, epithelial tight junctions (TJ) create a frontier between the apical and basolateral surface domains of cells, resulting in the regulation of diffusion along the paracellular pathway. The paracellular gate is semi-permeable and restricts diffusion in a size- and charge-selective manner. Barrier integrity can be measured in vitro by monitoring molecules of high molecular weight diffused along the paracellular pathway. Specifically, paracellular permeability of hydrophilic ‘tracers’, such as dextran and polystyrene microspheres, that are fluorescently labelled are often monitored. Dextran, a glucose polymer, is the most used due to its suitability for fluorescent labelling as it has an easily accessible carbonyl and hydroxyl group. Dextran can be designed to be of a range of sizes (3–70 kDa) and charges; it is relatively inexpensive, membrane impermeable and non-toxic to cells [19]. Cellular permeability is characterised by better accuracy when utilising different sizes of oligomers. Currently, the predominantly used macromolecules are labelled with fluorophores such as fluorescein isothiocyanate (FITC-dextran), and dextran labelled with rhodamine, etc., [14][20] Moreover, dysfunction of the epithelial barrier results in increased permeability to FITC-dextran and a decrease in TEER [21]. Some limitations of using dextran permeability methods include poor in vitro assay robustness, and solutes labelled with non-radioactive fluorophore compounds will not provide sensitivity to show the minute changes in the permeability of the monolayer, due to poor specific activity or fluorophore instability [19].
- (c)
-
Cellular Junctional Complex Imaging
Alternately, imaging junctional complex proteins for channels lined with epithelial monolayers in GOC models is an excellent way to ensure barrier integrity. Epithelial cells are bound together by various junctional complexes that are responsible for permeability and barrier integrity. These junctional complexes include TJ, adherens junctions, gap junctions and desmosomes. Whereby, tight junctions are the primary regulators of paracellular permeability, and a complex of proteins situated at the apex of epithelial cells. TJs comprise of numerous transmembrane and cytosolic proteins, such as claudins, occludins, zonula occludens (ZOs), cingulin, tricellulin and junctional adhesion molecules (JAM) [22][23]. Transmembrane proteins such as claudins, occludins and JAM are responsible for linking and sealing the paracellular spaces between adjacent epithelial cells. Claudins, also known as the ‘backbone’ of tight junctions, are differentiated into two classes known as sealing (i.e., responsible for rigidity) and pore-forming claudins. Occludins are commonly associated with controlling intermembrane and paracellular diffusions. Moreover, occludin is a phosphorylated protein, whereby the phosphorylation is associated with TJ localisation [24]. Zonula occluden proteins (e.g., ZO-1, ZO-2 and ZO-3), also known as linker proteins, that connect with other transmembrane proteins such as occludins, claudins and JAM to create strong bonds and interact with the membrane cytoskeleton which consists of F-actin and myosin. ZO proteins essentially form the central system for protein interactions. Tight junction dysregulation results in alterations in barrier function and integrity, often leading to increased production of inflammatory cytokines. Therefore, imaging of junctional complex proteins (zonula occludens-1 (ZO-1) and occludin) is appropriate to measure and determine intact barrier function and integrity [24].
Similarly, the adhesion of endothelial cells is determined by stable interactions between transmembrane proteins that are present in nearby cells. Endothelial cells have namely three types of junctions including gap (i.e., endothelial cells lack desmosomes), tight and adherens junctions. Whereby, vascular endothelial (VE)-cadherin is considered one of the main structures and adhesion protein molecules in adherens junctions, assisting in cell-to-cell contact in endothelial cells. VE-cadherin is responsible for connecting adjacent endothelial cells to each other in a calcium-dependent form. Moreover, VE-cadherin provides the basic organisation of adheren junctions, which is connected through its cytoplasmic domain to β-catenin, p120-catenin and plakoglobin [25]. VE-cadherin can bind intra- and extracellular proteins (as mentioned above) binding molecules assembling into different complexes, that can induce structural changes to the junction and/or initiate intracellular signalling [26][27]. Furthermore, VE-cadherin immunostaining has been performed to investigate the distribution of the adherens junction of a dysfunctional endothelium.
2. Cell Types
A variety of cell types have been utilised for GOC models. Caco-2 [12] or HT-29 cells have been used to mimic IECs. Caco-2 cells have been used to study intestinal absorption and permeability characteristics for decades. These cells are robust, easily accessible and can spontaneously form crypt and villi structures. Caco-2 cells, due to their resemblance to human intestinal barrier in morphology and polarity, are routinely utilised to predict drug permeability in the intestine [17].
HT-29 cells, commonly used to study the physiology and pathology of human colon cancers, have recently attracted attention because of its ability to express features of mature intestinal cells (e.g., enterocytes). However, compared to Caco-2 cells, HT-29 cells take longer to differentiate (15–20 days in Caco-2 cells versus 30 days in HT-29 cells). The enzymatic activity in HT-29 is lower than that of Caco-2. One major difference between both cell lines, is that HT-29 cells can produce mucin at a relatively higher level than Caco-2 [28]. Tan et al., fabricated a GOC model to study drug transport across the intestinal barrier, utilising Caco-2 cells [29]. The team used immunofluorescence staining to target protein Mucin-2, which positively stained the apical surface of the villous Caco-2 monolayer. The Caco-2 cells reflected no mucus production in static Transwell culture, but Mucin-2 was present under low fluidic shear (~0.008 dyne/cm2). The authors suggested that the mucus production was the GI tracts’ defence mechanism against mechanical stress. Shim et al., reported the link between mucus production to high fluid shear flow and peristaltic motion [30]. The team also demonstrated that exposing Caco-2 cells to fluidic shear stress improves human gut’s function by inducing the expression of metabolic enzymes, mucus proteins and the formation of villi-like structures.
Human umbilical vascular endothelial cells (HUVECs) and human intestinal microvascular endothelial cells (HIMECs) are often used to mimic the vasculature [31][32]. Other studies have also used peripheral blood mononuclear cells (PBMCs) isolated from blood as they contain T cells to mimic the immune functions of the vasculature [33][34].
Host immune factors such as antibodies, cytokines, regulatory T cells, etc., are useful indicators of inflammation and thereby inflammatory processes. If the application of GOC model is disease modelling for investigating inflammatory diseases such as inflammatory bowel disease (IBD), immune mediators such as cytokines, their production and stimulation are key parameters to be measured. It assists in understanding the impact of these cytokines on tissue homeostasis. Cytokines are essential in disease pathogenesis. They are small proteins, peptide molecules or glycoproteins that are signalling molecules for complex intercellular interactions. Cytokines are divided into different functional families based on the enhancement of immunological response, including interleukin family (IL), interferon family (IFN), tumour necrosis family (TNF) superfamily and the chemokine family. Cytokines bind to their respective cell surface receptor and initiate a signalling cascade which ultimately results in the up/down regulation of gene expression or transcription factors. The outcome of binding depends on the expression of the complementary receptor, the extracellular levels of cytokine and the type of signalling cascade that is initiated upon binding.
Another commonly monitored component in GOC models where the application is disease modelling for specific inflammatory diseases is lipopolysaccharides (LPS). LPS is an endotoxin which forms the outer wall of Gram-negative bacteria. Increased levels of LPS are often noted in inflammatory diseases such as adipose tissue inflammation. In normal physiological conditions, the gut barrier comprising of the mucosal layers and intestinal epithelium minimises the progression of LPS from the bowel into the systemic circulation. Disruption of the gut barrier, due to diet or pathogenic bacteria, leads to LPS displacement and leakiness. Upon entry into circulation, LPS can trigger various signalling pathways and recruit inflammatory cells to the site, including large proteins such as LPS-binding protein (LBP), Toll-like receptor-4 (TLR4), etc. In the lamina propria, the binding of LPS to TRL4 leads to the activation and secretion of proinflammatory mediators resulting in localised inflammation. If LPS enters the bloodstream, it is bound to either LBP or lipoproteins which interacts with surface receptors such as TLR4 found on immune cells. TLR4 itself is not able to bind LPS but requires a cofactor (i.e., CD14), enabling the transfer of LPS to TLR4 and myeloid differentiation factor 2 (MD2), which controls LPS detection. The LBP then transports LPS to CD14, leading to the activation of NF-ĸB, resulting in increased production of proinflammatory cytokines such as TNF-α, IL-6 and IL-1β. Subsequently, macrophages will infiltrate the region, followed by other immune cells resulting in tissue inflammation [35][36].
A common method used to profile the nature of inflammatory responses of GOC models is using transcriptional readouts such as qPCR and RNA sequencing. RNA sequencing is a comprehensive method that provides detailed information about the type of immune response that is induced in the GOC model. Polymerase chain reaction (PCR) can detect mRNA. Flow cytometric assays can identify intracellular proteins. Due to the range and varying location of cytokine activity, the following parameters must be considered: (a) high sensitivity, specificity, and affinity, (b) reproducibility, (c) detection of a variety of cytokines using a small sample, (d) time and cost-effectiveness. Methods for quantifying cytokine production include bioassays, protein microarrays, high-performance liquid chromatography (HPLC), enzyme-linked immunosorbent assay (ELISA), Meso Scale Discovery electrochemiluminescence (MSD) and multiplex immunoassays (MIA). Among these methods, the direct cytokines measurements are centred on immunometric methods such as ELISA and MIA. Briefly, the immunometric method utilises a primary specific antibody, also known as the capture antibody, which is in a fixed position. The capture antibody will bind to the cytokine that is to be analysed. A second antibody (detection antibody) then binds to the cytokine. The detection antibody usually carries a signal-emitting entity (i.e., fluorescence). Upon specific binding, the resulting signal can directly be used to measure the concentration of the cytokine of interest [37][38]. Beaurivage et al., exposed enterocyte-like cells to an immune-relevant inflammatory trigger utilising an OrganoPlate to epitomise critical physiological aspects of IBD, such as the depletion of barrier integrity and increased cytokine production. The authors mimicked the inflammatory state by applying an immune-relevant cytokine trigger that represents the effect of E. coli-activated dendritic cells on IECs. The authors assessed the effect of the trigger described above as two main aspects of IBD: the integrity of the intestinal barrier and the cellular activation of IEC. Whereby, the intestinal barrier integrity can be characterised through TEER and the localisation of cell junction-associated E-CADHERIN. The protein expression of IL-1β, IFN-γ and mRNA expression of IFN-γ are upregulated in the mucosa of IBD patients. The team optimised the composition of the trigger, concluding that a combination of IL-1β, TNF-α and IFN-γ resulted in the greatest cytokine production in the Caco-2 cells. The trigger effect was then compared to various concentrations of E. coli-activated dendritic cells on the cytokine production of Caco-2 cells. Increased Caco-2 cell activation and a decreased barrier function confirmed the inflammatory state triggered by the immune-relevant cytokines. The cellular activation of Caco-2 cells was quantified by measuring the production of epithelial cytokines (i.e., IP-10, IL-8, and CCL-20). The results indicated an increase in production of the epithelial cytokines upon inflammatory trigger [31].
3. Stimuli
The human gut experiences both peristalsis and segmentation fluid flow. Both types of stimuli assist in the movement and absorption of foods [39]. Furthermore, in the human intestine shear stress contributes greatly to cell differentiation and allows for greater drug absorption, increased mucus production and elevated mitochondrial activity. Therefore, in vitro mechanical stimuli such as shear stress and peristalsis are vital for accurately mimicking the human gut’s physiology, allowing cell differentiation, and preventing bacterial overgrowth [40]. Most GOC models incorporate fluid flow, usually through perfusion channels generating shear stress imitating the human gut. Shear stress in most models is introduced using peristaltic pumps, but these setups are bulky and have low throughput. A key factor imperative for mirroring the peristaltic-like motion is the ability of the cell culture to withstand mechanical deformations over prolonged durations of time. The common range of shear stress within the human gut is between 0.002—0.08 dyne/cm2 [41][42]. External pumping and loading systems can accurately reproduce fluid flow rates and cyclical mechanical deformations (i.e., peristalsis) in GOC models with great precision but are bulky and have low parallelisation. Tan et al., overcame the limitation of low throughput with two peristaltic micropumps, each pump had eight pump lines, allowing fluid delivery through the 16 microchannels [29].
Moreover, under continuous flow and cyclic strain Caco-2 cells undergo cell differentiation, polarisation, villi formation, maintenance of barrier integrity, mucus production, etc., compared to static conditions. Specifically, it was noted that Caco-2 cells require less time to differentiate and polarise under continuous flow compared to static conditions. Tan et al., confirmed this by measuring the aminopeptidase activity (i.e., Caco-2 cells which have differentiated express brush border enzymes); at day 5, Caco-2 cells in the microfluidic device expressed notably higher aminopeptidase activity compared to the static Transwell system at day 21. Implying it took less than half time (~16-days difference) for Caco-2 cells to differentiate and polarise under continuous flow compared to static conditions [29]. It was also noted that with the application of cyclic strain Caco-2 cell growth, differentiation and polarisation are accelerated further [43].
Similarly, under static or even very low rates (e.g., 0.5 μL/min) Caco-2 cells are unable to form villi-like structures; however, with the introduction of continuous flow, villi-formation occurs. Tan et al., confirmed this as the Caco-2 cells seeded their device only took ~5 days under continuous flow to form distinct villi-structures [29]. Likewise, Kasendra et al., and Kim et al., also noted similar results suggesting villi-like structures occurred only in the presence of flow [33][43]. Interestingly, others noted villi-formation can still occur in the absence of cyclic strain as observed previously [29][44]. Moreover, Jalili-Firoozinezhad et al., stated with the continuous flow but the absence of cyclic strain, the number of colonised bacteria was remarkably higher (p < 0.001) and doubled bacterial cell densities in less than 24 h. They concluded that bacterial overgrowth is significantly increased with the cessation of cyclic strain, emphasizing the importance of incorporating of both fluid flow and cyclic strain [13][33]. Furthermore, other features of Caco-2 cells such as mucus production, well-defined tight junction and barrier integrity were only noted under dynamic flow conditions and were completely absent or depleted in static Transwell cultures [29][33][43].
Furthermore, GOC models should experience both fluid flow and peristaltic-like motion allowing for the GOC model to accurately represent the human gut in vitro (Table 1). These dynamic mechanical stimuli not only impact the epithelial cells but also the surrounding microbiota. Moreover, in vitro mechanical stimuli such as fluid flow and cyclic strain contribute to epithelial cell differentiation, polarisation, maintenance of barrier integrity, villi formation, mucus production, etc.
Table 1. Effect of dynamic fluid flow on different GOC models and respective cell lines.
| GOC Model | Flow Rate: | Outcome: |
|---|---|---|
| HuMiX [12] | Flow rate: 25 µL min −1 (Shear rate not reported) |
|
| Organ-on-Chip with TEER [44] | Flow rate: 60 µL h−1 (Shear rate not reported) |
|
| Intestine Chips [13] |
Flow rate: 60 µL h−1 (Shear rate not reported) Cyclic strain: 10% cell strain; 0.15 Hz frequency |
|
| Intestine Chip [43] |
Flow rate: 60 µL h−1 (Shear rate not reported) Cyclic strain: 10% cell strain; 0.2 Hz frequency |
|
| GOC model [18] | Shear stress: 0.02 dyne cm2 (equivalent to flow rate of 30 μL h−1) Cyclic strain: 10% cell strain; 0.15 Hz frequency |
|
| Peristaltic Human Gut-Vessel Microsystem [45] | Shear stress: 0.04 dyne/cm2 (equivalent to flow rate of 60 μL h−1) Cyclic strain: 15% cell strain, 0.15 Hz frequency |
|
| Thiol-ene microchip [29] | Shear stress: 0.008 dyne/cm2 (equivalent to flow rate of 3 μL/min) |
|
4. Gut Microbiota
The human gut is host to a large variety of microbiomes, which are responsible for maintaining gut homeostasis, nutrient absorption, and drug metabolism. Alterations in the gut microbiome composition disrupt homeostasis, induce pathogenesis and disruptions to the mucosal barrier, leading to bacterial translocation and increasing exposure to pathogens and endotoxins [46].
Jalili-Firoozinezhad et al., used Bacteroides fragilis, human commensal symbiotic bacteria that only grows under aerobic (>0.5% oxygen) conditions. The team isolated the gut microbiota from human faeces [13]. Kim et al., utilised the strain of Lactobacillus rhamnosus GG (LGG), originally isolated from the human gut, to study the human intestinal cell-microbe interaction. LGG cells were grown and then transferred to the apical surface of the Caco-2 cells monolayers. To evaluate the viability and function of LGG cells, the team determined the catalytic activity of the LGG β-galactosidases. To do so, the team measured the microbe’s ability to cleave the enzyme substrate, O-nitrophenyl β-d-galactopyranoside. The SpectraMax M5 instrument was used to analyse the collected samples and quantify the amount of product (i.e., O-nitrophenyl) released by the β-galactosidases in the LGG cells. A calibration curve of O-nitrophenyl estimated the amount cleaved [18].
The most established method of characterising gut microbiome was stool sampling. Stool sampling is a non-invasive technique and samples are densely occupied by microbes. Essentially faecal samples were collected, frozen and stored instantly at -80 °C. Subsequently, DNA is extracted from the samples through two stages. First, samples are purified using centrifugation and multiple reagents. Next, samples are incubated with lysis buffer with agitation, allowing further centrifugation. After DNA extraction, the DNA is amplified and 16S rRNA primers are selected for gene sequencing. The resulting gene sequencing data undergo filtering to assure the quality thresholds. Next, operational taxonomic units (OTU) analysis is undertaken. Before this, sequence counts are normalised. The OTU is a method through which related bacteria are categorised and grouped [35].
Monitoring the oxygen supply and concentration is crucial to maintain the gut-microbiome ecosystem. Luminal oxygen levels below 0.5% are necessary since most commensal bacteria are anaerobic. Electrochemical, optical and laser methods can measure the oxygen concentration. Electrochemical and optical are commonly used for measuring dissolved oxygen (DO) levels in liquid. For low intestinal oxygen levels, optical sensors have been advantageous as they prevent an oxygen depletion region from forming and do not require direct contact with the solution [41]. Optical sensors are light-based sensors that measure the change in wavelength after the interaction of an analyte with the bio-recognition element [47]. The most common optical sensors are fluorescent and plasmonic sensors [48]. HuMiX was one of the first GOC models incorporating oxygen sensors. The model has four pst3 oxygen sensors (optodes) affixed to deep-machined pockets of the PC enclosure using silicone adhesive. The simultaneous perfusion of anoxic media (0.1%) through the microbial microchamber, allowed the oxygen level to be maintained at 0.8%. Moreover, the integration of the optodes allowed for the continuous detection and real-time monitoring of DO concentration in the HuMiX model [12].
Another GOC model incorporating high-resolution dissolved oxygen monitoring is the Intestine Chip, which had six sensor disks with oxygen-quenched fluorescent particles fixed on the top and bottom sections of the model, allowing for real-time monitoring of oxygen levels. This GOC model has a central anaerobic chamber which is frequently flushed with saturated 5% CO2 nitrogen gas, sustaining low oxygen levels within the lumen in the upper chamber. Oxygen concentration is determined by variations in fluorescence intensity produced by the sensors, which are captured with the VisiSens camera [13].
References
- Schneider, S.; Gruner, D.; Richter, A.; Loskill, P. Membrane integration into PDMS-free microfluidic platforms for organ-on-chip and analytical chemistry applications. Lab Chip 2021, 21, 1866–1885.
- Borok, A.; Laboda, K.; Bonyar, A. PDMS Bonding Technologies for Microfluidic Applications: A Review. Biosensors 2021, 11, 292.
- Kuncova-Kallio, J.; Kallio, P.J. PDMS and its suitability for analytical microfluidic devices. Conf. Proc. IEEE Eng. Med. Biol. Soc. 2006, 2006, 2486–2489.
- Akther, F.; Yakob, S.B.; Nguyen, N.T.; Ta, H.T. Surface Modification Techniques for Endothelial Cell Seeding in PDMS Microfluidic Devices. Biosensors 2020, 10, 182.
- Ashammakhi, N.; Nasiri, R.; Barros, N.R.; Tebon, P.; Thakor, J.; Goudie, M.; Shamloo, A.; Martin, M.G.; Khademhosseini, A. Gut-on-a-chip: Current progress and future opportunities. Biomaterials 2020, 255, 120196.
- Akther, F.; Little, P.; Li, Z.; Nguyen, N.T.; Ta, H.T. Hydrogels as artificial matrices for cell seeding in microfluidic devices. RSC Adv. 2020, 10, 43682–43703.
- Akther, F.; Zhang, J.; Tran, H.D.; Fallahi, H.; Adelnia, H.; Phan, H.P.; Nguyen, N.T.; Ta, H.T. Atherothrombosis-on-Chip: A Site-Specific Microfluidic Model for Thrombus Formation and Drug Discovery. Adv. Biol. 2022, 2022, 2101316.
- Shen, C.; Li, Y.; Wang, Y.; Meng, Q. Non-swelling hydrogel-based microfluidic chips. Lab Chip 2019, 19, 3962–3973.
- Cherne, M.D.; Sidar, B.; Sebrell, T.A.; Sanchez, H.S.; Heaton, K.; Kassama, F.J.; Roe, M.M.; Gentry, A.B.; Chang, C.B.; Walk, S.T.; et al. A Synthetic Hydrogel, VitroGel((R)) ORGANOID-3, Improves Immune Cell-Epithelial Interactions in a Tissue Chip Co-Culture Model of Human Gastric Organoids and Dendritic Cells. Front. Pharmacol. 2021, 12, 707891.
- Ding, C.; Chen, X.; Kang, Q.; Yan, X. Biomedical Application of Functional Materials in Organ-on-a-Chip. Front. Bioeng. Biotechnol. 2020, 8, 823.
- Su, C.; Menon, N.V.; Xu, X.; Teo, Y.R.; Cao, H.; Dalan, R.; Tay, C.Y.; Hou, H.W. A novel human arterial wall-on-a-chip to study endothelial inflammation and vascular smooth muscle cell migration in early atherosclerosis. Lab Chip 2021, 21, 2359–2371.
- Shah, P.; Fritz, J.V.; Glaab, E.; Desai, M.S.; Greenhalgh, K.; Frachet, A.; Niegowska, M.; Estes, M.; Jager, C.; Seguin-Devaux, C.; et al. A microfluidics-based in vitro model of the gastrointestinal human-microbe interface. Nat. Commun. 2016, 7, 11535.
- Jalili-Firoozinezhad, S.; Gazzaniga, F.S.; Calamari, E.L.; Camacho, D.M.; Fadel, C.W.; Bein, A.; Swenor, B.; Nestor, B.; Cronce, M.J.; Tovaglieri, A.; et al. A complex human gut microbiome cultured in an anaerobic intestine-on-a-chip. Nat. Biomed. Eng. 2019, 3, 520–531.
- Yeste, J.; Illa, X.; Alvarez, M.; Villa, R. Engineering and monitoring cellular barrier models. J. Biol. Eng. 2018, 12, 18.
- Felix, K.; Tobias, S.; Jan, H.; Nicolas, S.; Michael, M. Measurements of transepithelial electrical resistance (TEER) are affected by junctional length in immature epithelial monolayers. Histochem. Cell Biol. 2021, 156, 609–616.
- Srinivasan, B.; Kolli, A.R.; Esch, M.B.; Abaci, H.E.; Shuler, M.L.; Hickman, J.J. TEER measurement techniques for in vitro barrier model systems. J. Lab. Autom. 2015, 20, 107–126.
- Sambuy, Y.; De Angelis, I.; Ranaldi, G.; Scarino, M.L.; Stammati, A.; Zucco, F. The Caco-2 cell line as a model of the intestinal barrier: Influence of cell and culture-related factors on Caco-2 cell functional characteristics. Cell Biol. Toxicol. 2005, 21, 1–26.
- Kim, H.J.; Huh, D.; Hamilton, G.; Ingber, D.E. Human gut-on-a-chip inhabited by microbial flora that experiences intestinal peristalsis-like motions and flow. Lab Chip 2012, 12, 2165–2174.
- Pell, T.J.; Gray, M.B.; Hopkins, S.J.; Kasprowicz, R.; Porter, J.D.; Reeves, T.; Rowan, W.C.; Singh, K.; Tvermosegaard, K.B.; Yaqub, N.; et al. Epithelial Barrier Integrity Profiling: Combined Approach Using Cellular Junctional Complex Imaging and Transepithelial Electrical Resistance. SLAS Discov. 2021, 26, 909–921.
- Buckley, A.; Turner, J.R. Cell Biology of Tight Junction Barrier Regulation and Mucosal Disease. Cold Spring Harb. Perspect. Biol. 2018, 10, a029314.
- Weber, C.R.; Raleigh, D.R.; Su, L.; Shen, L.; Sullivan, E.A.; Wang, Y.; Turner, J.R. Epithelial myosin light chain kinase activation induces mucosal interleukin-13 expression to alter tight junction ion selectivity. J. Biol. Chem. 2010, 285, 12037–12046.
- Chelakkot, C.; Ghim, J.; Ryu, S.H. Mechanisms regulating intestinal barrier integrity and its pathological implications. Exp. Mol. Med. 2018, 50, 1–9.
- Ulluwishewa, D.; Anderson, R.C.; McNabb, W.C.; Moughan, P.J.; Wells, J.M.; Roy, N.C. Regulation of tight junction permeability by intestinal bacteria and dietary components. J. Nutr. 2011, 141, 769–776.
- Barbara, G.; Barbaro, M.R.; Fuschi, D.; Palombo, M.; Falangone, F.; Cremon, C.; Marasco, G.; Stanghellini, V. Inflammatory and Microbiota-Related Regulation of the Intestinal Epithelial Barrier. Front. Nutr. 2021, 8, 718356.
- Giannotta, M.; Trani, M.; Dejana, E. VE-cadherin and endothelial adherens junctions: Active guardians of vascular integrity. Dev. Cell. 2013, 26, 441–454.
- Lagendijk, A.K.; Hogan, B.M. VE-cadherin in vascular development: A coordinator of cell signaling and tissue morphogenesis. Curr. Top. Dev. Biol. 2015, 112, 325–352.
- Vestweber, D. VE-cadherin: The major endothelial adhesion molecule controlling cellular junctions and blood vessel formation. Arterioscler. Thromb. Vasc. Biol. 2008, 28, 223–232.
- Martinez-Maqueda, D.; Miralles, B.; Recio, I. HT29 Cell Line. In The Impact of Food Bioactives on Health: in vitro and ex vivo Models; Verhoeckx, K., Cotter, P., Lopez-Exposito, I., Kleiveland, C., Lea, T., Mackie, A., Eds.; Springer: Cham, Switzerland, 2015; pp. 113–124.
- Tan, H.Y.; Trier, S.; Rahbek, U.L.; Dufva, M.; Kutter, J.P.; Andresen, T.L. A multi-chamber microfluidic intestinal barrier model using Caco-2 cells for drug transport studies. PLoS ONE 2018, 13, e0197101.
- Shim, K.Y.; Lee, D.; Han, J.; Nguyen, N.T.; Park, S.; Sung, J.H. Microfluidic gut-on-a-chip with three-dimensional villi structure. Biomed Microdevices 2017, 19, 37.
- Beaurivage, C.; Naumovska, E.; Chang, Y.X.; Elstak, E.D.; Nicolas, A.; Wouters, H.; van Moolenbroek, G.; Lanz, H.L.; Trietsch, S.J.; Joore, J.; et al. Development of a Gut-On-A-Chip Model for High Throughput Disease Modeling and Drug Discovery. Int. J. Mol. Sci. 2019, 20, 5661.
- Beaurivage, C.; Kanapeckaite, A.; Loomans, C.; Erdmann, K.S.; Stallen, J.; Janssen, R.A.J. Development of a human primary gut-on-a-chip to model inflammatory processes. Sci. Rep. 2020, 10, 21475.
- Kim, H.J.; Li, H.; Collins, J.J.; Ingber, D.E. Contributions of microbiome and mechanical deformation to intestinal bacterial overgrowth and inflammation in a human gut-on-a-chip. Proc. Natl. Acad. Sci. USA 2016, 113, E7–E15.
- Maurer, M.; Gresnigt, M.S.; Last, A.; Wollny, T.; Berlinghof, F.; Pospich, R.; Cseresnyes, Z.; Medyukhina, A.; Graf, K.; Groger, M.; et al. A three-dimensional immunocompetent intestine-on-chip model as in vitro platform for functional and microbial interaction studies. Biomaterials 2019, 220, 119396.
- Al Bander, Z.; Nitert, M.D.; Mousa, A.; Naderpoor, N. The Gut Microbiota and Inflammation: An Overview. Int. J. Environ. Res. Public Health 2020, 17, 7648.
- Ghosh, S.S.; Wang, J.; Yannie, P.J.; Ghosh, S. Intestinal Barrier Dysfunction, LPS Translocation, and Disease Development. J. Endocr. Soc. 2020, 4, bvz039.
- Wright, H.L.; Thomas, H.B.; Moots, R.J.; Edwards, S.W. RNA-seq reveals activation of both common and cytokine-specific pathways following neutrophil priming. PLoS ONE 2013, 8, e58598.
- Sullivan, K.E.; Cutilli, J.; Piliero, L.M.; Ghavimi-Alagha, D.; Starr, S.E.; Campbell, D.E.; Douglas, S.D. Measurement of cytokine secretion, intracellular protein expression, and mRNA in resting and stimulated peripheral blood mononuclear cells. Clin. Diagn. Lab. Immunol. 2000, 7, 920–924.
- Lee, S.H.; Choi, N.; Sung, J.H. Pharmacokinetic and pharmacodynamic insights from microfluidic intestine-on-a-chip models. Expert. Opin. Drug Metab. Toxicol. 2019, 15, 1005–1019.
- De Gregorio, V.; Sgambato, C.; Urciuolo, F.; Vecchione, R.; Netti, P.A.; Imparato, G. Immunoresponsive microbiota-gut-on-chip reproduces barrier dysfunction, stromal reshaping, and probiotics translocation under inflammation. Biomaterials 2022, 286, 121573.
- Marrero, D.; Pujol-Vila, F.; Vera, D.; Gabriel, G.; Illa, X.; Elizalde-Torrent, A.; Alvarez, M.; Villa, R. Gut-on-a-chip: Mimicking and monitoring the human intestine. Biosens. Bioelectron. 2021, 181, 113–156.
- Guo, P.; Weinstein, A.M.; Weinbaum, S. A hydrodynamic mechanosensory hypothesis for brush border microvilli. Am. J. Physiol. Renal. Physiol. 2000, 279, F698–F712.
- Kasendra, M.; Tovaglieri, A.; Sontheimer-Phelps, A.; Jalili-Firoozinezhad, S.; Bein, A.; Chalkiadaki, A.; Scholl, W.; Zhang, C.; Rickner, H.; Richmond, C.A.; et al. Development of a primary human Small Intestine-on-a-Chip using biopsy-derived organoids. Sci. Rep. 2018, 8, 2871.
- Henry, O.Y.F.; Villenave, R.; Cronce, M.J.; Leineweber, W.D.; Benz, M.A.; Ingber, D.E. Organs-on-chips with integrated electrodes for trans-epithelial electrical resistance (TEER) measurements of human epithelial barrier function. Lab Chip 2017, 17, 2264–2271.
- Jing, B.; Wang, Z.A.; Zhang, C.; Deng, Q.; Wei, J.; Luo, Y.; Zhang, X.; Li, J.; Du, Y. Establishment and Application of Peristaltic Human Gut-Vessel Microsystem for Studying Host-Microbial Interaction. Front. Bioeng. Biotechnol. 2020, 8, 272.
- Thursby, E.; Juge, N. Introduction to the human gut microbiota. Biochem. J. 2017, 474, 1823–1836.
- Khan, R.; Khan, R.; Parihar, A.; Sanghi, S.K. Biosensor Based Advanced Cancer Diagnostics: From Lab to Clinics; Academic Press: London, UK, 2022.
- Ladame, S.; Ladame, S.; Chang, J.Y.H. Bioengineering Innovative Solutions for Cancer; Academic Press: London, UK, 2020.
More