Multidisciplinary management of patients with liver metastases (LM) requires a precision medicine approach, based on adequate profiling of tumor biology and robust biomarkers. Radiomics, defined as the high-throughput identification, analysis, and translational applications of radiological textural features, could fulfill this need. The present review aims to elucidate the contribution of radiomic analyses to the management of patients with LM. We performed a systematic review of the literature through the most relevant databases and web sources. English language original articles published before June 2020 and concerning radiomics of LM extracted from CT, MRI, or PET-CT were considered. Thirty-two papers were identified. Baseline higher entropy and lower homogeneity of LM were associated with better survival and higher chemotherapy response rates. A decrease in entropy and an increase in homogeneity after chemotherapy correlated with radiological tumor response. Entropy and homogeneity were also highly predictive of tumor regression grade. In comparison with RECIST criteria, radiomic features provided an earlier prediction of response to chemotherapy. Lastly, texture analyses could differentiate LM from other liver tumors. The commonest limitations of studies were small sample size, retrospective design, lack of validation datasets, and unavailability of univocal cut-off values of radiomic features. In conclusion, radiomics can potentially contribute to the precision medicine approach to patients with LM, but interdisciplinarity, standardization, and adequate software tools are needed to translate the anticipated potentialities into clinical practice.
- radiomics
- texture analysis
- computer-assisted diagnosis
- liver metastases
- gray level matrices
- response to chemotherapy
- overall and recurrence-free survival
1. Introduction
The liver is a frequent target for distant metastases from several tumors. Liver metastases (LM) are associated with poor prognosis and may occur early in gastrointestinal malignancies because of hematogenous spread through the portal venous system[1][2][3][4][5]. Selected patients with LM, mainly those with liver-only metastases, can be considered for aggressive systemic and loco-regional treatments to prolong survival expectancy and optimize quality of life. Several studies have focused on LM from colorectal cancer, for which significant progress has been achieved. Effective chemotherapy may lead to a relevant improvement in survival, exceeding 30 months in the most favorable reports[6][7][8]. Liver resection in selected patients obtained 5-year survival rates as high as 50%[9] [10][11][12]; percutaneous ablation gained consensus, as it can grant effectiveness approaching that of surgery in small LM[13]. The treatment of non-colorectal LM is also evolving, but therapies other than chemotherapy are still less codified[14][15][16].
Such an aggressive policy, including several therapeutic options, requires a precision medicine approach. The selection of the appropriate course of action should rely on an adequate understanding of tumor biology and robust clinical biomarkers. However, the availability of reliable prognostic indices is currently an unmet need. Pathologic details of LM can be identified only ex-post after resection. Response of LM to chemotherapy is strongly associated with prognosis[17][18], but it is overestimated by standard imaging modalities[19][20][21]. Genetic mutations are promising biomarkers, but they are still under evaluation[22][23].
In recent decades, we became aware that imaging contains a great amount of data, namely in the form of grey level patterns, which are invisible to the human eye[24]. These texture characteristics can be correlated with pathology data and outcomes[25], potentially allowing diagnostic and prognostic evaluation. The analysis of textural features in medical images, which rely on mathematical functions, such as histogram analysis and matrices, is termed radiomics[24][26]. Recently, radiomic features have been standardized by the imaging biomarker research initiative[27]. This technology is attractive because it could be used to extract biological data directly from the radiological images, without invasive procedures, thus sparing costs and time and avoiding any risk for the patients. It would ideally embody the concept of "virtual biopsy." For many tumors, radiomic analyses have already provided an accurate evaluation of biology, allowing the identification of indices correlated with clinical outcomes [28][29][30][31]. In LM, where multiple therapeutic options are often available, a radiomics-based approach could be used to attain the most appropriate treatment decision. Based on the available literature, the present systematic review aims to elucidate the contribution of radiomic analyses to the management of patients with LM.
2. General Characteristics of the Studies
Figure 1 depicts the selection process. After screening for duplicates and eligibility, 32 studies were included in the qualitative synthesis. More than half of the publications (n = 18, 56%) were published in the last eighteen months. Most papers (n = 28) described retrospective analyses, while four reported planned secondary analyses of prospectively acquired data[32][33][34][35]. Nineteen authors analyzed computed tomography (CT)[32][33][34][35][36][37][38][39][40][41][42][43][44][45][46][47][48][49][50], eight magnetic resonance imaging (MRI)[51][52][53][54][55][56][57][58], three positron-emission tomography (PET)/CT[59][60][61], and two multiple imaging modalities (CT and MRI; PET and MRI, respectively)[62][63]. Various software applications were used for texture analysis, with these being custom-made in a large proportion of cases (n = 10).
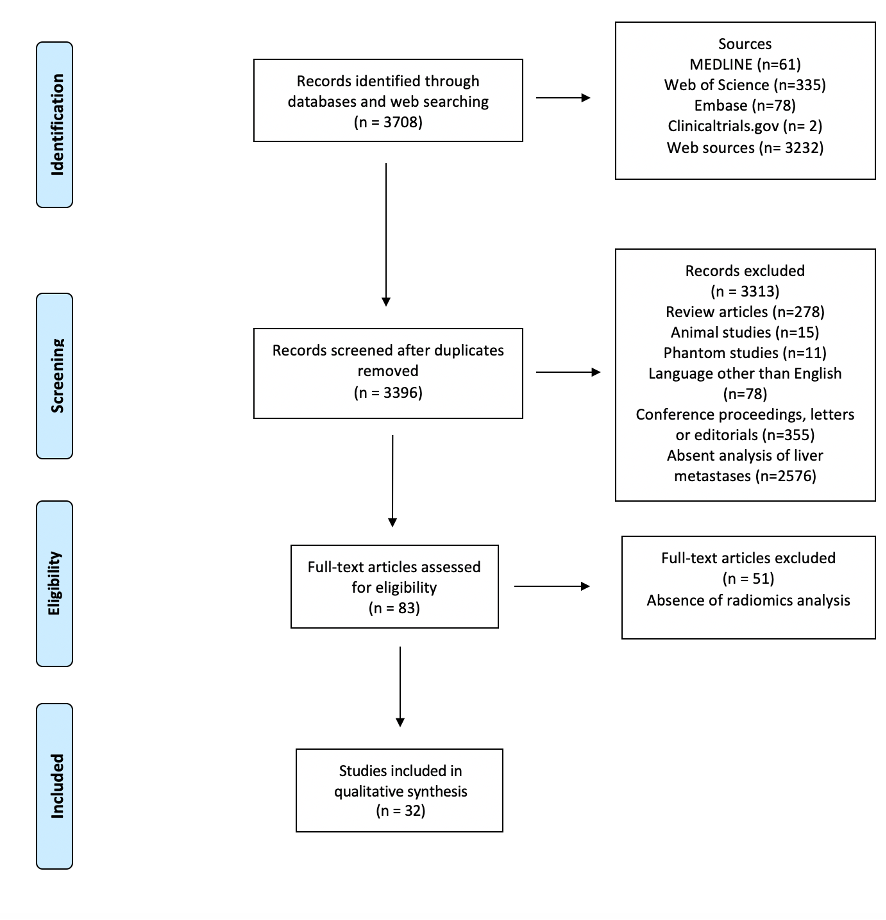
Figure 1. PRISMA Flowchart of study selection.
For the qualitative synthesis, we distinguished four groups of studies according to their subject: 1) radiomics of colorectal LM; 2) radiomics of non-colorectal LM; 3) capability of radiomics to perform differential diagnosis of focal liver lesions, distinguishing LM from other tumors (benign and malignant); 4) technical aspects of radiomics of LM. In the first group (radiomics of colorectal LM), we further distinguished four subgroups of studies according to their endpoints: prediction of survival, prediction of response to chemotherapy, correlation with pathological data, and miscellaneous. For details, refer to Section 4.3. Figure 2 summarizes the organization of qualitative analysis. Most papers (n = 18) analyzed radiomics of colorectal metastases. Due to the heterogeneity of studies, some papers fitted into more categories.
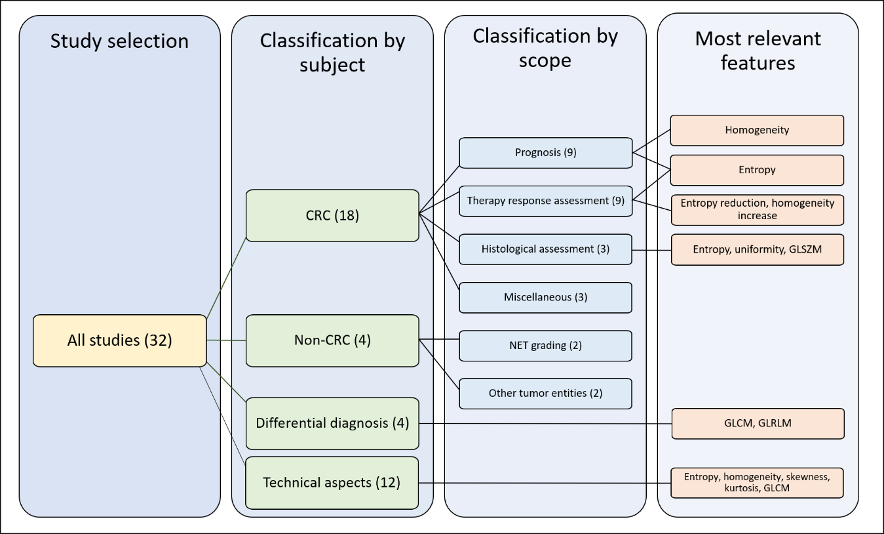
Figure 2. Outline of the selected studies organization. CRC: colorectal cancer, GLSZM: gray level size zone matrices, GLCM: gray level co-occurrence matrices, GLRLM: gray-level run-length matrices.
3. Assessment of Study Quality
The average radiomic quality score (RQS)[64] was in the 10 ± 6.5 (range 1–22), roughly 25% of the maximum score (n = 36). Only four studies (16%)[34][35][39][40] had a score higher than 18 (>50% of the maximum score). The main limitations in quality were the following: no cost-effectiveness analysis (32 studies, 100%); lack of open-data repositories (n = 31, 97%); no phantom calibration (n = 31, 97%); failure to include a calibration statistic (n = 30, 94%); lack of prospective design (n = 28, 87%); and missing validation cohort (n = 18, 56%). At the transparent reporting of a multivariable prediction model for individual prognosis or diagnosis (TRIPOD) checklist[65] (31 elements), studies had an average score of 18 ± 3 points (range 14–29), i.e., 58 ± 10% of the maximum possible score. According to the quality assessment of diagnostic accuracy studies (QUADAS-2)[66], there was a high risk of a patient selection bias in 34% of papers because of selection/inclusion criteria in most cases. One-fourth of studies had a high risk of bias related to the index test or the reference standard, while only one study (3%) had a high risk of bias in flow and timing. The RQS and TRIPOD scores of studies are reported in Table 1. Details of QUADAS-2 assessment and summary of its findings are presented in Table 2 and Supplementary Table S1.
Table 1. Details of studies included in the review.
|
First Author |
Year |
Diagnosis |
# |
Radiological Technique |
Analyzed Series |
Radiomics Software Program |
Analysis of Second-Order Radiomic Features |
Relevant Radiomics Features |
RQS (%) |
TRIPOD (%) |
|
Ahn SJ [37] |
2016 |
CRC |
235 |
CT |
PVP |
C++ based |
N |
Skewness |
4 (11%) |
18 (58%) |
|
Ahn SJ [36] |
2019 |
NS |
259 |
CT |
PVP |
Custom C++ |
Y |
Skewness, kurtosis, entropy, uniformity, and GLCM |
4 (11%) |
20 (65%) |
|
Andersen IR [32] |
2019 |
CRC |
27 |
CT |
Dynamic contrast, PVP |
MatLab-based |
N |
Skewness, entropy, and uniformity |
12 (33%) |
19 (61%) |
|
Beckers RCJ [38] |
2018 |
CRC |
70 |
CT |
PVP |
MatLab-based |
N |
Entropy and uniformity |
5 (14%) |
21 (68%) |
|
Chatterjee A [57] |
2018 |
NS |
69 |
MRI |
T1, Fast spin-echo T2, DWI |
NS |
Y |
GLCM, GLRLM |
17 (47%) |
15 (48%) |
|
Cheng J [39] |
2019 |
CRC |
94 |
CT |
Arterial, PVP |
NS |
Y |
GLSZM, GLNU |
21 (58%) |
20 (65%) |
|
Dercle L [40] |
2020 |
CRC |
667 |
CT |
PVP |
NS |
Y |
Entropy, GTDM, Shape |
22 (61%) |
13 (42%) |
|
Dercle L [35] |
2017 |
NS |
14 |
CT |
PVP |
TexRAD |
N |
Entropy |
11 (31%) |
22 (71%) |
|
Dohan A [33] |
2019 |
CRC |
230 |
CT |
PVP |
TexRAD |
N |
Kurtosis |
21 (58%) |
20 (65%) |
|
Gatos I [51] |
2017 |
Multiple |
22 |
MRI 1,5 T |
T2- and DWI |
NS |
Y |
GLCM, GLRLM |
7 (19%) |
14 (14%) |
|
Jansen MJA [52] |
2019 |
Multiple |
95 |
MRI 1,5 T |
T2-weighted |
NS |
Y |
Entropy, GLCM |
15 (42%) |
16 (52%) |
|
Klaassen R [41] |
2018 |
EC |
18 |
CT |
Late contrast phase |
MatLab-based |
Y |
GLCM |
14 (39%) |
23 (74%) |
|
Li Y [42] |
2019 |
CRC |
24 |
CT |
PVP |
ITK-SNAP |
Y |
Entropy, uniformity, and GLRLM |
15 (42%) |
18 (58%) |
|
LI Z [53] |
2017 |
NS |
67 |
MRI 3 T |
T2-weighted SPAIR |
NS |
Y |
GLCM, GLRLM, GLSZM |
14 (39%) |
17 (55%) |
|
Liang HY [54] |
2016 |
CRC |
53 |
MRI 1,5 T |
ADC maps, arterial, PVP |
MaZda |
N |
None significant |
2 (5%) |
16 (52%) |
|
Lubner MG [43] |
2015 |
CRC |
77 |
CT |
PVP |
TexRAD |
N |
Entropy, Energy |
5 (14%) |
18 (58%) |
|
Martini I [44] |
2019 |
NET |
48 |
CT |
Arterial and PVP |
TexRAD |
N |
Skewness, Kurtosis, and Entropy |
1 (3%) |
16 (52%) |
|
Meyer M [34] |
2019 |
CRC |
78 |
CT |
PVP |
Radiomics |
Y |
Kurtosis, energy, GLCM, GLRLM, and GLSZM |
20 (56%) |
16 (52%) |
|
Peerlings [58] |
2019 |
Multiple |
30 |
MRI 1,5 and 3 T |
DWI |
MatLab-based |
Y |
GLCM, GLRLM, GTDM, GLSZM |
6 (16%) |
18 (58%) |
|
Rahmim A [59] |
2019 |
CRC |
52 |
PET/CT |
18F-FDG PET |
NS |
N |
Uniformity |
6 (16%) |
19 (61%) |
|
Rao SX [45] |
2015 |
CRC |
21 |
CT |
PVP |
MatLab-based |
N |
Entropy and uniformity |
1 (3%) |
19 (61%) |
|
Ravanelli M [46] |
2019 |
CRC |
43 |
CT |
PVP |
MatLab-based |
N |
Uniformity |
16 (45%) |
17 (55%) |
Table 1. Cont.
|
Reimer RP [55] |
2018 |
Multiple |
37 |
MRI 1,5 T |
T1, PVP and hepatocellular |
Mint Lesion |
N |
Skewness and Kurtosis |
5 (14%) |
17 (55%) |
|
Shur J [62] |
2019 |
CRC |
102 |
CT; 1,5/3 T MRI |
PVP (CT); T1 FS and hepatocellular MRI |
Pyradiomics |
Y |
GLSZM |
7 (19%) |
29 (94%) |
|
Simpson AL [47] |
2017 |
CRC |
198 |
CT |
PVP |
NS |
Y |
GLCM |
5 (14%) |
19 (61%) |
|
Song S [48] |
2019 |
Multiple |
20 |
CT |
Arterial phase |
Omni-Kinetic |
Y |
Kurtosis, GLCM |
15 (42%) |
15 (48%) |
|
Trebeschi [49] |
2019 |
Multiple |
NS |
CT |
NS |
NS |
Y |
GLSZM |
17 (47%) |
16 (52%) |
|
Van Helden EJ [61] |
2018 |
CRC |
47 |
PET/CT |
18F-FDG PET |
NS |
|
Entropy and Shape |
8 (25%) |
17 (55%) |
|
Velichko YS [50] |
2020 |
BC |
54 |
CT |
PVP |
LIFEX |
Y |
Uniformity and GLCM |
5 (14%) |
15 (48°%) |
|
Wagner F [60] |
2017 |
CRC |
18 |
CT; PET/CT |
PVP (CT), 18F-FDG PET |
Pmod 3.5 |
N |
Skewness and kurtosis |
1 (3%) |
19 (61%) |
|
Weber M [63] |
2019 |
NET |
100 |
PET/MRI |
68Ga-DOTAPET; MRI ADC |
LIFEX |
Y |
Entropy, uniformity, and GLCM |
5 (14%) |
16 (52%) |
|
Zhang H [56] |
2018 |
CRC |
26 |
MRI 3 T |
T2-weighted |
MatLab-based |
Y |
GLCM |
9 (25%) |
17 (55%) |
CRC: Colorectal Cancer, NET: Neuroendocrine Tumor, EC: esophageal cancer, BC: breast cancer, PVP: portal venous phase, FS: fat suppression, DWI: diffusion-weighted images, SPAIR: spectral-attenuated inversion recovery, ADC: apparent diffusion coefficient, GLCM: gray level co-occurrence matrix, GLRLM: gray-level run-length matrix, GTDM: gray-tone difference matrix, GLSZM: gray level size zone matrix, GLNU: gray-level non-uniformity, NS: not specified.
Table 2. QUADAS-2 evaluation of studies.
|
Evaluation |
Risk of Bias |
Applicability Concerns |
|||||
|
Patient Selection |
Index Test |
Reference Standard |
Flow and Timing |
Patient Selection |
Index Test |
Reference Standard |
|
|
Low Risk |
15 (47%) |
18 (56%) |
18 (56%) |
28 (87%) |
21 (65%) |
21 (65%) |
19 (59%) |
|
High Risk |
11 (34%) |
8 (25%) |
8 (25%) |
1 (3%) |
8 (25%) |
6 (19%) |
6 (19%) |
|
Unclear |
6 (19%) |
6 (19%) |
6 (19%) |
3 (10%) |
3 (10%) |
5 (16%) |
7 (22%) |
Before analyzing the studies' results in detail, it is helpful to elucidate terminology that is commonly used in radiomics. The definition of radiomic features investigated in the studies is detailed in Table 3. In addition, region of interest (ROI) is defined as the selected area or volume of any imaging modality to analyze for the extraction of radiomic features.
Table 3. Overview of the analyzed radiomic characteristics.
|
Feature Family |
General Description |
Common Features |
Specific Description |
|
Shape & Size |
2D/3D geometric properties of the region of interest |
Area |
|
|
Volume |
Number of voxels in the ROI |
||
|
Maximum 3D diameter |
The maximum distance between any two voxels on the surface of the ROI |
||
|
Major axis length |
|||
|
Minor axis length |
|||
|
Surface Area |
|||
|
Compactness |
How compact the region is independent of scale and orientation |
||
|
Elongation |
The inverse of compactness |
||
|
Flatness |
Absence of curvature in an ROI |
||
|
Sphericity |
The roundness of the shape of the ROI relative to a sphere |
||
|
Spherical disproportion |
ROI surface area /surface area of a sphere based on ROI radius |
||
|
First Order Statistics |
Intensity distribution in the ROI based on the intensity histogram, regardless of the spatial relationships |
Intensity |
Includes mean, min, max, SD, and percentiles |
|
Energy |
The magnitude of voxel intensities (sum of square voxel values) |
||
|
Uniformity/homogeneity |
The sum of the squares of each intensity value in the ROI |
||
|
Entropy |
Amount of information in voxel values |
||
|
Skewness |
Asymmetry of values. Negative skewness: data are skewness to the right of the mean (higher values). Positive skewness: data are skewed to the left of the mean (lower values). |
||
|
Kurtosis |
Distribution of voxel values. Low kurtosis: most data points are close to the mean (few outliers). High kurtosis: data are spread far from the mean (more outliers). |
||
|
Second-Order Statistics |
Textural features quantifying tumor heterogeneity by analyzing the spatial distribution of pixel/voxel intensities |
Gray level co-occurrence matrix (GLC M) |
Measures the arrangements of voxel pairs along a fixed direction (homogeneity, contrast, correlation, entropy, dissimilarity, and angular second moment/energy) |
|
Gray level run length matrix (GLRLM) |
Consecutive voxels with the same intensity along with fixed directions (can have long- or short-run, as well as low- and high-gray level emphasis). |
||
|
Gray level size zone matrix (GLSZM) |
Clusters of connected pixels with the same grey value. They can have small- and large-area as well as low- or high-gray emphasis. |
||
|
Neighborhood gray tone/level difference matrix (NGTDM/NGLDM) |
The difference in gray level between one voxel and its 8/26directions (in 2D/3D). Includes rate, intensity, and frequency of intensity change. |
||
|
Model-or transform-based Statistics |
Relationship between three or more pixels or voxels |
Autoregressive model |
Filters or mathematical transforms to the images identifying repetitive or non-repetitive patterns, suppressing noise, or highlighting details, extract areas with increasingly coarse texture patterns |
|
Wavelet transform |
|||
|
Fractal analysis |
|||
|
Minkowski functionals |
|||
|
Fourier transform |
2.3. Radiomics of LM From Colorectal Cancer
2.3.1. Prediction of Survival
Ten studies analyzed radiomic features' ability to predict the outcome of patients with colorectal LM [32,33,38,40,43,46,47,59,61,62]. Four included training and validation datasets [33,37,40,46]. The endpoint was overall survival (OS) in nine studies [32,33,38,40,43,46,47,59,61], progression-free survival (PFS) in four [46,59,61,62], hepatic PFS in one [47], and event-free survival in one [59]. In six papers, patients underwent chemotherapy [32,33,40,43,46,61], in two, liver surgery [47,62], and in two, either chemotherapy or surgery [38,59]. Six studies analyzed imaging modalities before treatment [38,43,47,59,61,62], while four performed comparative analyses of imaging modalities before and after chemotherapy [32,33,40,46]. Two studies performed texture analysis not only of LM but also of non-tumoral liver [38,47]. Finally, six studies analyzed the prognostic role of radiomic features in comparison or combination with traditional biomarkers [33,38,46,47,59,62].
Four studies demonstrated an association between the homogeneity/heterogeneity of LM and survival. Ravanelli et al. reported lower OS and PFS in patients with a higher uniformity of LM at CT scan (cut-off ≥0.42; relative risk (RR) = 6.94; 95% confidence intervals (95%CI) = 1.79–26.79 for OS; RR = 5.05, 95%CI = 1.74–14.66 for PFS) [46]. Andersen et al. described an association between shorter OS and tumor homogeneity at CT (hazard ratio (HR) ranging from 1.5 × 10²⁰ to 1.3 × 1049, according to the filter used) [32]. Comparing imaging before and after chemotherapy, Dercle et al. identified a radiomic signature associated with OS based on two measures of heterogeneity (spatial heterogeneity and Graytone Difference Matrix contrast, HR = 44.3, 95%CI = 6.4–307.7 for patients with high imaging quality; HR = 6.5, 95%CI = 1.8–23.6 for patients with standard imaging quality) [40]. In the validation setting, the radiomic signature predicted survival better than KRAS-mutational status and 8-week tumor shrinkage evaluated according to RECIST criteria (AUC = 0.80 vs. AUC = 0.67 for KRAS and AUC = 0.75 for RECIST, p < 0.001). Finally, in the study by Rahmim et al., at multivariable analysis, LM heterogeneity at 18F-FDG PET/CT was a predictor of shorter OS (included into a predictive model, HR = 4.29, 95%CI = 2.15–8.57) [59]. The authors also depicted a model including histogram uniformity, number of metastases, and metabolic tumor volume that was predictive of a shorter event-free survival (HR = 3.20, 95%CI 1.73–5.94, p < 0 .001) [59].
Three studies showed an association between entropy and prognosis. Andersen et al. and Lubner et al. reported that the higher the entropy of LM, the better the OS (HR ranging from 0.16 to 0.63 in the Andersen et al. study, according to the filter used; HR = 0.65, 95%CI = 0.44–0.95 at coarse filter level in the Lubner et al. study) [32,43]. On the other hand, Beckers et al. reported some prognostic value of the ratio between entropy of LM and entropy of parenchyma (the higher the value, the shorter the OS, HR = 1.9, 95%CI = 0.95–3.78) [38].
Additional radiomic features have been reported. In the Simpson et al. study, LM correlation and contrast (combined into a single texture parameter) were associated with OS (HR = 2.35, 95%CI = 1.21–4.55) [47]. Dohan et al. analyzed imaging modalities before and after treatment and identified three predictors of OS: a decrease in the sum of the target liver lesions, high baseline density of dominant liver lesion, and drop in kurtosis [33]. Those three features (combined into a texture analysis score) evaluated after two months of chemotherapy had a strong association with OS (SPECTRA Score >0.02 vs. ≤0.02, HR = 2.82, 95%CI = 1.85–4.28 in the training dataset; HR = 2.07, 95%CI = 1.34–3.20 in the validation dataset). Radiomic score at two months had the same prognostic value of RECIST criteria after six months of chemotherapy. Shur et al. reported an association of minimal pixel value (negative prognostic factor, HR = 1.66, 95%CI = 1.28–2.16) and gray level size zone matrix (GLSZM) small area emphasis (positive prognostic factor, HR = 0.62, 95%CI = 0.47–0.83) with the PFS [62]. Finally, the following features have been associated with OS: standard deviation [32], LM density at CT scan [46], future liver remnant energy and entropy combined into a single linear predictor [47], ShapeSI4 (included in a radiomic signature) [40], and area under the curve of volume histograms at PET-CT [61].
The results of studies about radiomic features associated with the prediction of survival are summarized in Table 4 and Supplementary Table S2.
2.3.2. Prediction of Response to Systemic Chemotherapy
Ten studies analyzed the association between radiomic features and response to chemotherapy [32,33,37,38,40,45,46,54,56,61]. Evidence mainly regarded patients receiving anti-VEGF treatment. had training and validation datasets [33,37,40,46]. The reference standard was RECIST criteria in all but one study, which used tumor regression grade (TRG) [45]. Half of the studies analyzed the imaging modalities before and after treatment [32,33,40,45,46], while the other half considered only baseline imaging [37,38,54,56,61]. Four studies focused on targeted therapies associated with systemic chemotherapy [32,33,45,46].
In the Rao et al. paper, the entropy of LM after chemotherapy decreases in responders, while uniformity increases (entropy: −5.13 in responders vs. +1.27 in non-responders, OR = 1.34, 95%CI = 0.92–1.93; uniformity: +30.84 vs. −0.44, respectively, OR = 0.95, 95%CI = 0.89–1.01) [45]. Ravanelli et al. associated a good response with low baseline uniformity (cut-off ≥0.42; OR = 20, 95%CI = 1.85–217.4) [46]. In the study by Beckers et al., treatment success was slightly associated with higher entropy (6.65 ± 0.26 in responders vs. 6.51 ± 0.34 in non-responders, p = 0.08) [38]. The Zhang et al. analysis of T2 MRI images before chemotherapy showed that responding lesions had a higher variance and lower angular second moment (two measures of homogeneity) than non-responding ones (variance: 446.07 ± 329.60 in responders vs. 210.23 ± 183.39 in non-responders, p < 0.001; angular second moment: 0.96 ± 0.02 vs. 0.98 ± 0.01, respectively, p < 0.001) [56]. Dercle et al. built a signature, based on two measures of entropy, gray-tone difference matrix contrast and shape, which allowed to predict responsiveness to anti-angiogenic treatment (AUC = 0.80, CI95% = 0.69–0.94 for patients with high imaging quality; AUC = 0.72, CI95% = 0.59–0.83 for patients with standard imaging quality) [40]. Andersen et al. depicted LM modification after treatment with regorafenib. They observed data discordant with previous analyses (increase in entropy and decrease in uniformity), but none of the patients displayed a measurable response (85% had stable disease, while the remaining ones had progression) [32]. Considering skewness, in the study of Ahn et al., low baseline values (indicating a higher spread towards higher gray levels) were associated with response (0.02 ± 0.32 in responders vs. 0.33 ± 0.44 in non-responders, p = 0.001) [37]. One study demonstrated a skewness increase during treatment [32]. In opposition to CT and MRI, high entropy detected at 18F-FDG PET images before treatment predicted a worse response to therapy (AUC = 0.74, 95%CI = 0.52–0.97) [61].
Other features have been associated with response: high mean attenuation [37]; narrow standard deviation [37]; high baseline density of dominant liver lesion [33]; and mean values of histogram parameters for apparent diffusion coefficient maps [54].
The results of studies about radiomic features associated with the prediction of response to chemotherapy are summarized in Table 4 and Supplementary Table S3.
2.3.3. Prediction of Pathology Data
Three studies evaluated the association between radiomic features and pathology data [39,43,45]. Lubner et al. demonstrated that entropy, mean of positive pixels, and standard deviation are inversely associated with tumor grading (p = 0.007 for entropy, p = 0.002 for mean positive pixels, and p = 0.004 for standard deviation), while skewness and kurtosis showed a trend for an inverse association with KRAS mutation (p = 0.04 for skewness, and p = 0.058 for kurtosis) [43]. Cheng et al. reported that growth patterns of LM (desmoplastic, replacing, and pushing) can be successfully discerned on CT images by using second-order radiomic features, in particular gray level size zone matrix and gray level non-uniformity (AUC = 0.926, 95%CI = 0.875–0.978 in the training dataset; AUC = 0.939, 95%CI = 0.859–1.000 in the external validation dataset) [39]. In Rao et al.’s paper, the delta in entropy and uniformity values between pre- and post-chemotherapy imaging modalities were predictors of TRG values in patients receiving oxaliplatin-based chemotherapy with or without bevacizumab (entropy variation: −5.13 in TRG 1–2 vs. +1.27 in TRG 3–5, OR = 1.34, CI95% = 0.92–1.93; uniformity variation: +30.84 vs. −0.44, respectively, OR = 0.95, CI95% = 0.89–1.01), while RECIST criteria were not [45].
2.3.4. Other Papers
Three additional papers studied the radiomic features of colorectal LM. Reimer et al. analyzed the evaluation of response of LM undergoing trans-arterial radio-embolization [55]. In post-treatment MRI, higher kurtosis in arterial and portal phases and higher skewness in portal phase identified patients with a progressive disease earlier than standard RECIST criteria. Li Y et al. reported a model based on radiomic features of the primary tumor and LM before resection (heterogeneity, entropy, energy of vertical wavelet, emphasis) that was able to predict the future appearance of further LM [42]. Wagner et al. analyzed CT and PET-CT imaging of primary tumor and LM [60]. They demonstrated that colon cancer and LM have different skewness and kurtosis at both imaging modalities (CT and PET-CT), while colon cancers with or without LM have similar features.
Table 4. summarizes the data of studies dealing with colorectal LM.
Table 4. Studies on radiomics in patients with liver metastases from colorectal cancer.
|
First Author |
Year |
Design |
# |
Imaging |
Analyzed Imaging |
Main Intervention |
Intervention Type |
Pathology Data |
Validation Cohort |
Outcome Measures |
Synopsis of Findings |
|
Survival |
|||||||||||
|
Lubner MG [43] |
2015 |
R |
77 |
CT |
Pre-therapy |
Systemic therapy |
NS |
Y |
N |
OS |
Entropy correlated with longer OS |
|
Simpson AL [47] |
2017 |
R |
198 |
CT |
Pre-therapy |
Surgery |
Metastasectomy |
N |
N |
OS/HDFS |
Tumor correlation and contrast were associated with OS; future liver remnant energy and entropy were associated with OS and HDFS |
|
Andersen IR [32] |
2019 |
P |
27 |
CT |
Pre/post-therapy |
Systemic therapy |
Regorafenib |
N |
N |
OS |
LM uniformity predicted shorter OS; LM entropy predicted longer OS |
|
Beckers RCJ [38] |
2018 |
R |
70 |
CT |
Pre-therapy |
Systemic therapy or surgery |
XELOX with or w/o Bevacizumab |
N |
N |
OS |
LM/parenchyma entropy ratio correlated with disease burden and OS. |
|
Dercle L [40] |
2020 |
R |
667 |
CT |
Pre/post-therapy |
Systemic therapy |
FOLFIRI with-w/o Cetuximab |
N |
Y |
OS |
A signature using Shape SI4, Log Z/X Entropy, GTDM Contrast can predict OS. |
|
Dohan A [33] |
2019 |
P |
230 |
CT |
Pre/post-therapy |
Systemic therapy |
FOLFIRI and Bevacizumab |
N |
Y |
OS |
A radiomic score granted earlier OS prediction than RECIST 1.1 |
|
Rahmim A [59] |
2019 |
R |
52 |
FDG PET |
Pre-therapy |
Mixed |
Systemic, RF, or Metastasectomy |
N |
N |
OS, EFS |
LM heterogeneity predicts OS; histogram uniformity predicts EFS |
|
Ravanelli M [46] |
2019 |
R |
43 |
CT |
Pre/post-therapy |
Systemic therapy |
FOLFIRI/FOLFOX with-w/o Bevacizumab |
N |
N |
OS, PFS |
Uniformity was related to PFS; uniformity and CT density were associated with OS in the EGFR group |
|
Shur J [62] |
2019 |
R |
102 |
CT; MRI |
Pre-surgery |
Neoadjuvant therapy and surgery |
NS, Metastasectomy |
N |
N |
DFS |
Minimum pixel value and GLSZM small area emphasis are associated with DFS. |
|
Van Helden EJ [61] |
2018 |
R |
47 |
FDG PET |
Pre-therapy |
Systemic therapy |
XELOX with or w/o Bevacizumab or Cetuximab |
N |
N |
OS, PFS |
AUC-ISH predicted OS and PFS |
Table 4. Cont.
|
Response to chemotherapy |
|||||||||||
|
Ahn SJ [36] |
2016 |
R |
235 |
CT |
Pre-therapy |
Systemic therapy |
FOLFIRI or FOLFOX |
N |
Y |
RECIST |
Lower skewness on 2D, higher attenuation in 3D, narrower SD on 3D predict the therapy response |
|
Andersen IR [32] |
2019 |
P |
27 |
CT |
Pre/post-therapy |
Systemic therapy |
Regorafenib |
N |
N |
RECIST |
Entropy and skewness increased; uniformity decreased after treatment |
|
Beckers RCJ [38] |
2018 |
R |
56 |
CT |
Pre-therapy |
Systemic therapy |
XELOX with-w/o Bevacizumab |
N |
N |
RECIST |
LM entropy showed a trend for being higher in responders |
|
Dercle L [40] |
2020 |
R |
667 |
CT |
Pre/post-therapy |
Systemic therapy |
FOLFIRI with-w/o Cetuximab |
N |
Y |
RECIST |
Shape SI4, Log Z/X Entropy, GTDM Contrast can predict Cetuximab sensitivity. |
|
Dohan A [33] |
2019 |
P |
230 |
CT |
Pre/post-therapy |
Systemic therapy |
FOLFIRI and Bevacizumab |
N |
Y |
RECIST |
LM density, integrated into a radiomics score, identified responders. |
|
Liang HY [54] |
2015 |
R |
53 |
MRI |
Pre-therapy |
Systemic therapy |
Fluorouracil-based chemotherapy |
N |
N |
RECIST |
Mean ADC values are lower in responders. |
|
Rao SX [45] |
2015 |
R |
21 |
CT |
Pre/post-therapy |
Systemic therapy |
XELOX with-w/o Bevacizumab |
Y |
N |
TRG |
A decrease in entropy and uniformity increase after treatment correlates with response. |
|
Ravanelli M. [46] |
2019 |
R |
43 |
CT |
Pre/post-therapy |
Systemic therapy |
FOLFIRI/FOX with-w/o Bevacizumab |
N |
N |
RECIST |
Uniformity discriminated EGFR responders from non-responders |
|
Van Helden EJ [61] |
2018 |
R |
47 |
FDG PET |
Pre-therapy |
Systemic therapy |
XELOX with or w/o Bevacizumab or Cetuximab |
N |
N |
RECIST |
Entropy was higher in patient non-responders |
|
Zhang H [56] |
2018 |
R |
26 |
MRI |
Pre-therapy |
Systemic therapy |
FOLFORI or FOLFOX or XELOX |
N |
N |
Size change |
Responding LM had a higher variance and lower angular second moment |
|
Miscellaneous |
|||||||||||
|
Cheng J [39] |
2019 |
R |
94 |
CT |
Pre-therapy |
Surgery |
Partial hepatectomy |
Y |
Y |
HGP |
A clinic-radiomics model (GLSZM and gray level non-uniformity) can predict growth patterns. |
|
Li Y [42] |
2019 |
R |
24 |
CT |
Pre-therapy |
Surgery |
Colectomy, lymphadenectomy, metastasectomy |
N |
Y |
LM occurrence |
Heterogeneity, entropy, energy, and GLRLM_LGE predicted the risk of LM |
Table 4. Cont.
|
Reimer RP [55] |
2018 |
R |
16 |
MRI |
Post-therapy |
TARE |
TARE with 90Y-microspheres |
N |
N |
RECIST |
High kurtosis (arterial/venous) and low skewness (venous) identified progression |
|
Wagner F [60] |
2017 |
R |
18 |
CT; FDG PET |
Pre-therapy |
Systemic therapy |
NS |
N |
N |
Primary/LM |
Skewness and kurtosis (CT) and kurtosis (PET) are different in primary and LM |
R: Retrospective, P: Prospective, CRC: Colorectal Cancer, NET: Neuroendocrine Tumor, LM: liver metastases, RF: radiofrequency, XELOX: Capecitabine and Oxaliplatin, FOLFIRI: Fluorouracil and Irinotecan, FOLFOX: Fluorouracil and Oxaliplatin, TARE: trans-arterial radioembolization, OS: overall survival, HDFS: hepatic disease-free survival, EFS: event-free survival, PFS: progression-free survival, RECIST: response evaluation criteria in solid tumors, HGP: histological growth patterns, GLSZM: gray level size zone matrix, GTDM: gray-tone difference matrix, ADC: apparent diffusion coefficient, AUC-ISH: area-under-the-curve of cumulative SUV/Volume histograms, NS: not specified.
4. Radiomics of Non-Colorectal LM
Four papers focused on non-colorectal LM. A single study assessed CT-based radiomic indices in LM from esophageal cancer [41]. The study found that the characteristics of pre-treatment CT related to heterogeneity and gray-level intensity, such as wavelet gray level co-occurrence matrix correlation and gray level distance zone matrix with large dependence emphasis, were predictors of response to chemotherapy. Two studies explored radiomic analyses in LM from neuroendocrine tumors (NET)[44][63]. Martini et al. analyzed a small series of patients (n = 49) but observed a number of associations: pancreatic NET had lower skewness and higher mean HU than non-pancreatic ones; entropy in the arterial phase was negatively associated with PFS in pancreatic NET and with OS in non-pancreatic NET; kurtosis was associated with lower OS in pancreatic NET, while skewness with higher one[44]. Weber et al. investigated the correlation between parameters derived from the somatostatin receptor agonist (68Ga-DOTATOC) PET and MRI with the proliferation index Ki67[63]. Entropy and dissimilarity (from both PET and MRI) had a direct correlation with Ki67, while homogeneity had an inverse one. Moreover, it was possible to distinguish G1 and G2 LM on the basis of entropy, homogeneity, and dissimilarity (on PET data only). Finally, Trebeschi et al. reported heterogeneity-related radiomics parameters as predictors of response to immunotherapy in LM of melanoma and non-small-cell lung carcinoma[49].
2.5. Differentiation of LM From Other Hepatic Lesions
Four studies investigated whether radiomic features could discriminate LM from other hepatic lesions. Jansen et al. analyzed metastases, primary hepatic tumors, and benign lesions (adenomas, cysts, and hemangiomas) on MRI images[52]. A model using, among other features, the time to peak histograms and the sum of squared variance could distinguish different liver lesions. In the paper by Gatos et al., selected texture characteristics (inverse different moment, sum variance, and long-run emphasis) could differentiate metastases, hepatocellular carcinoma (HCC), and benign lesions[51]. Li et al. tested a model to distinguish hemangiomas, LM, and HCC, using second-order features (gray level co-occurrence matrix, gray-level run-length matrix, and intensity-size zone matrix)[53]. In their model, no feature combination could differentiate the three types of lesion at the same time. Differential diagnosis of the two malignant entities (LM and HCC) required a more complex model, with a higher number of features, than differential diagnosis between benign and malignant lesions (LM vs. hemangiomas or HCC vs. hemangiomas). Finally, a study by Song et al. identified kurtosis, variance, and inverse difference moment as distinguishing criteria between benign and malignant hypervascular lesions[48]. Only the latter study used pathology data as the reference standard for all the analyzed patients.
Figure 3 provides an overview of the potential contribution of radiomics to the management of patients with LM.
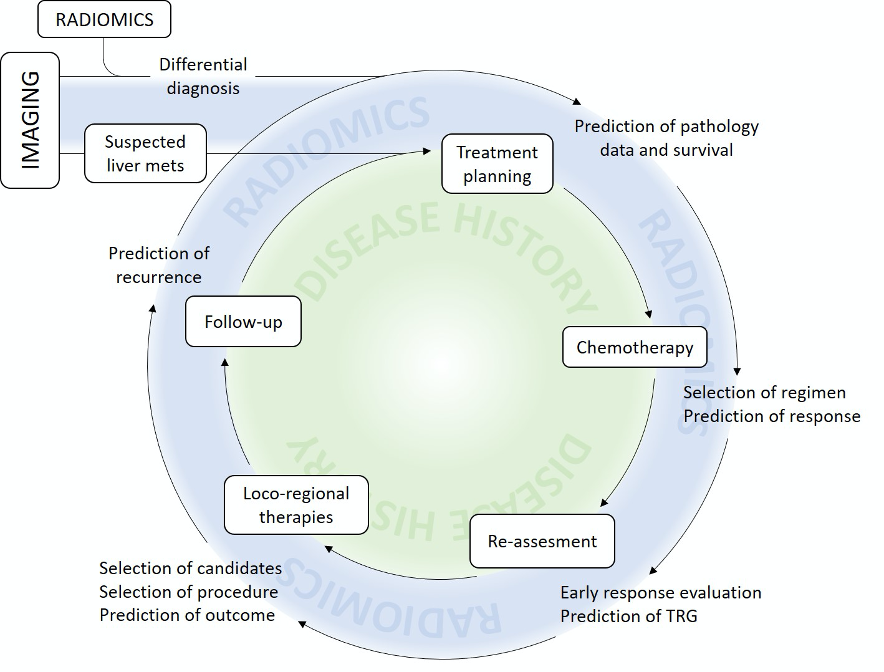
Figure 3. Present and potential future contribution of radiomics to clinical practice.
5. Influence of Technical Features on Radiomic Analyses
Some studies set off to investigate whether acquisition or reconstruction parameters could influence the values of texture analysis indices. Ahn et al. tested three different reconstruction modes of CT images, i.e., filtered back-projection, iterative reconstruction model, and hybrid iterative reconstruction. The reconstruction method affected numerous parameters, including entropy, homogeneity, skewness, kurtosis, and gray-level co-occurrence matrices [36]. Lubner et al. compared the effect of 2D and 3D reconstruction on radiomic parameters by performing a Bland–Altman analysis on a subset of 20 patients[43]. The results were similar for the two methods. Those results were confirmed by a further investigation by Ahn et al.[37]. The latter study also compared the influence of different CT scanners, ranging from 8 to 64 rows, on the radiomic parameters, without finding any significant difference. Similar results were reported in the MRI setting: Peerlings et al. used the concordance correlation coefficient to test the reproducibility of an array of first- and second-level radiomics parameters over time (multiple MRI) and different MRI systems on apparent diffusion coefficient maps, finding good stability with most parameters[58]. Conversely, two studies reported that radiomic parameters derived from CT scans are affected by slice thickness setting and ROI size[34][35]. Dercle et al. demonstrated that ROI area size, metastatic site, and the individual characteristics of image acquisitions should be considered as confounding factors in the evaluation of tumor entropy[35].
Inter-observer agreement was assessed by four studies [33,52,54,60]. Although they used different indices, such as K-statistic, intra-class correlation, and correlation index (r-value), all studies reported a substantial or excellent agreement among different readers. Finally, one study by Chatterjee et al. devised a method to reduce the rate of false discovery when analyzing radiomic parameters in small datasets[57].
References
- Massagué, J.; Obenauf, A.C. Metastatic colonization by circulating tumour cells. Nature 2016, 529, 298–306, doi:10.1038/nature17038.
- Van Cutsem, E.; Cervantes, A.; Adam, R.; Sobrero, A.; Van Krieken, J.H.; Aderka, D.; Aguilar, E.A.; Bardelli, A.; Benson, A.; Bodoky, G.; et al. ESMO consensus guidelines for the management of patients with metastatic colorectal cancer. Ann. Oncol. 2016, 27, 1386–1422, doi:10.1093/annonc/mdw235.
- Pavel, M.; Öberg, K.; Falconi, M.; Krenning, E.; Sundin, A.; Perren, A.; Berruti, A. Gastroenteropancreatic neuroendocrine neoplasms: ESMO Clinical Practice Guidelines for diagnosis, treatment and follow-up. Ann. Oncol. 2020, 31, 844–860, doi:10.1016/j.annonc.2020.03.304.
- Cardoso, F.; Senkus, E.; Costa, A.; Papadopoulos, E.; Aapro, M.; André, F.; Harbeck, N.; Lopez, B.A.; Barrios, C.; Bergh, J.; et al. 4th ESO–ESMO International Consensus Guidelines for Advanced Breast Cancer (ABC 4)dagger. Ann. Oncol. 2018, 29, 1634–1657, doi:10.1093/annonc/mdy192.
- Riihimäki, M.; Hemminki, A.; Sundquist, K.; Sundquist, J.; Hemminki, K. Metastatic spread in patients with gastric cancer. Oncotarget 2016, 7, 52307–52316, doi:10.18632/oncotarget.10740.
- Loupakis, F.; Cremolini, C.; Masi, G.; Lonardi, S.; Zagonel, V.; Salvatore, L.; Cortesi, E.; Tomasello, G.; Ronzoni, M.; Spadi, R.; et al. Initial Therapy with FOLFOXIRI and Bevacizumab for Metastatic Colorectal Cancer. N. Engl. J. Med. 2014, 371, 1609–1618, doi:10.1056/NEJMoa1403108.
- Kopetz, S.; Chang, G.J.; Overman, M.J.; Eng, C.; Sargent, D.J.; Larson, D.W.; Grothey, A.; Vauthey, J.-N.; Nagorney, D.M.; McWilliams, R.R. Improved Survival in Metastatic Colorectal Cancer Is Associated with Adoption of Hepatic Resection and Improved Chemotherapy. J. Clin. Oncol. 2009, 27, 3677–3683, doi:10.1200/JCO.2008.20.5278.
- Gruenberger, T.; Bridgewater, J.; Chau, I.; Alfonso, P.G.; Rivoire, M.; Mudan, S.; Lasserre, S.; Hermann, F.; Waterkamp, D.; Adam, R. Bevacizumab plus mFOLFOX-6 or FOLFOXIRI in patients with initially unresectable liver metastases from colorectal cancer: The OLIVIA multinational randomised phase II trial. Ann. Oncol. 2015, 26, 702–708, doi:10.1093/annonc/mdu580.
- Brudvik, K.W.; Jones, R.P.; Giuliante, F.; Shindoh, J.; Passot, G.; Chung, M.H.; Song, J.; Li, L.; Dagenborg, V.J.; Fretland, A.A.; et al. RAS Mutation Clinical Risk Score to Predict Survival after Resection of Colorectal Liver Metastases. Ann. Surg. 2019, 269, 120–126, doi:10.1097/SLA.0000000000002319.
- Viganò, L.; Russolillo, N.; Ferrero, A.; Langella, S.; Sperti, E.; Capussotti, L. Evolution of Long-Term Outcome of Liver Resection for Colorectal Metastases: Analysis of Actual 5-Year Survival Rates over Two Decades. Ann. Surg. Oncol. 2012, 19, 2035–2044, doi:10.1245/s10434-011-2186-1.
- Creasy, J.M.; Sadot, E.; Blumgart, L.H.; Jarnagin, W.R.; D’Angelica, M.I.; Koerkamp, B.G.; Chou, J.F.; Gonen, M.; Kemeny, N.E.; Balachandran, V.P.; et al. Actual 10-year survival after hepatic resection of colorectal liver metastases: What factors preclude cure? Surgery 2018, 163, 1238–1244, doi:10.1016/j.surg.2018.01.004.
- Viganò, L.; Procopio, F.; Cimino, M.; Donadon, M.; Gatti, A.; Costa, G.; Del Fabbro, D.; Torzilli, G. Is Tumor Detachment from Vascular Structures Equivalent to R0 Resection in Surgery for Colorectal Liver Metastases? An Observational Cohort. Ann. Surg. Oncol. 2016, 23, 1352–1360, doi:10.1245/s10434-015-5009-y.
- Gennaro, N.; Mauri, G.; Varano, G.M.; Monfardini, L.; Pedicini, V.; Poretti, D.; Solbiati, L.A. Thermal Ablations for Colorectal Liver Metastases. Dig. Dis. Interv. 2019, 3, 117–125, doi:10.1055/s-0039-1688724.
- Chung, C. Management of neuroendocrine tumors. Am. J. Health Syst. Pharm. 2016, 73, 1729–1744, doi:10.2146/ajhp150373.
- Scorsetti, M.; Franceschini, D.; De Rose, F.; Comito, T.; Franzese, C.; Masci, G.; Torrisi, R.; Viganò, L.; Torzilli, G. The role of SBRT in oligometastatic patients with liver metastases from breast cancer. Rep. Pr. Oncol. Radiother. 2017, 22, 163–169, doi:10.1016/j.rpor.2016.07.008.
- Andreou, A.; Viganò, L.; Zimmitti, G.; Seehofer, D.; Dreyer, M.; Pascher, A.; Bahra, M.; Schoening, W.; Schmitz, V.; Thuss-Patience, P.C.; et al. Response to Preoperative Chemotherapy Predicts Survival in Patients Undergoing Hepatectomy for Liver Metastases from Gastric and Esophageal Cancer. J. Gastrointest. Surg. 2014, 18, 1974–1986, doi:10.1007/s11605-014-2623-0.
- Adam, R.; Pascal, G.; Castaing, D.; Azoulay, D.; Delvart, V.; Paule, B.; Levi, F.; Bismuth, H. Tumor Progression while on Chemotherapy: A contraindication to liver resection for multiple colorectal metastases? Ann. Surg. 2004, 240, 1052–1064; discussion 1061–1054, doi:10.1097/01.sla.0000145964.08365.01.
- Viganò, L.; Capussotti, L.; Barroso, E.; Nuzzo, G.; Laurent, C.; Ijzermans, J.N.M.; Gigot, J.-F.; Figueras, J.; Gruenberger, T.; Mirza, D.F.; et al. Progression while Receiving Preoperative Chemotherapy Should Not Be an Absolute Contraindication to Liver Resection for Colorectal Metastases. Ann. Surg. Oncol. 2012, 19, 2786–2796, doi:10.1245/s10434-012-2382-7.
- Brouquet, A.; Blot, C.; Allard, M.A.; Lazure, T.; Sebbagh, M.; Gayet, M.; Lewin, M.; Adam, R.; Penna, C.; Sa Cunha, A.; et al. What is the Prognostic Value of a Discordant Radiologic and Pathologic Response in Patients Undergoing Resection of Colorectal Liver Metastases after Preoperative Chemotherapy? Ann. Surg. Oncol. 2020, doi:10.1245/s10434-020-08284-1.
- Viganò, L.; Capussotti, L.; De Rosa, G.; De Saussure, W.O.; Mentha, G.; Rubbia-Brandt, L. Liver Resection for Colorectal Metastases after Chemotherapy: Impact of chemotherapy-related liver injuries, pathological tumor response, and micrometastases on long-term survival. Ann. Surg. 2013, 258, 731–740; discussion 741–732, doi:10.1097/SLA.0b013e3182a6183e.
- Viganò, L.; Darwish, S.S.; Rimassa, L.; Cimino, M.; Carnaghi, C.; Donadon, M.; Procopio, F.; Personeni, N.; Del Fabbro, D.; Santoro, A.; et al. Progression of Colorectal Liver Metastases from the End of Chemotherapy to Resection: A New Contraindication to Surgery? Ann. Surg. Oncol. 2018, 25, 1676–1685, doi:10.1245/s10434-018-6387-8.
- Sayagués, J.M.; Corchete, L.A.; Gutiérrez, M.L.; Sarasquete, M.E.; Abad, M.D.M.; Bengoechea, O.; Fermiñán, E.; Anduaga, M.F.; Del Carmen, S.; Iglesias, M.; et al. Genomic characterization of liver metastases from colorectal cancer patients. Oncotarget 2016, 7, 72908–72922, doi:10.18632/oncotarget.12140.
- Brudvik, K.W.; Kopetz, S.; Li, L.; Conrad, C.; Aloia, T.A.; Vauthey, J.-N. Meta-analysis of KRAS mutations and survival after resection of colorectal liver metastases. Br. J. Surg. 2015, 102, 1175–1183, doi:10.1002/bjs.9870.
- Gillies, R.J.; Kinahan, P.E.; Hricak, H. Radiomics: Images Are More than Pictures, They Are Data. Radiology 2016, 278, 563–577, doi:10.1148/radiol.2015151169.
- Lambin, P.; Rios-Velazquez, E.; Leijenaar, R.; Carvalho, S.; Van Stiphout, R.G.P.M.; Granton, P.; Zegers, C.M.L.; Gillies, R.; Boellard, R.; Dekker, A.; et al. Radiomics: Extracting more information from medical images using advanced feature analysis. Eur. J. Cancer 2012, 48, 441–446, doi:10.1016/j.ejca.2011.11.036.
- Sollini, M.; Antunovic, L.; Chiti, A.; Kirienko, M. Towards clinical application of image mining: A systematic review on artificial intelligence and radiomics. Eur. J. Nucl. Med. Mol. Imaging 2019, 46, 2656–2672, doi:10.1007/s00259-019-04372-x.
- Zwanenburg, A.; Vallières, M.; Abdalah, M.A.; Aerts, H.J.W.L.; Andrearczyk, V.; Apte, A.; Ashrafinia, S.; Bakas, S.; Beukinga, R.J.; Boellaard, R.; et al. The Image Biomarker Standardization Initiative: Standardized Quantitative Radiomics for High-Throughput Image-based Phenotyping. Radiology 2020, 295, 328–338, doi:10.1148/radiol.2020191145.
- Sollini, M.; Cozzi, L.; Antunovic, L.; Chiti, A.; Kirienko, M. PET Radiomics in NSCLC: State of the art and a proposal for harmonization of methodology. Sci. Rep. 2017, 7, 358, doi:10.1038/s41598-017-00426-y.
- Thawani, R.; McLane, M.; Beig, N.; Ghose, S.; Prasanna, P.; Velcheti, V.; Madabhushi, A. Radiomics and radiogenomics in lung cancer: A review for the clinician. Lung Cancer 2018, 115, 34–41, doi:10.1016/j.lungcan.2017.10.015.
- Wakabayashi, T.; Ouhmich, F.; Gonzalez-Cabrera, C.; Felli, E.; Saviano, A.; Agnus, V.; Savadjiev, P.; Baumert, T.F.; Pessaux, P.; Marescaux, J.; et al. Radiomics in hepatocellular carcinoma: A quantitative review. Hepatol. Int. 2019, 13, 546–559, doi:10.1007/s12072-019-09973-0.
- Cozzi, L.; Dinapoli, N.; Fogliata, A.; Hsu, W.-C.; Reggiori, G.; Lobefalo, F.; Kirienko, M.; Sollini, M.; Franceschini, D.; Comito, T.; et al. Radiomics based analysis to predict local control and survival in hepatocellular carcinoma patients treated with volumetric modulated arc therapy. BMC Cancer 2017, 17, 829, doi:10.1186/s12885-017-3847-7.
- Andersen, I.R.; Thorup, K.; Andersen, M.B.; Olesen, R.; Mortensen, F.V.; Nielsen, D.T.; Rasmussen, F. Texture in the monitoring of regorafenib therapy in patients with colorectal liver metastases. Acta Radiol. 2019, 60, 1084–1093, doi:10.1177/0284185118817940.
- Dohan, A.; Gallix, B.; Guiu, B.; Le Malicot, K.; Reinhold, C.; Soyer, P.; Bennouna, J.; Ghiringhelli, F.; Barbier, E.; Boige, V.; et al. Early evaluation using a radiomic signature of unresectable hepatic metastases to predict outcome in patients with colorectal cancer treated with FOLFIRI and bevacizumab. Gut 2020, 69, 531–539, doi:10.1136/gutjnl-2018-316407.
- Meyer, M.; Ronald, J.; Vernuccio, F.; Nelson, R.C.; Ramirez-Giraldo, J.C.; Solomon, J.; Patel, B.N.; Samei, E.; Marin, D. Reproducibility of CT Radiomic Features within the Same Patient: Influence of Radiation Dose and CT Reconstruction Settings. Radiology 2019, 293, 583–591, doi:10.1148/radiol.2019190928.
- Dercle, L.; Ammari, S.; Bateson, M.; Durand, P.B.; Haspinger, E.; Massard, C.; Jaudet, C.; Varga, A.; Deutsch, E.; Soria, J.-C.; et al. Limits of radiomic-based entropy as a surrogate of tumor heterogeneity: ROI-area, acquisition protocol and tissue site exert substantial influence. Sci. Rep. 2017, 7, 7952, doi:10.1038/s41598-017-08310-5.
- Ahn, S.J.; Kim, J.H.; Lee, S.M.; Park, S.J.; Han, J.K. CT reconstruction algorithms affect histogram and texture analysis: Evidence for liver parenchyma, focal solid liver lesions, and renal cysts. Eur. Radiol. 2019, 29, 4008–4015, doi:10.1007/s00330-018-5829-9.
- Ahn, S.J.; Kim, J.H.; Park, S.J.; Han, J.K. Prediction of the therapeutic response after FOLFOX and FOLFIRI treatment for patients with liver metastasis from colorectal cancer using computerized CT texture analysis. Eur. J. Radiol. 2016, 85, 1867–1874, doi:10.1016/j.ejrad.2016.08.014.
- Beckers, R.; Trebeschi, S.; Maas, M.; Schnerr, R.; Sijmons, J.; Beets, G.; Houwers, J.; Beets-Tan, R.; Lambregts, D.M.J. CT texture analysis in colorectal liver metastases and the surrounding liver parenchyma and its potential as an imaging biomarker of disease aggressiveness, response and survival. Eur. J. Radiol. 2018, 102, 15–21, doi:10.1016/j.ejrad.2018.02.031.
- Cheng, J.; Wei, J.; Tong, T.; Sheng, W.; Zhang, Y.; Han, Y.; Gu, D.; Hong, N.; Ye, Y.; Tian, J.; et al. Prediction of Histopathologic Growth Patterns of Colorectal Liver Metastases with a Noninvasive Imaging Method. Ann. Surg. Oncol. 2019, 26, 4587–4598, doi:10.1245/s10434-019-07910-x.
- Dercle, L.; Lu, L.; Schwartz, L.H.; Qian, M.; Tejpar, S.; Eggleton, P.; Zhao, B.; Piessevaux, H. Radiomics Response Signature for Identification of Metastatic Colorectal Cancer Sensitive to Therapies Targeting EGFR Pathway. J. Natl. Cancer Inst. 2020, doi:10.1093/jnci/djaa017.
- Klaassen, R.; LaRue, R.T.H.M.; Mearadji, B.; Van Der Woude, S.O.; Stoker, J.; Lambin, P.; Van Laarhoven, H.W.M. Feasibility of CT radiomics to predict treatment response of individual liver metastases in esophagogastric cancer patients. PLoS ONE 2018, 13, e0207362, doi:10.1371/journal.pone.0207362.
- Li, Y.; Eresen, A.; Shangguan, J.; Yang, J.; Lu, Y.; Chen, D.; Wang, J.; Velichko, Y.; Yaghmai, V.; Zhang, Z. Establishment of a new non-invasive imaging prediction model for liver metastasis in colon cancer. Am J Cancer Res 2019, 9, 2482–2492.
- Lubner, M.G.; Stabo, N.; Lubner, S.J.; Del Rio, A.M.; Song, C.; Halberg, R.B.; Pickhardt, P.J. CT textural analysis of hepatic metastatic colorectal cancer: Pre-treatment tumor heterogeneity correlates with pathology and clinical outcomes. Abdom. Imaging 2015, 40, 2331–2337, doi:10.1007/s00261-015-0438-4.
- Martini, I.; Polici, M.; Zerunian, M.; Panzuto, F.; Rinzivillo, M.; Landolfi, F.; Magi, L.; Caruso, D.; Eid, M.; Annibale, B.; et al. CT texture analysis of liver metastases in PNETs versus NPNETs: Correlation with histopathological findings. Eur. J. Radiol. 2020, 124, 108812, doi:10.1016/j.ejrad.2020.108812.
- Rao, S.-X.; Lambregts, D.M.J.; Schnerr, R.S.; Beckers, R.C.; Maas, M.; Albarello, F.; Riedl, R.G.; DeJong, C.H.; Martens, M.H.; Heijnen, L.A.; et al. CT texture analysis in colorectal liver metastases: A better way than size and volume measurements to assess response to chemotherapy? United Eur. Gastroenterol. J. 2016, 4, 257–263, doi:10.1177/2050640615601603.
- Ravanelli, M.; Agazzi, G.M.; Tononcelli, E.; Roca, E.; Cabassa, P.; Baiocchi, G.; Berruti, A.; Maroldi, R.; Farina, D. Texture features of colorectal liver metastases on pretreatment contrast-enhanced CT may predict response and prognosis in patients treated with bevacizumab-containing chemotherapy: A pilot study including comparison with standard chemotherapy. La Radiol. Med. 2019, 124, 877–886, doi:10.1007/s11547-019-01046-4.
- Simpson, A.L.; Doussot, A.; Creasy, J.M.; Adams, L.B.; Allen, P.J.; DeMatteo, R.P.; Gönen, M.; Kemeny, N.E.; Kingham, T.P.; Shia, J.; et al. Computed Tomography Image Texture: A Noninvasive Prognostic Marker of Hepatic Recurrence After Hepatectomy for Metastatic Colorectal Cancer. Ann. Surg. Oncol. 2017, 24, 2482–2490, doi:10.1245/s10434-017-5896-1.
- Song, S.; Li, Z.; Niu, L.; Zhou, X.; Wang, G.; Gao, Y.; Wang, J.; Liu, F.; Sui, Q.; Jiao, L.; et al. Hypervascular hepatic focal lesions on dynamic contrast-enhanced CT: Preliminary data from arterial phase scans texture analysis for classification. Clin. Radiol. 2019, 74, 653.e11–653.e18, doi:10.1016/j.crad.2019.05.010.
- Trebeschi, S.; Drago, S.; Birkbak, N.; Kurilova, I.; Cǎlin, A.; Pizzi, A.D.; Lalezari, F.; Lambregts, D.; Rohaan, M.; Parmar, C.; et al. Predicting response to cancer immunotherapy using noninvasive radiomic biomarkers. Ann. Oncol. 2019, 30, 998–1004, doi:10.1093/annonc/mdz108.
- Velichko, Y.S.; Mozafarykhamseh, A.; Trabzonlu, T.A.; Zhang, Z.; Rademaker, A.W.; Yaghmai, V. Association Between the Size and 3D CT-Based Radiomic Features of Breast Cancer Hepatic Metastasis. Acad. Radiol. 2020, doi:10.1016/j.acra.2020.03.004.
- Gatos, I.; Tsantis, S.; Karamesini, M.; Spiliopoulos, S.; Karnabatidis, D.; Hazle, J.D.; Kagadis, G.C. Focal liver lesions segmentation and classification in nonenhanced T2-weighted MRI. Med. Phys. 2017, 44, 3695–3705, doi:10.1002/mp.12291.
- Jansen, M.J.A.; Kuijf, H.J.; Veldhuis, W.B.; Wessels, F.J.; Viergever, M.A.; Pluim, J.P.W. Automatic classification of focal liver lesions based on MRI and risk factors. PLoS ONE 2019, 14, e0217053, doi:10.1371/journal.pone.0217053.
- Li, Z.; Mao, Y.; Huang, W.; Li, H.; Zhu, J.; Li, W.; Li, B. Texture-based classification of different single liver lesion based on SPAIR T2W MRI images. BMC Med. Imaging 2017, 17, 42, doi:10.1186/s12880-017-0212-x.
- Liang, H.-Y.; Huang, Y.-Q.; Yang, Z.-X.; Ding, Y.-; Zeng, M.-S.; Rao, S.-X. Potential of MR histogram analyses for prediction of response to chemotherapy in patients with colorectal hepatic metastases. Eur. Radiol. 2016, 26, 2009–2018, doi:10.1007/s00330-015-4043-2.
- Reimer, R.P.; Reimer, P.; Mahnken, A.H. Assessment of Therapy Response to Transarterial Radioembolization for Liver Metastases by Means of Post-treatment MRI-Based Texture Analysis. Cardiovasc. Interv. Radiol. 2018, 41, 1545–1556, doi:10.1007/s00270-018-2004-2.
- Zhang, H.; Li, W.; Hu, F.; Sun, Y.; Hu, T.; Tong, T. MR texture analysis: Potential imaging biomarker for predicting the chemotherapeutic response of patients with colorectal liver metastases. Abdom. Radiol. 2019, 44, 65–71, doi:10.1007/s00261-018-1682-1.
- Chatterjee, A.; Vallieres, M.; Dohan, A.; Levesque, I.R.; Ueno, Y.; Bist, V.; Saif, S.; Reinhold, C.; Seuntjens, J. An Empirical Approach for Avoiding False Discoveries When Applying High-Dimensional Radiomics to Small Datasets. IEEE Trans. Radiat. Plasma Med. Sci. 2018, 3, 201–209, doi:10.1109/TRPMS.2018.2880617.
- Peerlings, J.; Woodruff, H.C.; Winfield, J.M.; Ibrahim, A.; Van Beers, B.E.; Heerschap, A.; Jackson, A.; Wildberger, J.E.; Mottaghy, F.M.; DeSouza, N.M.; et al. Stability of radiomics features in apparent diffusion coefficient maps from a multi-centre test-retest trial. Sci. Rep. 2019, 9, 4800, doi:10.1038/s41598-019-41344-5.
- Rahmim, A.; Bak-Fredslund, K.P.; Ashrafinia, S.; Lu, L.; Schmidtlein, C.R.; Subramaniam, R.M.; Morsing, A.; Keiding, S.; Horsager, J.; Munk, O.L. Prognostic modeling for patients with colorectal liver metastases incorporating FDG PET radiomic features. Eur. J. Radiol. 2019, 113, 101–109, doi:10.1016/j.ejrad.2019.02.006.
- Wagner, F.; Hakami, Y.A.; Warnock, G.; Fischer, G.; Veit-Haibach, P.; Huellner, M. Comparison of Contrast-Enhanced CT and [(18)F]FDG PET/CT Analysis Using Kurtosis and Skewness in Patients with Primary Colorectal Cancer. Mol. Imaging Biol. 2017, 19, 795–803, doi:10.1007/s11307-017-1066-x.
- Van Helden, E.J.; Vacher, Y.J.L.; Van Wieringen, W.N.; Van Velden, F.H.P.; Verheul, H.M.W.; Hoekstra, O.S.; Boellaard, R.; Oordt, C.W.M.-V.D.H.V. Radiomics analysis of pre-treatment [(18)F]FDG PET/CT for patients with metastatic colorectal cancer undergoing palliative systemic treatment. Eur. J. Nucl. Med. Mol. Imaging 2018, 45, 2307–2317, doi:10.1007/s00259-018-4100-6.
- Shur, J.; Orton, M.; Connor, A.; Fischer, S.; Moulton, C.; Gallinger, S.; Koh, D.; Jhaveri, K.S. A clinical‐radiomic model for improved prognostication of surgical candidates with colorectal liver metastases. J. Surg. Oncol. 2019, 121, 357–364, doi:10.1002/jso.25783.
- Weber, M.; Kessler, L.; Schaarschmidt, B.; Fendler, W.P.; Lahner, H.; Antoch, G.; Umutlu, L.; Herrmann, K.; Rischpler, C. Textural analysis of hybrid DOTATOC-PET/MRI and its association with histological grading in patients with liver metastases from neuroendocrine tumors. Nucl. Med. Commun. 2020, 41, 363–369, doi:10.1097/MNM.0000000000001150.
- Lambin, P.; Leijenaar, R.T.; Deist, T.M.; Peerlings, J.; De Jong, E.E.; Van Timmeren, J.; Sanduleanu, S.; LaRue, R.T.H.M.; Even, A.J.; Jochems, A.; et al. Radiomics: The bridge between medical imaging and personalized medicine. Nat. Rev. Clin. Oncol. 2017, 14, 749–762, doi:10.1038/nrclinonc.2017.141.
- Park, J.E.; Kim, D.; Kim, H.S.; Park, S.Y.; Kim, J.Y.; Cho, S.J.; Shin, J.H.; Kim, J.H. Quality of science and reporting of radiomics in oncologic studies: Room for improvement according to radiomics quality score and TRIPOD statement. Eur. Radiol. 2020, 30, 523–536, doi:10.1007/s00330-019-06360-z.
- Whiting, P.; Rutjes, A.W.; Westwood, M.E.; Mallett, S.; Deeks, J.J.; Reitsma, J.B.; Leeflang, M.M.; Sterne, J.A.; Bossuyt, P. QUADAS-2: A Revised Tool for the Quality Assessment of Diagnostic Accuracy Studies. Ann. Intern. Med. 2011, 155, 529–536, doi:10.7326/0003-4819-155-8-201110180-00009.