
Gold- and silver nanoparticles (Au NPs and Ag NPs)-based colorimetric detection of specific analytes has attracted intense research interest and is still in great demand. The majority of Au NPs- and Ag NPs-based sensory reports have revealed that, during the analyte recognition, dispersed NPs typically aggregated and displayed color changes from wine-red to blue/purple and yellow to orange/brown, respectively. On the other hand, only a few reports demonstrated that the aggregated Au NPs and Ag NPs underwent anti-aggregation in the presence of certain analytes, which displayed reversed color changes from blue/purple to wine-red and orange/brown to yellow, correspondingly. There are some examples of anti-aggregation phenomena mentioned in a vast number of studies on Au NPs- and Ag NPs-based colorimetric sensors via NP aggregation. However, a review targeting the anti-aggregation-enabled Au NPs- and Ag NPs-based colorimetric sensing of diverse analytes is not yet available. In this review, anti-aggregation-facilitated Au NPs- and Ag NPs-based colorimetric detection of metal ions, anions, bio-analytes, pesticides, and herbicides is delivered with detailed underlying mechanisms. Moreover, the probe design, sensory requirement, merits, limitations, and future scope of anti-aggregation-enabled Au NPs- and Ag NPs-based colorimetric sensors are discussed.
- ion detection
- aggregation
- anti-aggregation
- Au NPs
- Ag NPs
- colorimetric recognition
- real analysis
- biosensors
- pesticides
- herbicides
1. Introduction
In this rentryview, utilization of the anti-aggregation strategy in the Au NPs/Ag NPs-based colorimetric detection of metal ions, anions, bio-analytes, pesticides, and herbicides is illustrated with mechanistic and binding details. Uniqueness of its design, linear range, limit of detection (LOD), and real-time applicability are discussed with future scopes. The schematic shown in Figure 1 illustrates the anti-aggregation strategy applied in Au NPs/Ag NPs-based colorimetric sensors toward metal ions, anions, bio-analytes, pesticides, and herbicides.
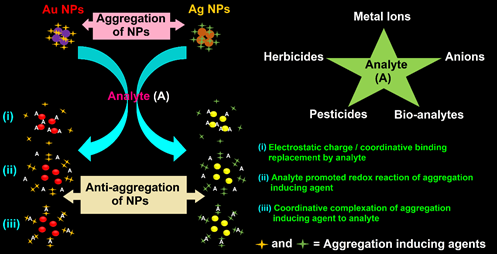
Figure 1.
Schematic of the anti-aggregation strategy applied in Au NPs/Ag NPs-based colorimetric sensors toward metal ions, anions, bio-analytes, pesticides, and herbicides.
2. Au NPs-Based Colorimetric Assay of Metal Ions via Anti-Aggregation
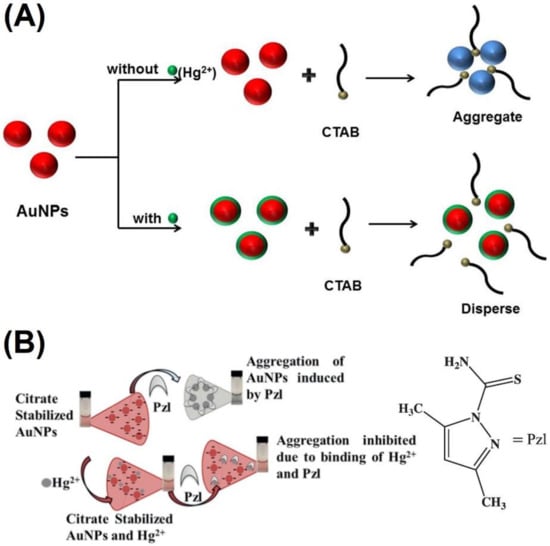
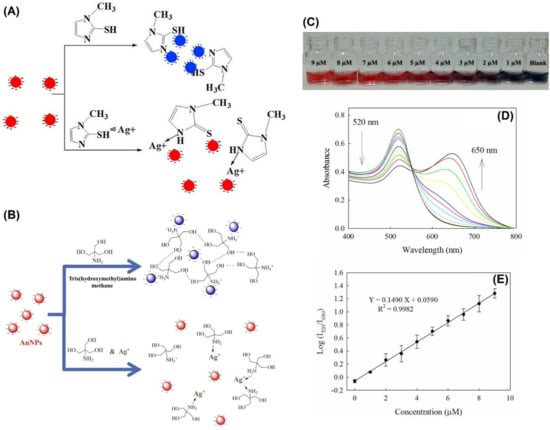
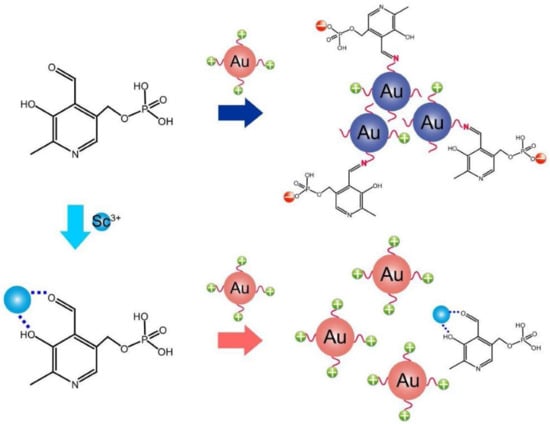
3. Au NPs-Based Colorimetric Quantification of Anions via Anti-Aggregation
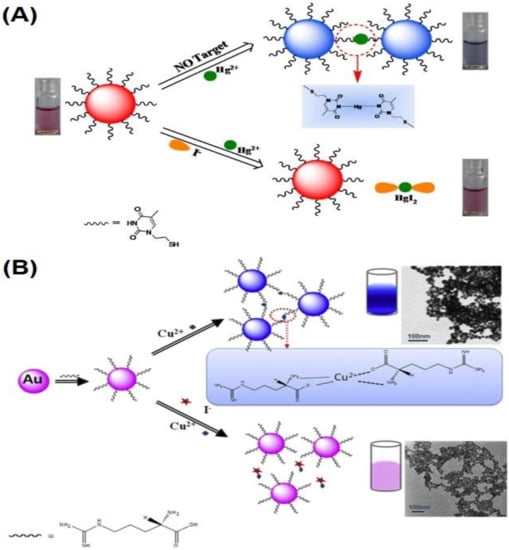
4. Au NPs-Based Colorimetric Quantification of Bio-Analytes via Anti-Aggregation
Au NPs-based colorimetric assays of biothiols, such as glutothione (GSH), cysteine (Cys), and homo-cysteine (HCys), via anti-aggregation were described by employing 4-(2-mercaptoethylamino)-1,8-naphthalimide–capped Au NPs (particle size = 10–20 nm; conc. = 5 nM) in the presence of Hg2+ (4.5 µM; aggregation-inducing agent) [76]. At an optimized concentration of capping agent “4-(2-mercaptoethylamino)-1,8-naphthalimide (9 µM)”, Au NPs aggregated in the presence of Hg2+ through the T-Hg2+-T complex (T exist in the naphthalimide unit) with a color change from red to blue. Above aggregation was hindered by pre-mixing GSH, Cys, and HCys with Hg2+ at an optimum pH 7.4 (buffer: 50 mM PBS) and 20 min incubation to induce anti-aggregation of Au NPs (due to strong biothiols-Hg2+ complex via Hg-S bond) and a color change from blue to red. TEM, SPR, and interference interrogations clarified the occurrence of anti-aggregation and high selectivity. The linear ranges of GSH, Cys, and HCys were between 0.025 and 2.28 µM (at A528/A615), 0.035 and 1.53 µM (at A528/A615), and 0.040 and 2.20 µM (at A528/A615), with LODs of 17 nM, 9 nM, and 18 nM, respectively. Spiked human urine studies established recoveries of >93% with an RSD of <5.5%; thus, it can be regarded as an excellent innovation.
Li et al. adopted the “S-adenosyl-L-methionine (SAM; 0.8 µM) as an aggregation-inducing agent with CI-Au NPs (particle size = 10–20 nm; conc. = 3.5 nM) toward the quantification of biothiols (GSH, Cys and HCys) [77]. Firstly, adding SAM neutralized the potential of dispersed Au NPs and resulted in the aggregation with a color change from red to blue. Pre-treating biothiols with SAM disturbed the aggregation by SAM from the NPs’ surface via strong Au-S binding, thereby changing the color from blue to red. The optimum pH and incubation time were fixed as pH 7 (buffer: 10 mM borate buffered saline (BBS) made up from sodium borate and NaCl) and 5 min. TEM and SPR investigations attested to the anti-aggregation induced by biothiols. The linear regressions of GSH, Cys, and HCys were between 0.2 and 0.9 µM (at A520/A650), 0.4 and 1.2 µM (at A520/A650), and 0.6 and 3.0 µM (at A520/A650), with LODs of 35.8 nM, 21.7 nM, and 62.4 nM, correspondingly. This tactic shows high selectivity over a wide range of interferences, as seen in Figure 12, with recoveries in biological fluids of 96.5% to 104.4%; hence, it can be employed for real-time biothiols assay.
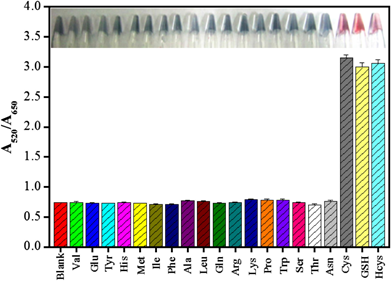
Figure 12. Absorbance ratio A520/A650 of solutions containing 3.5 nM of Au NPs, 0.8 mM of SAM, and 2 mM of different compounds and the target biothiols. The inset shows the corresponding photographic images of Au NPs (reproduced with the permission from [77]).
Zhong et al., 2010 and Wu et al, 2017 research groups demonstrated the anti-aggregation-enabled colorimetric assay of GSH using CI-Au NPs (particle size = 13 nm; conc. = 5/2.5 nM) with sodium piperazinebisdithiocarbamate (ppzdtc; 1.5 µM), cysteine (Cys; 4 µM), and 2-Mercapto-1-methylimidazole (MMI; 2 µM) as aggregation-inducing agents [78–80]. Initially, the aggregation-inducing agents functionalized on the surface of NPs reduced the electrostatic repulsion between NPs, which resulted in aggregation with a color change from red to blue. Pre-mixing of ppzdtc, Cys, and MMI with GSH led to anti-aggregation of Au NPs via a strong Au-S bond and kept the nanoparticles well-dispersed. When ppzdtc was used [78], the best pH value and incubation time were established as pH 7.4 (buffer: 10 mM HEPES (4-(2-hydroxyethyl)-1-piperazineethanesulfonic acid)) and 30 min. In contrast, in the presence of Cys and MMI [79,80], the pH and incubation time for GSH assay were determined as pH 5.8 (buffer: PBS) and 5 min. TEM, DLS, and SPR analysis confirmed the anti-aggregation strategy in these reports. Figure 13A–D illustrate the proposed mechanism and changes in TEM in the presence of MMI and GSH [80]. The linear ranges of GSH were between 8 and 250 nM (at A520/A640), 0.1 and 1 µM (at A650/A520), and 0.1 and 1 µM (at A520/A640), with estimated LODs of 8 nM, 20.3 nM, and 12 nM, respectively. These three reports demonstrated the high selectivity of GSH over a wide range of interferences. In particular, the assay of GSH displayed high responses in the presence of Cys and H-Cys. From human serum and human urine investigations, recoveries of >90% were witnessed in Wu’s reports [79,80]. Based on the obtained results, these Au NPs probes/tactics can be applied for GSH assay in real samples.
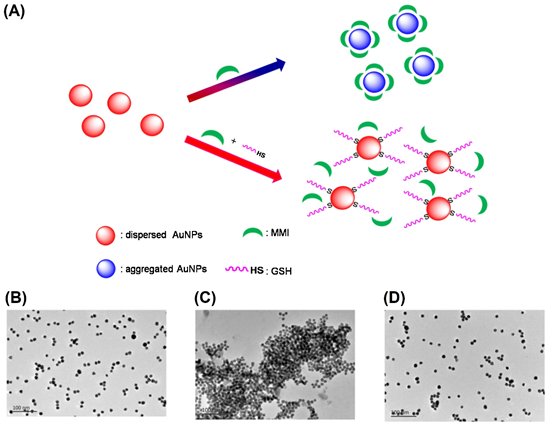
Figure 13. (A) Schematic representation of GSH-induced anti-aggregation of Au NPs with the use of MMI (MMI = 2-Mercapto-1-methylimidazole) as the aggregation agent and (B) TEM images of Au NPs only (C) in the presence of 2.0 µM MMI and (D) in the presence of 2.0 µM MMI and 1.0 µM GSH ((A–D) are reproduced with the permission from [80]).
In the anti-aggregation-enabled colorimetric assay of D-aminoacids (DAAs; D-alanine (D-Ala)), the CI-Au NPs (particle size = 13 nm; conc. = 10 nM) and 4-mercaptobenzoic acid (4-MBA; 5.2 µM) with CuCl2 (400 µM) were adopted as the probe and aggregation-inducing agent [81]. Both 4-MBA and Cu2+ induced aggregation of Au NPs with a color change from red to royal purple. In the presence of D-amino acid oxidase (DAAO), the DAAs were oxidized to produce hydrogen peroxide (H2O2), which took part in the oxidization of 4-MBA and formed the disulfide (-S-S-) bond. This process resulted in the anti-aggregation of Au NPs and a color change from royal purple to red. The best result was obtained at pH 7 (buffer: HAc-NaAc) after 15 min incubation. Being one of the D-aminoacids sources, the D-Ala was engaged in this study to demonstrate its selectivity in the presence of other interferences, such as vitamin C, glucose, Ca2+, Mg2+, Na+, glycine (Gly), L-glutamic acid (L-Glu), L-alanine (L-Ala), and L-arginine (L-Arg). Colorimetric photographs and TEM and SPR studies confirmed the anti-aggregation by D-Ala. The linear range was between 0.15 and 30 µM (at A700/A520), with an LOD of 75 nM. This work was also demonstrated in real biological samples recovery (>98%). However, it still requires extra work to simplify the complicated procedure and to try out many distinct D-aminoacids.
Huang et al. discussed the anti-aggregation-facilitated colorimetric discrimination of methionine (Met) using CI-Au NPs (particle size = 13 nm; conc. = 15 nM) and melamine (Mel; 1.3 µM) as the aggregation-inducing agent [82]. Due to the strong Au-N binding, Mel induced aggregation of the NPs with a color change from red to blue. When Met was added, the above system was disrupted by means of strong Au-N and Au-S binding between Met to Au NPs (contrary to the Au-N bond in Mel-Au NPs), thereby enabling anti-aggregation to produce a colorimetric response from blue to red. The best colorimetric response was attained at pH 7.4 (buffer: PBS) after 5 min incubation. TEM, DLS, and SPR results attested to the anti-aggregation-enhanced colorimetric response. Note that none of the competing species showed interference. The NaCl at 20 mM in particular showed negligible effect on sensing. As explored in Figure 14A,B, the relative intensity of the two resonances in the SPR spectra of Mel-Au NPs system decreased linearly from 0 to 1 µM (at A650/A520), with an LOD of 24.5 nM. Human serum and human urine samples interrogations revealed recoveries on Met detection of between 5.0 and 105% and 95.0 and 104%, with an RSD of <5%. This is a unique work toward the colorimetric quantification of methionine and can be used for real-time quantification.
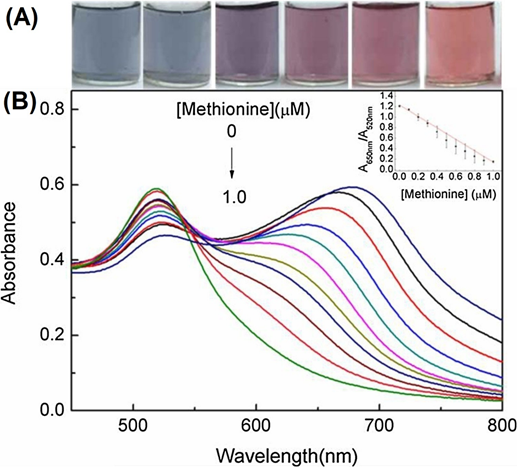
Figure 14. (A) Photographic images of the Mel-Au NPs formed in the presence of different concentrations of Met (0, 0.2, 0.4, 0.6, 0.8, and 1.0 µM); (B) UV–vis absorption spectra of the Mel-Au NPs generated in the presence of different concentrations of Met (0, 0.1, 0.2, 0.3, 0.4, 0.5, 0.6, 0.7, 0.8, 0.9, and 1.0 µM); inset shows plot of A650nm/A520nm against the Met concentrations ((A,B) are reproduced with the permission from [82]).
Keshvari and co-workers proposed the anti-aggregation-enabled colorimetric detection of fructose using CI-Au NPs (particle size = 13 nm) and 4-mercapto-phenyl boronic acid (MPBA; 1.34 µM) as the aggregation-inducing agent [83]. Due to the strong binding between the mercapto (-SH) unit and the Au atom, the aggregation occurred with a color change from ruby red to blue. When fructose was added, a borate ester was formed via a boronic acid-diol binding because of the reaction between boronic acid and cis-2,3-ribose diol (present in fructose), thereby inducing anti-aggregation of the NPs with a corresponding color change from blue to wine-red. The above reaction was dependent upon the pH values, and the optimum value for the reaction to proceed was found to be pH 7. For collecting all colorimetric data, 10 min incubation was chosen. TEM and SPR analysis well proved the existence of anti-aggregation, and competing studies with many sugar carbohydrates (fructose, galactose, mannose, lactose, saccharose, and glucose, respectively) also confirmed its high selectivity. The linearity of fructose was between 32 and 960 μM (at A519/A640), with an LOD of 10 µM. The spiked human plasma investigation revealed recoveries of nearly 100%. However, this work requires more experimental data, including other interferences (such as uric acid, ascorbic acid, aminoacids, etc.), DLS, exact pH buffer used, NaCl effect, and real samples investigations. To this track, an anti-aggregation-enabled glucose sensor through localized surface plasmon resonance (LSPR) response on fiber optics was reported using amine@POSS-aminophenylboronic acid (APBA) immobilized on Au NPs’ surface with the support of polyoligomeric silsesquioxane (POSS) [84], wherein a borate–glucose complex was responsible for the distinct LSPR responses. Though this work detects the glucose with an LOD of 25 µM, it lack colorimetric responses for in depth discussion.
Liu et al. demonstrated the boronic acid–diol binding for a selective colorimetric assay of dihydro-nicotinamide adenine dinucleotide (NADH) [85] in which the CI-Au NPs (particle size = 13 nm; conc. = 3 nM) aggregated in the presence of MPBA (10 µM) via a strong Au-S binding to produce a color change from red to blue. By adding NADH, the cis-2,3-ribose diol containing sugar units in NADH reacts with boronic acid and induces anti-aggregation with a corresponding color change from blue to red, as seen in Figure 15. To optimize the above pH dependent reaction, a pH value of 10.5 (buffer: 18 mM NaOH from 0.2 M stock) was chosen at a fixed incubation time of 12 min. TEM and SPR studies well attested the anti-aggregation strategy. The linear range of NADH was between 0.008 and 8 µM (at A520/A630), with an LOD of 2 nM. This report is innovative, but it still requires further work in real applications.
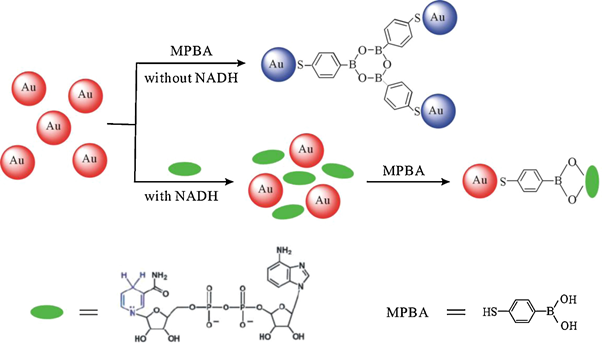
Figure 15. Schematic for colorimetric detection of NADH based on anti-aggregation of Au NPs (reproduced with the permission from [85]).
Sang and co-workers reported anti-aggregation of Au NPs with the support of the aptamer hairpin probe (AHP; 1.5 nM) for colorimetric recognition of adenosine tri-phosphate (ATP) by engaging PDDA (0.5 µM) as the aggregation-inducing agent [86]. In the absence of ATP, PDDA induced aggregation of CI-Au NPs (particle size = 13 nm) due to the strong electrostatic interactions and produced a color change from red to blue. In the presence of ATP, the AHP opened up to expose the flexible single-stranded DNA (ssDNA) to interact with PDDA, which prevented PDDA from inducing Au NPs aggregation and led to a reversed colorimetric response (a color change from blue to red). The optimum incubation time for the experiments was established as 5 min. TEM, DLS, and SPR confirmed the anti-aggregation and colorimetric response to ATP. As shown in Figure 16A,B, ATP shows the SPR linearity as being between 20 and 100 nM (at A610/A520), with an LOD of 1.7 nM. The spiked human serum investigations showed the recoveries of >100%, with an RSD of <3%. Based on the results, this work can be regarded as exceptional for colorimetric assay of ATP. However, the selectivity must be justified by including more competing species.
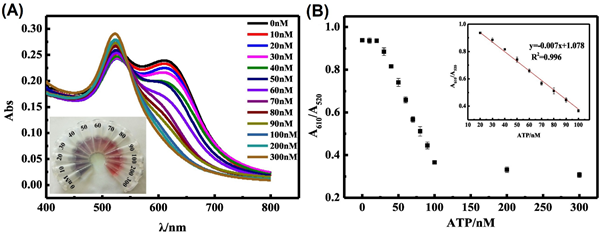
Figure 16. (A) UV–vis absorption spectra of the colorimetric assay with various concentrations of ATP (inset: the corresponding photographs of the solutions); (B) plot of the absorbance ratio (A610/A520) vs. ATP concentration in the range of 0 to 300 nM. The inset illustrates the linear calibration plot of A610/A520 vs. the ATP concentration (20 to 100 nM). Error bars were obtained from three experiments ((A,B) are reproduced with the permission from [86]).
Zhang et al. discussed the anti-aggregation-enabled colorimetric assay of Y-shaped target DNA (T-DNA) by employing CI-Au NPs (particle size = 30–70 nm) and NaCl (30 mM) as the aggregation-inducing agent [87]. In fact, the non-relevant DNA (in the presence of NaCl) did not affect aggregation of Au NPs and showed a color change from red to royal purple. In contrast, the Y-shaped T-DNA–protected Au NPs did not aggregate in the presence of NaCl, thereby reversing the color from royal purple to red. Both aggregation and dispersion of Au NPs in the presence and absence of T-DNA were authenticated with TEM and DLS interrogations. The best result was attained at pH 3–11 after 5 min incubation. The SPR linearity was between 5 and 100 nM, with an LOD of 5 nM. The selectivity was confirmed by employing various DNAs. However, real-time colorimetric assays of T-DNA still need more experimental data to confirm feasibility. The sequential colorimetric detection of sanguinarine (SNG; an anti-cancer drug and Calf Thymus DNA (Ct-DNA) was proposed using CI-Au NPs (particle size = 13 nm; conc. = 0.8 nM) [88]. The SNG (1 µM) was engaged as an aggregation-inducing agent in the presence of 14 mM NaCl and delivered a color change from red to blue at an optimum pH value of 7.4 (buffer: Tris-EDTA (EDTA = Ethylenediamine Tetraacetic acid)) after 10 min incubation. The SNG showed a linearity of between 0 and 0.9 µM (at A627/A525), with an LOD of 46 nM. In contrast, the SNG-induced aggregation of CI-Au NPs is disrupted upon pre-treating with Ct-DNA (in the presence of 14 mM NaCl and at pH 7.4 (Tris-EDTA), after 10 min incubation) due to the strong affinity of SNG to Ct-DNA, thereby reversing the colorimetric response from blue to red/pink, as illustrated in Figure 17. TEM and SPR spectral studies supported the aggregation and anti-aggregation as well as the colorimetric changes. The linear regression of Ct-DNA was between 0 and 5 µM (at A525/A627), with an LOD of 0.36 µM. Both sensory selectivities did not show any interfering effect from the competing species. The colorimetric Ct-DNA assay by this method was validated by human urine analysis, which showed a recovery of >95%, with an RSD of <6%. Thus, it can be noted as a nice innovation toward colorimetric assays of SNG and Ct-DNA.
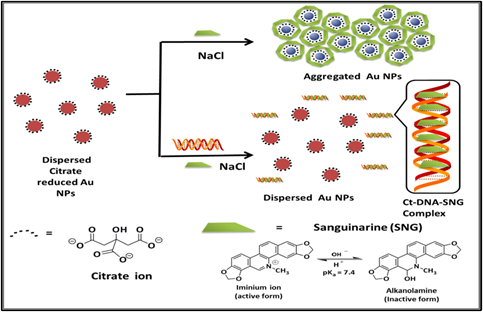
Figure 17. Mechanistic outline for detection of SNG and Ct-DNA using CI-Au NPs as colorimetric probe (reproduced with the permission from [88]).
The anti-aggregation-based colorimetric assay of heparin (an anticoagulant used in the treatment of certain blood vessel, heart, and lung conditions) was proposed by employing 4-mercaptobenzoic acid–stabilized Au NPs (4-MBA-Au NPs; particle size = 41 nm), CI-Au NPs (particle size = 13 nm) modified with protamine (0.6 µg/mL), and PDDA (0.02 µM) as corresponding aggregation agents [89,90]. In both reports, the -vely charged Au NPs interacted with +vely charged protamine and PDDA, which enhanced the aggregation with a colorimetric change from red to blue. Thereafter, pre-mixing of negatively charged heparin with protamine/PDDA led to anti-aggregation of Au NPs (resulted from strong affinity of the +vely charged protamine/PDDA to vely charged heparin) with a color change from blue to red. The SPR changes of 4-MBA-Au NPs in the presence and absence of protamine and heparin were observed from the relative intensity at 1590 cm−1 in Raman spectroscopy investigations (measured at pH 7.4 (buffer: 10 mM HEPES within few minutes incubation) [89]. The SPR linearity of 4-MBA-Au NPs-protamine to heparin was between 0.05 and 20 ng/mL, with an LOD of 0.03 ng/mL (ng = nanogram; mL = milliliter). In contrast, CI-Au NPs [90] in the presence of PDDA and heparin (after 3 min incubation) displayed the SPR linearity of between 0 and 0.4 mg/mL (at A650/A520; mg = milligram), with an LOD of 0.02 µg/mL (µg = microgram). TEM studies of both reports confirmed the anti-aggregation-induced by heparin. The real samples investigations (fetal bovine serum and human blood serum, respectively) validated their applicability with recoveries of >90% and an RSD of <6%. These reported are regarded as remarkable inventions on colorimetric assay of heparin; however, further research is mandatory toward commercial applications.
Kim and co-workers described the anti-aggregation-enabled colorimetric detection and in vitro assay of amyloid β peptide (Aβ; a critical initiator that triggers the progression of Alzheimer’s disease (AD) via aggregation) by engaging CI-Au NPs (particle size = 17 nm) in the presence of Cu2+ (10 µM; pH 5; 45 °C) [91,92]. These reports provide valuable information on the effects of 10 anti-aggregation agents, such as acetylcholine, albumin, caffeine, catechin, curcumin, glutathione, resveratrol, rutin, silibinin, and trehalose, toward quantification of amyloid β fragments (Aβ (140) and Aβ (1-42)) and application in the detection of Alzheimer’s disease. In fact, inhibition of Aβ aggregation is essential to avoid the progression of Alzheimer’s disease [93]. Thus, they can be regarded as exceptional work based on the anti-aggregation-facilitated colorimetric assay.
The human chorionic gonadotropin (hCG; a hormone produced during pregnancy) and methylglyoxal (MGO; a food toxin) was quantified by anti-aggregation-enabled colorimetric assay [94,95], wherein, CI-Au NPs (particle size = 13 nm) were aggregated in the presence of peptide (0.5 µM) and o-phenylenediamine (OPD; 0.5 µM) to display a color change from red to blue. By pre-treating the hCG/MGO with peptide and OPD (at pH 7.4 (buffer: PBS in 18.8 mM NaCl) and at pH 7.5 (buffer: sodium phosphate) after 16 min and 30 min incubation, respectively), the colorimetric response was reversed from blue to red. The underlying mechanism is that the hCG and MGO react with peptide and OPD, respectively, to induce anti-aggregation of Au NPs, which is evident from TEM, DLS, SPR, and interference studies. The HCG showed a linear range of between 50 and 1000 mIU/mL (at A600/A525; mIU = milli-international units), with an LOD of 25 mIU/mL [94]. Likewise, the linearity of MGO was between 0.01 and 10 µM (at A520/A680), with an LOD of 50 nM [95]. Though both works are remarkable, more attention is required in their practicality.
Su et al. proposed the anti-aggregation-enabled colorimetric detection of oxytetracycline (OCT; an antibiotic drug) using cysteamine-stabilized Au NPs (cysteamine-Au NPs) and aptamer (OBA; 3 nM; sequence: 5′-CGT ACG GAA TTC GCT AGC GGG CGG GGG TGC TGG GGG AAT GGA GTG CTG CGT GCT GCG GGG ATC CGA GCT CCA CGT G-3′) as the aggregation-inducing agent [96]. In the presence of OBA, the cysteamine-Au NPs aggregated with a color change from red to blue, which was re-dispersed (with a color change from blue to red) by OCT via anti-aggregation. In fact, OTC reacted with OBA effectively due to their electrostatic attraction and displayed anti-aggregation, as evident by TEM, DLS, SPR, and interference studies. The linearity of OTC was between 4.34 and 60.81 µM (intensity change at A527), with an LOD of 493 nM. The milk samples analysis showed a recovery of >80%, with an RSD of <3%; thus, it can be included in the OTC quantification tactics.
The anti-aggregation-enabled colorimetric assay of azodicarbonamide (ADA; a flour contaminant) was reported using CI-Au NPs (particle size = 23 nm) and GSH (2.5 µM) as the aggregation-inducing agent [97]. Due to strong electrostatic interaction between Au and SH of CI-Au NPs and GSH, an initial color change occurred (from red to blue) via aggregation. When the above mixture was pre-treated with ADA, oxidation of -SH group (of GSH) by ADA led to the formation of an -S-S-bond; thus, the aggregation was disrupted with a colorimetric response from blue to red. The best result was attained at pH 3.3 (buffer: 3.3 mM BR), 50 °C, and after 60 min incubation. SPR, TEM, and DLS investigations authenticated the anti-aggregation strategy. The linear range of ADA was established as being between 0.12 and 1.00 μM (at A520/A668), with an LOD of 70 nM. This work was also demonstrated in homemade and market flour samples, with recoveries of >90% and an RSD of <6%. Therefore, it can be noted as a remarkable innovation toward flour contaminants detection.
5. Anti-Aggregation in Au NPs-Based Colorimetric Assay of Pesticides and Herbicides
Liu and co-workers demonstrated the anti-aggregation-enabled colorimetric assay of chlorsulfuron (first sulfonylurea herbicide) by engaging PDDA-Au NPs (particle size = 13 nm) and acetamiprid (an organic compound; 90 µM) as the aggregation-inducing agent [98]. Due to the electrostatic interaction between acetamiprid and PDDA-Au NPs, aggregation occurred with a color change from Bordeaux red to blue. The above reaction was inhibited in the presence of chlorsulfuron because of its strong affinity to acetamiprid, and, hence, the color changed from blue to red due to anti-aggregation of the Au NPs.
The best result was attained at pH 4.5 (buffer: 10 mM NAc-HAc) after 30 min incubation. TEM, SPR, FTIR (FTIR = Fourier transform infrared spectra), and interference studies validated the anti-aggregation, acetamiprid-chlorsulfuron complex, and high selectivity. As seen in Figure 18A,B, the color and SPR spectra show dependence on the chlorsulfuron concentrations (linear range at A523: 0.28–279 µM), with an LOD of 0.14 µM. Tap and well water interrogations showed recoveries of >75%, with an RSD of <8%, but more optimizations are still required toward real applications. Following the similar experimental conditions (pH and incubation time) and mechanistic approach, the anti-aggregation-enabled colorimetric assay of metsulfuron–methyl (a sulfonylurea pesticide) was proposed by employing CI-Au NPs (particle size = 20 nm) and melamine (15.86 µM) as the aggregation-inducing agent [99]. In the presence of melamine, the color of Au NPs changed from red to blue via aggregation. During analyte sensing, the melamine interacted with metsulfuron–methyl via H-bonding, which resulted in anti-aggregation and a reversed color change from blue to red. The linear range of the analyte was between 0.26 and 262 µM (at A523), with an LOD of 131 nM. The real analysis in tap water and well water showed recoveries of >70%, with an RSD of <7%. However, this work requires more effort toward real-time applicability.
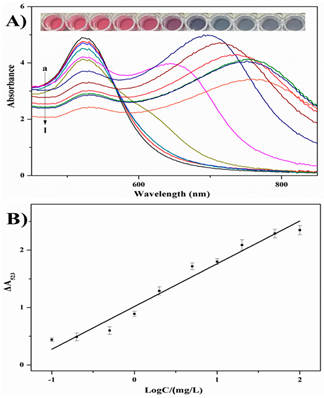
Figure 18. (A) UV–vis spectra and a photograph of (a) AuNP solutions and AuNP solutions with concentrations of chlorsulfuron of (b) 100 mg/L, (c) 50 mg/L, (d) 20 mg/L, (e) 10 mg/L, (f) 5.0 mg/L, (g) 2.0 mg/L, (h) 1.0 mg/L, (i) 0.5 mg/L, (j) 0.2 mg/L, (k) 0.1 mg/L, and (l) 0 mg/L in the presence of 20 mg/L acetamiprid and (B) standard calibration curve of the absorbance change of Au NPs at 523 nm (ΔA523) against chlorsulfuron concentration ((A,B) are reproduced with the permission from [98]).
Keshvari and co-workers reported the anti-aggregation-enabled colorimetric quantification of catechol (intermediates in pesticides industries) by applying CI-Au NPs and 4-Mercapto-phenyl boronic acid (MPBA; 0.4 µM) as the aggregation-inducing agent [100]. The mercapto (-SH) group in MPBA bound strongly to the Au surface and induced aggregation and a color change from red to blue. However, in the presence of catechol, the Au-S binding was disrupted by the reaction between diol and boronic acid, which resulted in anti-aggregation and a reversed color change (from blue to red). The best result was attained at pH 7.6 after 5 min incubation. The linearity of the catechol detection was between 0.87 and 56 µM (at A519/A640), with an LOD of 0.41 µM. Investigations on river and plasma samples showed recoveries of > 100%. Although TEM and SPR studies reported in this work validated the anti-aggregation, they lacked information of the particle size variations, interference studies with many compounds, and buffer used, thereby requiring more experimental works.
Chen et al. described the distinct colorimetric detection of terbuthylazine (TBA; an herbicide) and dimethoate (DMT; a common organic phosphorus insecticide) by using CI-Au NPs (particle size = 16 nm) via aggregation and anti-aggregation, respectively [101], wherein Au NPs aggregated with a color change from red to blue when 40 mM of NaOH (pH > 9) was added. Pre-mixing of NaOH with DMT induces anti-aggregation, SPR spectral variations (among other interferences), and a color change from blue to red, as visualized in Figure 19A,B. The underlying mechanism is that, during the pre-mixing of NaOH and DMT, a hydrolysis reaction occurred, and the OH− from NaOH hydrolyzed the methoxy groups (-OCH3 attached over S-P = S) of DMT to form methanol (CH3OH), which resulted in the anti-aggregation of Au NPs at an optimum incubation time of 10 min. The linear range of DMT was between 1 and 40 nM (at A525/A680), with an LOD of 6.2 nM. SPR, TEM, DLS, and interference studies well attested the anti-aggregation and DMT selectivity over other competing species. This work was also demonstrated by tap water, green tea, and apple juice analysis with nanomolar LODs. Therefore, based on distinct analyte sensing strategy and real-time applicability, this work can be regarded as an exceptional work.
By means of base-mediated hydrolysis, anti-aggregation-enabled colorimetric assay of malathion (an organophosphate pesticide) was demonstrated by employing CI-Au NPs (particle size = 13.5 nm, conc. = 7.5 nM) and 40 mM NaOH as the aggregation-inducing agent [102]. In the presence of 40 mM NaOH, Au NPs aggregated with a color change of red to blue. When NaOH was pre-treated with malathion, a hydrolysis reaction occurred to afford methanol (via hydrolysis of -OCH3 in S-P = S) and ethanol (from hydrolysis of ethyl ester of malathion), which resulted in the anti-aggregation of Au NPs with a color change from blue to red. The best colorimetric response/anti-aggregation was found at pH > 9 (from 40 mM NaOH) and after 20 min incubation. The linear response was between 0.05 and 0.8 μM (at A525/A680), with an LOD of 11.8 nM. This work was validated by TEM, SPR, and real samples (tap water, vegetable, and apple juice) investigations and showed LODs at nM and recoveries of between 94 and 107%, with an RSD of <8%. However, interference studies must be improved by including more competing species.
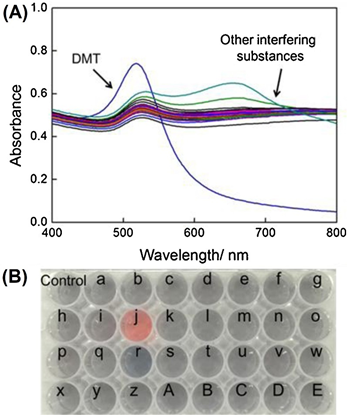
Figure 19. Selectivity of the AuNP-based colorimetric sensor for rapid detection of DMT compared with other substances. UV–vis absorption spectra (A) and photographic images (B) of the AuNP-based colorimetric sensor (0.86 mL) incubated (10 min) with 40 µL of NaOH (1.0 M) plus 100 µL of DMT (0.2 µM), or plus 100 µL of other substances (1.0 µM), or plus 100 µL of H2O (control). (a) Iprodione; (b) Dioxacarb; (c) Benzex; (d) Isoprocarb; (e) Chipton; (f) Pretilachlor; (g) Sodium cyclamate; (h): Permethrin; (i) Trichlorphon; (j) Dimethoate; (k) Fenvalerate; (l) Chlorpyrifos; (m) Profenofos; (n) Indoxacarb; (o) Dichlorodiphenyltrichloroethane; (p) Glufosinate-ammonium; (q) Glyphosate; (r) Terbuthylazine; (s) Deltamethrin; (t) D-glucose; (u) Aspartame; (v) K+; (w) Na+; (x) Mg2+; (y) Ba2+; (z) Cl−; (A) NO3−; (B) Ac−; (C) CO32−; (D) SO42−; (E) PO43− (reproduced with the permission from [101]).
Chungchai et al. described the anti-aggregation-based colorimetric detection of chlorpyrifos (an organophosphate pesticide) by engaging graphene-quantum-dot–capped gold nanocomposite particles (GQD-Au NPs; particle size = 12 ± 0.26 nm) [103]. Herein, acetylthio-choline chloride (ATCh; 50 µM) was utilized as an aggregation-inducing agent in the presence of acetylcholinesterase (AChE). The AChE reacted with ATCh to produce thiocholine, which caused the aggregation of GQD-Au NPs with a color change from red to blue-purple. The above reaction was inhibited in the presence of chlorpyrifos; therefore, production of thiocholine was inhibited, which resulted in anti-aggregation and a color change from blue-purple to red. The best result was attained at pH 7 (buffer: PBS) after 15 min incubation. The linear range of chlorpyrifos was between 0.29 and 143 µM (at A520), with an LOD of 131 nM. This work was attested by SPR, TEM, interference, vegetable sample, and microfluidic paper-based analytical device (3D-µPAD) studies. Therefore, it can be regarded as a nice innovation but still requires careful optimizations on the concentrations of AChE and ATCh.
Liu et al. employed the 4-aminothiophenol (4-ABT)-functionalized Au NPs (Au NPs@4-ABT; particle size = 63 ± 6 nm) toward anti-aggregation-facilitated colorimetric detection of thiram (a protective fungicide for the storage and shipment of fruit, grain, and vegetable) using Ag+ (1 µM) as the aggregation-inducing agent [104]. As seen in Figure 20, Au NPs@4-ABT aggregate in the presence of Ag+ (via strong binding between free -NH2 and Ag+) to deliver a color change from red to blue. However, when thiram is pre-mixed with Ag+, the reaction between Au NPs@4-ABT to Ag+ is inhibited (due to a strong affinity between thiram and Ag+), which results in anti-aggregation with a color change from blue to red, as displayed in Figure 20. The best colorimetric response was obtained at pH 7.5 (buffer: 10 mM PBS) after 12 min incubation. The linear range of thiram was between 0.05 and 2.0 µM (at A542), with an LOD of 40 nM. TEM, SPR, XPS, DLS, interference, and real samples (apple and soil; recoveries of >80%, with an RSD of <5%) studies validated the proposed colorimetric method toward thiram quantification. Thus, it can be regarded as an outstanding research in food contaminant detection.
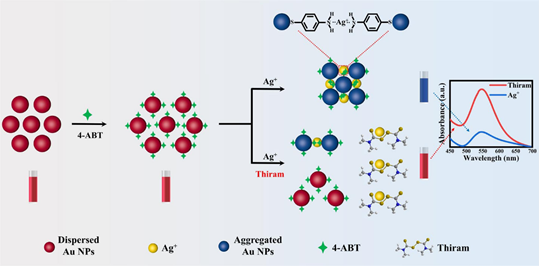
Figure 20. The schematic illustration for thiram detection via Au NPs@4-ABT probe (reproduced with the permission from [104]).
Subsequently, the use of CI-Au NPs (particle size = > 10 nm) for anti-aggregation-enabled colorimetric detection of glyphosate (GPS, an herbicide) was reported in the presence of Pb2+ (35 µM; aggregation-inducing agent) [105], wherein Pb2+ induced aggregation of Au NPs and displayed a color change from wine-red to gray. The pre-mixing of GPS with Au NPs hindered the aggregation process and led to a reversed colorimetric response with a color change from gray to red. The best response was achieved at pH 7 after 10 min incubation. The GPS showed the linearity of between 0 and 0.8 µM (at A520/A680), with an LOD of 2.38 nM. This work is exceptional as demonstrated in TEM, DLS, competing analysis (with 13 interferences), and real water (tap and lake water; recoveries of = > 90%) investigations.
6. Ag NPs-Based Colorimetric Assay of Diverse Analytes via Anti-Aggregation
Silver nanoparticles (Ag NPs) were also reported toward distinct analyte quantification via the anti-aggregation strategy similar to Au NPs, as discussed in this section. Duan et al. described the use of citrate-capped Ag NPs (CI-Ag NPs) toward the detection of Hg2+ via anti-aggregation in the presence of the aggregation-inducing agent 6-thioguanine (0.83 µM) [75][106], in which 6-thioguanine induced aggregation of Ag NPs to produce a color change from yellow to brown. However, the brown color was reversed to yellow via anti-aggregation by pre-mixing Hg2+ (at different concentrations). The underlying mechanism was that 6-thioguanine induced aggregation due to its strong electrostatic interaction toward CI-Ag NPs. However, the aggregation was inhibited by the presence of Hg2+ (via strong binding of 6-thioguanine with Hg2+) and resulted in the anti-aggregation of CI-Ag NPs. The best colorimetric response was achieved at pH 4 (100 mM HAc-NaAc) after 30 min incubation. The linear range of Hg2+ was between 0 and 333 nM (at A530/A394), with an LOD of 4 nM. SPR, TEM, interference, and spring water studies (recoveries of between 103 and 105%) validated this work as a major innovation. Figure 12Figure 21A–C display the colorimetric response, SPR variations, and linearity of Hg2+ induced anti-aggregation of 6-thioguanine-CI-Ag NPs system, respectively.
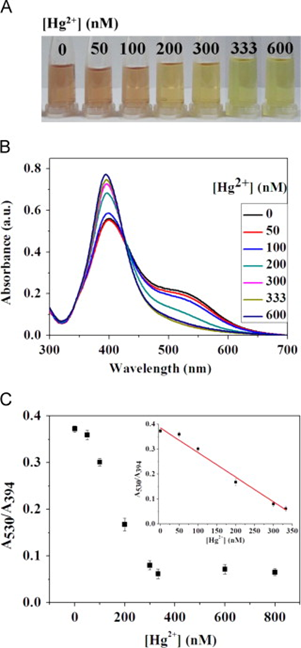
Figure 212. (A) The photographic images of the 6-thioguanine–Ag NPs solutions in the presence of different concentrations of Hg2+ (0–600 nM). (B) The corresponding UV–vis spectra of 6-thioguanine–Ag NPs. (C) The absorbance ratio (A530/A394) of 6-thioguanine–Ag NPs versus Hg2+ concentration. Inset to C: plot of A530/A394 versus the Hg2+ concentration. The concentration of 6-thioguanine was 0.83 μM ((A–C) are reproduced with the permission from [75][106]).
Anti-aggregation-enabled colorimetric assay of Cu2+ was demonstrated by employing CI-Ag NPs and engaging 1,4-dithiothreitol (DTT; 10 µM) as the aggregation-inducing agent [76][107], wherein DTT induced the aggregation of Ag NPs via a strong Ag-S bonding and displayed a color change from yellow to deep green. Upon pre-mixing Cu2+ in 2,6-pyridinedicarboxylic acid (PDCA, 5 mM), the DTT oxidized to form an intramolecular-S-S-bond, which inhibited aggregation and produced a reversed color change from deep green to yellow. The best result was attained at pH 2–10 (buffer: HCl-NaOH) after 20 min incubation. The linearity of Cu2+ was between 0.1 and 2 µM (at A408), with an LOD of 0.1 µM. SPR, TEM, interference, and real samples (tap water and ground water; recoveries of = > ≥95%, with an RSD of <8%) interrogations validated this method. Hence, it can be regarded as a remarkable research, but details on particle size variations are still missing.
He and co-workers reported the anti-aggregation-enabled colorimetric detection of Mn2+ by employing CI-Ag NPs (conc. = 0.28 nM) and L-Arginine (L-Arg; 0.7 mM) as the aggregation-inducing agent [77][108]. The Ag-N covalent interaction between Ag NPs and L-Arg caused aggregation, with the color of the solution changing from yellow to colorless. The color of Ag NPs changed back from colorless to yellow via anti-aggregation when the above solution was pre-treated with different concentrations of Mn2+. In fact, the anti-aggregation was attributed to the stronger attraction of L-Arg toward Mn2+ than that of the Ag NPs. The best result was obtained at pH 9.4 (buffer; BR) after 40 min incubation. Two linear ranges for Mn2+ were established between 0 and 700 nM and 5 and 70 µM (both at A390), with an LOD of 20 nM. As illustrated in Figure 13Figure 22A,B, none of the competing species shows interference to Mn2+ selectivity. By this method, real water (lake, tap, and river) recoveries were >90%, with an RSD < 3%. This work is regarded as an exceptional innovation, but it still lacks particle size variations details.
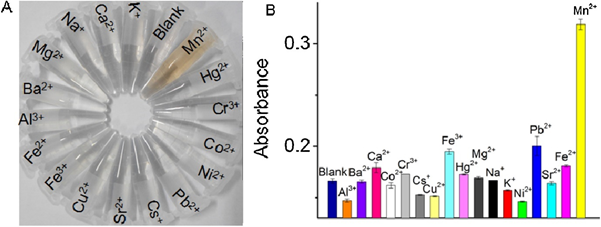
Figure 1322. (A) The photographs and (B) the corresponding absorbance of the Ag NPs-l-arginine dispersions in the presence of different metal ions. The concentrations of both Mn2+ ions and other metal ions were 10 µM ((A,B) are reproduced with the permission from [77][108]).
Basiri et al. developed the Ag NPs–decorated graphene nanocomposites (rGO@Ag NPs; particle size = 3.7 ± 0.8 nm) for anti-aggregation-enabled colorimetric detection of Cu2+ using dopamine (DA; 25 µM) as the aggregation-inducing agent. The Ag NPs and 5 mg/mL of rGO was boiled at pH 10 and at 100 °C for 10 min to afford rGO@Ag NPs. The rGO@Ag NPs were well characterized by SPR, TEM, FTIR, XPS, and XRD studies (XRD = X-ray diffraction). Due to the H-bonding and π–π interactions between DA and rGO@Ag NPs, aggregation occurred (witnessed by TEM) with a color change from yellow to brown. In the presence of Cu2+, the interaction of DA to rGO@Ag NPs was hindered due to selective chelation of Cu2+ with DA and resulted in anti-aggregation (seen by TEM) with a color change from brown to yellow. Note that none of the competing species induces anti-aggregation, as shown in Figure 14Figure 23. The best colorimetric response was observed at pH 7 (buffer: 10 mM PBS) after 15 min incubation. The linearity of Cu2+ ranged between 0.02 and 1.5 µM (at A405/A515), with an LOD of 9.8 nM. Moreover, real samples (human urine for DA and tomato for Cu2+) investigations demonstrated recoveries of >98%, with an RSD of <3%; thus, it can be noted as an excellent method.
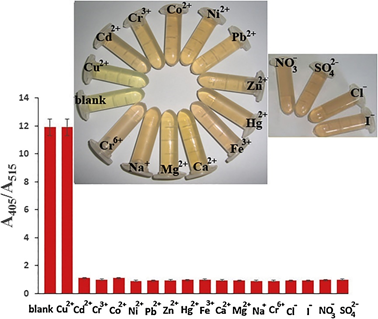
Figure 1423. Colorimetric signals in the presence of different metal ions and anions (1.5 µM) as the interferences of Cu2+. Inset: the photographic images of the corresponding solutions (reproduced with the permission from [78][109]).
An anti-aggregation-enabled colorimetric assay of Br− and I− was demonstrated using CI-Ag NPs (particle size = 10–15 nm; conc. = 69.4 µM) and Cr3+ (125 µM) as the aggregation-inducing agent [79][110]. In the presence of Cr3+, the Ag NPs aggregated to produce a color change from yellow to brown. Due to the complexation of Cr3+ with Br− and I−, anti-aggregation occurred to reverse the color from brown to yellow. The linearity of Br– and I– was between 0.99 and 5.66 µM (at A500) and 0.99 and 4.16 µM (at A500), with LODs of 1.67 µM and 1.32 µM, respectively. Though this report was validated by SPR, DLS, and interference studies, data in TEM, pH, incubation time, and real-time investigations were insufficient; therefore, it can be only regarded as a preliminary work. To this track, the sulfanilic acid (SA) and catechol (CAT)–functionalized Ag NPs aggregate (SA-CAT-Ag NPs) was utilized for anti-aggregation-enabled colorimetric detection of F– [80][]. The CA was firstly oxidized by silver ions followed by SA nucleophilic attack to deliver aggregated SA-CAT-Ag NPs with red color. By adding F– to the above mixture, it adsorbed on the Ag surface and stripped the SA-CAT stabilizer from -SO3− moiety, hence the aggregation was disturbed with a color change from red to yellow. The best color response was attained at pH 4–9 after 1 min incubation. The linear range of F– was between 1 and 40 µM (at A397/A508), with an LOD of 0.2 µM. This work was authenticated by SPR, TEM, interference (negligible), and spring water investigations. Thus, it can be noted as a nice approach for F– quantification.
Dong et al. demonstrated using poly-vinyl pyridine (PVP)–modified Ag NPs (PVP-Ag NPs; particle size = 6.24 nm) the colorimetric assay pyrophosphate ((P2O74−; PPi) via the anti-aggregation strategy [81][112]. Herein, the Pb2+ (5 µM) was employed as the aggregation-inducing agent to induce the PVP-Ag NPs (due to its crosslink effect with PVP) aggregation and to produce a color change from yellow to blue. Anti-aggregation was induced by pre-mixing PPi, which resulted in a colorimetric response from blue to yellow due to the chelating interaction between PPi and Pb2+. The best result was obtained at pH 5–9 at 20 °C after 30 min incubation. The linear ranges of PPi were between 0.2 and 2.0 μM and 2.0 and 10.0 μM (at A396), with an LOD of 0.2 µM. This work was authorized by smartphone device, SPR, TEM, statistical, theoretical, interference, real samples (tap water (recoveries between 79.6 and 107.6%) and canned meat (66.7–118.4%)) interrogations. Therefore, it can be regarded as an exceptional invention in Ag NPs-based colorimetric assay. Following a similar mechanistic approach, the 2-Mercapto-ethane sulfonate–modified silver nanoplates (MS-Ag NPls) were employed in the colorimetric detection of PO43− (Pi) on PADs in the presence of the aggregation-inducing agent Eu3+ (65.81 µM) [82][113]. In the presence of Eu3+, the color of MS-Ag NPls changed from pink to purple, which was reversed (from purple to pink) during the quantification of Pi. All the sensory experiments were conducted at pH 7 (buffer: 25 mM Tris) at an optimum incubation time of 3 min. The linear regression of Pi was between 10.42 and 313 µM (at A520), with an LOD of 3.44 µM. This work was also authenticated by water and soil investigations. Moreover, this is the only report available on the Ag NPls-based colorimetric assay. Therefore, it is regarded as a remarkable method.
The surface-enhanced Raman scattering (SERS) technique was employed with 4-mercaptopyridine (4-MPY)-modified Ag NPs (4-MPY-Ag NPs) for anti-aggregation-enabled detection of trypsin (an enzyme that aids with digestion) in the presence of the aggregation-inducing agent protamine (0.3 µg/mL (10 µL)) [83][114]. The presence of +vely charged protamine over 4-MPY-Ag NPs induced aggregation via strong electrostatic interaction with a color change from yellow to deep green. However, trypsin enhanced the enzymatic fragmentation of protamine, which resulted in anti-aggregation with a reversed color change from deep green to yellow. The SERS linear range was between 0.14 nM and 13.8 μM (at 1096 cm−1), with an LOD of 0.14 nM. All the SERS experiments were conducted at pH 7.4 (buffer: HEPES) within 1 min. Based on SERS, TEM, and interference studies, this work can be regarded as a unique one. An anti-aggregation-enabled colorimetric assay of poly diallyl-dimemethyl-ammonium chloride (PDADMAC; a coagulant in water and wastewater treatment) was proposed by employing CI-Ag NPs (particle size = 6 ± 2 nm) and 0.2 M PBS buffer (pH 7.4) as the aggregation-inducing agent [84][115]. The phosphate buffer induced aggregation of Ag NPs, which resulted in a color change from yellow to colorless. However, in the presence of PDADMAC, the Ag NPs were stabilized by electrostatic attraction and steric hindrance, which resulted in being dispersed NPs with a reversed color change (from colorless to yellow). Note that the colorimetric responses occurred within 3 min. The linear range of PDADMAC was between 1 and 100 mg. L−1 (at A396), with an LOD of 0.7 mg. L−1. This tactic was well authorized by SPR, TEM, interference, and tap water interrogations. Thus, it can be noted as a nice innovation. However, further optimization is mandatory toward the LOD reduction.
Though anti-aggregation-enabled Ag NPs-based colorimetric assays seem to be effective in analytes quantification, available reports are much less sufficient than that of aggregated Ag NPs-based colorimetric sensors [85][86][87][88][89][90][116–121]. Therefore, further research is required as suggested in perspectives.
57. Design/Sensory Requirements, Advantages, and Limitations
5.1. Probe Design and Sensory Requirements
7.1. Probe Design and Sensory Requirements
The development of exceptional Au NPs- and Ag NPs-based colorimetric probes and their anti-aggregation-enabled sensory performances must follow the requirements as stated below:
- ]
- [93][94][95][96][97].
- In the anti-aggregation-enabled sensory studies, sequential colorimetric detection of the aggregation-inducing agent and analyte can be carried out with reliable linearity and LODs down to nano- and pico-molar levels. Thus, it can be regarded as an advantage over other methods.
- By using the anti-aggregation-enabled Au NPs- and Ag NPs-based colorimetric assay, diverse analytes can be detected with specificity under a fixed pH value, incubation time, and operative temperature.
- Anti-aggregation of Au NPs in the presence of certain peptide sequences can be employed to avoid amyloid aggregation and Alzheimer’s disease occurrence.
- The anti-aggregation strategy in Au NPs- and Ag NPs-based colorimetric sensors can be effectively applied in real samples, such as water, soil, plasma, urine, etc.; thus, it can be noted as a great advantage toward development of the “state of the art” method.
- The selected label-free/modified Au NPs- or Ag NPs-based probes must possess dispersion stability in color and firm electrostatic charges to be able to interact with aggregation-inducing agents and to afford a certain degree of aggregation and a distinct colorimetric response.
- Selection of a suitable aggregation-inducing agent is essential to attain the primary colorimetric changes. An aggregation-inducing agent should have any of the following three characteristics: (i) analyte replaceable electrostatic interactions, (ii) analyte disposable interactive binding (such as Au-S, Ag-S, Au-N, Ag-N, etc.) over the NPs’ surface, and (iii) analyte coordinative units (such as thymine, -SH, -NH2, -COOH, -OCH3, and -OC2H5, etc.) that are able to form coordination complexes or undergo catalytic reactions to be released from the NPs’ surface. Moreover, it is essential to fix the concentration of the aggregation-inducing agent before taking further sensory interrogations.
- Optimizations of the effective pH conditions, suitable pH buffer solution, concentration, and maintenance circumstances are necessary for anti-aggregation-based colorimetric analyte detection.
- It is essential to fix the exact incubation time to achieve stable colorimetric response and to help to clarify the underlying mechanism and kinetics of the anti-aggregation.
- Though most of the anti-aggregation-enabled colorimetric sensory are conducted at room temperature, it is also important to fix the operative temperature toward real-time applications.
- To avoid complications in real water investigations, it is necessary to identify the interfering effect, allowed concentration, required masking agent, etc.
5.2. Advantages
7.2. Advantages
Anti-aggregation-enabled Au NPs- and Ag NPs-based colorimetric assays have following advantages, as stated below:
- In general, anti-aggregation-enabled Au NPs- and Ag NPs-based analyte quantifications are conducted in an aqueous environment; therefore, they are tactics comparable to the available luminescent inorganic and organic nanomaterials-based sensors performed in diverse solvent conditions [122–130].
- The anti-aggregation-enabled Au NPs- and Ag NPs-based analyte detection can be observed with naked eye, thereby becoming a competing strategy to the reported organic dyes-based sensors [91][92
- In general, anti-aggregation-enabled Au NPs- and Ag NPs-based analyte quantifications are conducted in an aqueous environment; therefore, they are tactics comparable to the available luminescent inorganic and organic nanomaterials-based sensors performed in diverse solvent conditions [122–130].
- The anti-aggregation-enabled Au NPs- and Ag NPs-based analyte detection can be observed with naked eye, thereby becoming a competing strategy to the reported organic dyes-based sensors [131–137].
- In the anti-aggregation-enabled sensory studies, sequential colorimetric detection of the aggregation-inducing agent and analyte can be carried out with reliable linearity and LODs down to nano- and pico-molar levels. Thus, it can be regarded as an advantage over other methods.
- By using the anti-aggregation-enabled Au NPs- and Ag NPs-based colorimetric assay, diverse analytes can be detected with specificity under a fixed pH value, incubation time, and operative temperature.
- Anti-aggregation of Au NPs in the presence of certain peptide sequences can be employed to avoid amyloid aggregation and Alzheimer’s disease occurrence.
- The anti-aggregation strategy in Au NPs- and Ag NPs-based colorimetric sensors can be effectively applied in real samples, such as water, soil, plasma, urine, etc.; thus, it can be noted as a great advantage toward development of the “state of the art” method.
5.3. Limitations
7.3. Limitations
Anti-aggregation-enabled Au NPs- and Ag NPs-based colorimetric sensors also have a few limitations, as discussed below:
- Anti-aggregation-enabled Au NPs- and Ag NPs-based colorimetric sensory responses are aquatic environment-dependent; therefore, the detection of analytes in other solvent systems is not possible with this method.
- There are many optimization conditions (such as the aggregation-inducing agent, pH (buffer), NaCl effect, incubation time, temperature, etc.) required in order to attain the sensory responses, thereby limiting the frequent use of the anti-aggregation strategy.
- Due to the co-existence of the aggregation-inducing agent and analyte in the same mixture, the re-use of the mixture is not possible at all. Similarly, many reports used complicated assay protocols, which may have led to unknown human errors and restricted the use of this method.
- Elucidation of precise sensory mechanisms requires supportive evidence, such as FTIR, TEM, XPS, XRD, etc. Thus, this method was limited by available instruments and cost-effectiveness.
- The best result of anti-aggregation-enabled Au NPs- and Ag NPs-based colorimetric sensors can only be attained at a fixed interfering specie concentration, which is not possible with real samples (may contain large amounts of interference); therefore, real-time use of the strategy is still questionable.
- Real water/soil samples from different places contain various complicated matrixes. Thus, applying the anti-aggregation-enabled Au NPs- and Ag NPs-based colorimetric assay to all the real samples is not possible or may not deliver expected results.
68. Conclusions and Perspectives
In this rentryview, discussions on anti-aggregation-enabled Au NPs- and Ag NPs-based colorimetric sensing of metal ions, anions, bio-analytes, pesticides, and herbicides are delivered in great details. The assay protocols, optimized concentrations of aggregation-inducing agents, pH (buffer solution), incubation times, and operating temperatures are provided and tabulated for readers. The exact underlying mechanisms of each probe leading to the colorimetric response are explained with clear evidence. Real-time applications are illustrated, and comments are given on the performance of each individual report. Finally, researcherswe suggest the probe design/sensory requirements together with the merits and limitations of the anti-aggregation strategy. Though the anti-aggregation strategy-based colorimetric sensors are noted as being great innovations, there are still a few perspective points that need to be focused on, as noted below:
- Most reports on anti-aggregation-enabled Au NPs- and Ag NPs-based colorimetric sensors used complicated assay protocols, which should be simplified toward “state of the art”.
- Performance of anti-aggregation-enabled Au NPs- and Ag NPs-based colorimetric sensors depends on the pH values and buffer used. The use of unified pH buffer solution must be justified in the future to achieve a unique anti-aggregation strategy.
- By means of anti-aggregation, numerous reports are available on Au NPs-based colorimetric assay of Hg2+; however, none of them were commercialized toward practicality. This requires more efforts in future.
- The majority of anti-aggregation-based colorimetric sensors by Au NPs and Ag NPs focused on single-analyte quantification so far, which must be upgraded to multi-analyte detection. For example, the aggregation-inducing agent Hg2+ also has the coordination tendency for biothiols and I−, hence it can be employed in the quantification of both analytes.
- In many reports, anti-aggregation due to coordination of aggregation agents with analytes was not supported by valid evidence, which requires further clarification.
- Currently, anti-aggregation-enabled Au NPs- and Ag NPs-based colorimetric sensors are only available for the detection of limited metal analytes (such as Hg2+, Cu2+, Ag+, Mn2+, and Sc3+), thereby requiring more attention toward developing discrimination of more metal ion species.
- Anti-aggregation proposed for oxidative catalytic reactions falls short of evidence, and it should be addressed with more experimental data.
- Concerning the social impact, anti-aggregation-enabled in vitro colorimetric assay of amyloid β peptide toward the inhibition of Alzheimer disease requires great attention in future research work.
- Reports on anti-aggregation-enabled Au-NPs colorimetric assay of anions, pesticides, and herbicides are insufficient to justify the effectiveness of the strategy toward those analytes. This issue should be addressed in future.
- Only a few reports are available on the anti-aggregation-stimulated Ag NPs-based colorimetric sensors toward diverse analytes detection. Therefore, research on anti-aggregation of Ag NPs toward the discrimination of distinct analytes requires great attention.
- Compositions of Au NPs and Ag NPs with other established luminescent nanomaterials can be the focus to afford anti-aggregation-based colorimetric and luminescent responses toward specific analytes.
- Many anti-aggregation-based sensory reports lack theoretical supports, which should be addressed using density functional theory (DFT) investigations in future.
Though there are still many unclearly issues requiring further clarification, colorimetric recognition of specified analytes via anti-aggregation is becoming an important research field. Currently, there are many groups working on the development of new anti-aggregation-enabled Au NPs- and Ag NPs-based colorimetric sensory probes to remedy the aforementioned issues. However, the anti-aggregation strategy can be regarded as exceptional for analyte quantification in terms of naked eye detection ability and real-time applicability.
Author Contributions: Literature collection, M.S.: Writing—original draft preparation, M.S.; writing—review and editing, K.W.S.; supervision, K.W.S.; project administration, K.W.S.; funding acquisition, K.W.S. All authors have read and agreed to the published version of the manuscript.
Funding: This research was funded by the Ministry of Science and Technology of Taiwan under the contract No. MOST 111-2112-M-A49-031 and MOST 111-2811-M-A49-528.
Institutional Review Board Statement: Not applicable.
Informed Consent Statement: Not applicable.
Data Availability Statement: Not applicable
Conflicts of Interest: The authors declare no conflict of interest.
References
- Mitra, S.; Chakraborty, A.J.; Tareq, A.M.; Emran, T.B.; Nainu, F.; Khusro, A.; Idris, A.M.; Khandaker, M.U.; Osman, H.; Alhumaydhi, F.A. et al. Impact of Heavy Metals on the Environment and Human Health: Novel Therapeutic Insights to Counter the Toxicity. King Saud Univ. Sci. 2022, 34, 101865.
- Gonçalves, A.R.P.; Paredes, X.; Cristino, A.F.; Santos, F.J.V.; Queirós, C.S.G.P. Ionic Liquids—A Review of Their Toxicity to Living Organisms. J. Mol. Sci. 2021, 22, 5612.
- Hua, Y.; Ma, J.; Li, D.; Wang, R. DNA-Based Biosensors for the Biochemical Analysis: A Review. Biosensors 2022, 12, 183.
- Aktar, W. Md.; Sengupta, D.; Chowdhury, A. Impact of Pesticides Use in Agriculture: Their Benefits and Hazards. Interdisc Toxicol. 2009, 2, 1–12.
- Gianessi, L.P. The Increasing Importance of Herbicides in Worldwide Crop Production. Pest Manag. Sci. 2013, 69, 1099–1105.
- Alberti, G.; Zanoni, C.; Magnaghi, L.R.; Biesuz, R. Gold and Silver Nanoparticle-Based Colorimetric Sensors: New Trends and Applications. Chemosensors 2021, 9, 305.
- Prosposito, P.; Burratti, L.; Venditti, I. Silver Nanoparticles as Colorimetric Sensors for Water Pollutants. Chemosensors 2020, 8, 26.
- Walekar, L.; Dutta, T.; Kumar, P.; Ok, Y.S.; Pawar, S.; Deep, A.; Kim, K.-H. Functionalized Fluorescent Nanomaterials for Sensing Pollutants in the Environment: A Critical Review. TrAC Trends Anal. Chem. 2017, 97, 458–467.
- Bulska, E.; Ruszczyńska, A. Analytical Techniques for Trace Element Determination. Sci. Rev. 2017, 2, 20178002.
- Vervoort, N.; Goossens, K.; Baeten, M.; Chen, Q. Recent Advances in Analytical Techniques for High Throughput Experimentation. Sci. Adv. 2021, 2, 109–127.
- Kreno, L.E.; Leong, K.; Farha, O.K.; Allendorf, M.; Van Duyne, R.P.; Hupp, J.T. Metal–Organic Framework Materials as Chemical Sensors. Rev. 2012, 112, 1105–1125.
- Shellaiah, M.; Sun, K.-W. Progress in Metal-Organic Frameworks Facilitated Mercury Detection and Removal. Chemosensors 2021, 9, 101.
- Auwalu, M.A.; Cheng, S. Diketopyrrolopyrrole Fluorescent Probes, Photophysical and Biological Applications. Chemosensors 2021, 9, 44.
- Shellaiah, M.; Chen, Y.-T.; Thirumalaivasan, N.; Aazaad, B.; Awasthi, K.; Sun, K.W.; Wu, S.-P.; Lin, M.-C.; Ohta, N. Pyrene-Based AIEE Active Nanoprobe for Zn2+ and Tyrosine Detection Demonstrated by DFT, Bioimaging, and Organic Thin-Film Transistor. ACS Appl. Mater. Interfaces 2021, 13, 28610–28626.
- Cichosz, S.; Masek, A.; Zaborski, M. Polymer-Based Sensors: A Review. Test. 2018, 67, 342–348.
- Shellaiah, M.; Simon, T.; Thirumalaivasan, N.; Sun, K.W.; Ko, F.-H.; Wu, S.-P., Cysteamine-Capped Gold-Copper Nanoclusters for Fluorometric Determination and Imaging of Chromium(VI) and Dopamine. Acta 2019, 186, 788.
- Terai, T.; Nagano, T. Fluorescent Probes for Bioimaging Applications. Opin. Chem. Biol. 2008, 12, 515–521.
- Sahoo, S.K.; Crisponi, G. Recent Advances on Iron(III) Selective Fluorescent Probes with Possible Applications in Bioimaging. Molecules 2019, 24, 3267.
- Shellaiah, M.; Awasthi, K.; Chandran, S.; Aazaad, B.; Sun, K.W.; Ohta, N.; Wu, S.-P.; Lin, M.-C. Methylammonium Tin Tribromide Quantum Dots for Heavy Metal Ion Detection and Cellular Imaging. ACS Appl. Nano Mater. 2022, 5, 2859–2874.
- Shellaiah, M.; Sun, K.-W. Pyrene-Based AIE Active Materials for Bioimaging and Theranostics Applications. Biosensors 2022, 12, 550.
- Chang, C.-C.; Chen, C.-P.; Wu, T.-H.; Yang, C.-H.; Lin, C.-W.; Chen, C.-Y. Gold Nanoparticle-Based Colorimetric Strategies for Chemical and Biological Sensing Applications. Nanomaterials 2019, 9, 861.
- Hussain, M.; Nafady, A.; Sirajuddin; Avcı, A.; Pehlivan, E.; Nisar, J.; Sherazi, S.T.H.; Balouch, A.; Shah, M.R.; Almaghrabi, O.A.; Ul-Haq, M.A. Biogenic Silver Nanoparticles for Trace Colorimetric Sensing of Enzyme Disrupter Fungicide Vinclozolin. Nanomaterials 2019, 9, 1604.
- Shellaiah, M.; Simon, T.; Sun, K.W.; Ko, F.-H. Simple Bare Gold Nanoparticles for Rapid Colorimetric Detection of Cr3+ Ions in Aqueous Medium with Real Sample Applications. Actuators B 2016, 226, 44–51.
- Zhao, L.; Zhao, L.; Miao, Y.; Liu, C.; Zhang, C. A Colorimetric Sensor for the Highly Selective Detection of Sulfide and 1,4-Dithiothreitol Based on the In-Situ Formation of Silver Nanoparticles Using Dopamine. Sensors 2017, 17, 626.
- Dawadi, S.; Katuwal, S.; Gupta, A.; Lamichhane, U.; Thapa, R.; Jaisi, S.; Lamichhane, G.; Bhattarai, D.P.; Parajuli, N. Current Research on Silver Nanoparticles: Synthesis, Characterization, and Applications. Nanomater. 2021, 2021, 6687290.
- Shellaiah, M.; Simon, T.; Venkatesan, P.; Sun, K.W.; Ko, F.-H.; Wu, S.-P. Nanodiamonds Conjugated to Gold Nanoparticles for Colorimetric Detection of Clenbuterol and Chromium(III) in Urine. Acta 2017, 185, 74.
- Sanskriti, I.; Upadhyay, K.K., Twinning as a Guiding Factor in Morphological Anisotropy of Silver Nanoparticles Stabilized Over L–DOPA: A Colorimetric Probe for Sulfide in Aqueous Medium. ChemistrySelect 2019, 4, 3803–3810.
- Shellaiah, M.; Thirumalaivasan, N.; Sun, K.W.; Wu, S.-P. A pH Cooperative Strategy for Enhanced Colorimetric Sensing of Cr(III) Ions Using Biocompatible L-Glutamic Acid Stabilized Gold Nanoparticles. J. 2021, 160, 105754.
- Singh, R.; Mehra, R.; Walia, A.; Gupta, S.; Chawla, P.; kumar, H.; Thakur, A.; Kaushik, R.; Kumar, N. Colorimetric Sensing Approaches Based on Silver Nanoparticles Aggregation for Determination of Toxic Metal Ions in Water Sample: A Review. J. Environ. Anal. Chem. , 1–16; Doi: 10.1080/03067319.2021.1873315.
- Sabela, M.; Balme, S.; Bechelany, M.; Janot, J.-M.; Bisetty, K. A Review of Gold and Silver Nanoparticle-Based Colorimetric Sensing Assays. Eng. Mater. 2017, 19, 1700270.
- Guo, L.; Xu, Y.; Ferhan, A.R.; Chen, G.; Kim, D.-H. Oriented Gold Nanoparticle Aggregation for Colorimetric Sensors with Surprisingly High Analytical Figures of Merit. Am. Chem. Soc. 2013, 135, 12338–12345.
- Zhang, L.; Yuan, Y.; Wen, X.; Li, Y.; Cao, C.; Xiong, Q. A Coordination and Ligand Replacement Based Three-Input Colorimetric Logic Gate Sensing Platform for Melamine, Mercury Ions, and Cysteine. RSC Adv. 2015, 5, 59106–59113.
- Wang, N.; Yang, H.-F.; Zhu, X.; Zhang, R.; Wang, Y.; Huang, G.-F.; Zhang, Z. -R. Synthesis of Anti-aggregation Silver Nanoparticles Based on Inositol Hexakisphosphoric Micelles for A Stable Surface Enhanced Raman Scattering Substrate. Nanotechnology 2009, 20, 315603.
- Yang, L.; Wang, N.; Zheng, G. Enhanced Effect of Combining Chlorogenic Acid on Selenium Nanoparticles in Inhibiting Amyloid β Aggregation and Reactive Oxygen Species Formation In Vitro. Nanoscale Res. Lett. 2018, 13, 303.
- Yang, L.; Wang, W.; Chen, J.; Wang, N.; Zheng, G. A Comparative Study of Resveratrol and Resveratrol-Functional Selenium Nanoparticles: Inhibiting Amyloid β Aggregation and Reactive Oxygen Species Formation Properties. Biomed. Mater. Res. A 2018, 106, 3034–3041.
- Li, M.; Shi, P.; Xu, C.; Ren, J.; Qu, X. Cerium Oxide Caged Metal Chelator: Anti-aggregation and Anti-oxidation Integrated H2O2-responsive Controlled Drug Release for Potential Alzheimer's Disease Treatment. Sci. 2013, 4, 2536–2542.
- Ishtikhar, M.; Rahisuddin; Khan, M.V.; Khan, R.H. Anti-aggregation Property of Thymoquinone Induced by Copper-Nanoparticles: A Biophysical Approach. J. Biol. Macromol. 2016, 93, 1174–1182.
- Kong, L.; Zhou, X.; Shi, G.; Yu, Y. Molybdenum Disulfide Nanosheets-Based Fluorescent “Off-to-On” Probe for Targeted Monitoring and Inhibition of β-Amyloid Oligomers. Analyst 2020, 145, 6369–6377.
- Duangdeewong, C.; Choengchan, N.; Wattanasin, P.; Teerasong, S. Direct Determination of Ethanol in Alcoholic Beverages Based on Its Anti-aggregation of Melamine-Silver Nanoparticle Assembly. Talanta 2022, 250, 123751.
- Balali-Mood, M.; Naseri, K.; Tahergorabi, Z.; Khazdair, M.R.; Sadeghi, M. Toxic Mechanisms of Five Heavy Metals: Mercury, Lead, Chromium Cadmium, and Arsenic. Front. Pharmacol. 2021, 12, 643972.
- Lechuga, M.; Fernández-Serrano, M.; Jurado, E.; Núñez-Olea, J.; Ríos, F. Acute Toxicity of Anionic and Non-ionic Surfactants to Aquatic Organisms. Environ. Safety 2016, 125, 1–8.
- Wang, T.; Ramnarayanan, A.; Cheng, H. Real Time Analysis of Bioanalytes in Healthcare, Food, Zoology and Botany. Sensors 2018, 18, 5.
- Dai, J.; Ma, C.; Zhang, P.; Fu, Y.; Shen, B. Recent Progress in the Development of Fuorescent Probes for Detection of Biothiols. Dyes Pig. 2020, 177, 108321.
- Defarge, N.; Spiroux de Vendômois, J.; Séralini, G.E. Toxicity of Formulants and Heavy Metals in Glyphosate-Based Herbicides and Other Pesticides. Rep. 2018, 5, 156–163.
- DeLorenzo, M.E.; Scott, G.I.; Ross, P.E. Toxicity of Pesticides to Aquatic Microorganisms: A Review. Toxicol. Chem. 2001, 20, 84–98.
- Najafzadeh, F.; Ghasemi, F.; Hormozi-Nezhad, M.R. Anti-aggregation of Gold Nanoparticles for Metal Ion Discrimination: A Promising Strategy to Design Colorimetric Sensor Arrays. Actuators B 2018, 270, 545–551.
- Li, Y.; Wu, P.; Xu, H.; Zhang, Z.; Zhong, X. Highly Selective and Sensitive Visualizable Detection of Hg2+ Based on Anti-aggregation of Gold Nanoparticles. Talanta 2011, 84, 508–512.
- Ding, N.; Zhao, H.; Peng, W.; He, Y.; Zhou, Y.; Yuan, L.; Zhang, Y. A Simple Colorimetric Sensor Based on Anti-aggregation of Gold Nanoparticles for Hg2+ Colloids Surf. A 2012, 395, 161–167.
- Lou, T.; Chen, L.; Zhang, C.; Kang, Q.; You, H.; Shen, D.; Chen, L. A Simple and Sensitive Colorimetric Method for Detection of Mercury Ions Based on Anti-aggregation of Gold Nanoparticles. Methods 2012, 4, 488–491.
- Li, Y.-L.; Leng, Y.-M.; Zhang, Y.-J.; Li, T.-H.; Shen, Z.-Y.; Wu, A.-G. A New Simple and Reliable Hg2+ Detection System Based on Anti-aggregation of Unmodified Gold Nanoparticles in the Presence of O-phenylenediamine. Actuators B 2014, 200, 140–146.
- Huang, G.G.; Chen, Y.-T.; Lin, Y.-R. Development of A Gold Nanoparticle Based Anti-aggregation Method for Rapid Detection of Mercury(ii) in Aqueous Solutions. Methods 2014, 6, 5690–5696.
- Zhou, Y.; Dong, H.; Liu, L.; Li, M.; Xiao, K.; Xu, M. Selective and Sensitive Colorimetric Sensor of Mercury (II) Based on Gold Nanoparticles and 4-Mercaptophenylboronic Acid. Actuators B 2014, 196, 106–111.
- Tang, J.; Wu, P.; Hou, X.; Xu, K. Modification-free and N-Acetyl-L-cysteine-Induced Colorimetric Response of AuNPs: A Mechanistic Study and Sensitive Hg2+ Talanta 2016, 159, 87–92.
- Jin, W.; Huang, P.; Wei, G.; Cao, Y.; Wu, F. Visualization and Quantification of Hg2+ Based on Anti-aggregation of Label-free Gold Nanoparticles in the Presence of 2-Mercaptobenzothiazole. Actuators B 2016, 233, 223–229.
- Rajeshwari, A.; Karthiga, D.; Chandrasekaran, N.; Mukherjee, A. Anti-aggregation-Based Spectrometric Detection of Hg(II) at Physiological pH Using Gold Nanorods. Sci. Eng. C 2016, 67, 711–716.
- Sun, X.; Liu, R.; Liu, Q.; Fei, Q.; Feng, G.; Shan, H.; Huan, Y. Colorimetric Sensing of Mercury (II) Ion Based on Anti-aggregation of Gold Nanoparticles in the Presence of Hexadecyl Trimethyl Ammonium Bromide. Actuators B 2018, 260, 998–1003.
- Kataria, R.; Sethuraman, K.; Vashisht, D.; Vashisht, A.; Mehta, S.K.; Gupta, A. Colorimetric Detection of Mercury Ions Based on Anti-aggregation of Gold Nanoparticles Using 3, 5-Dimethyl-1-thiocarboxamidepyrazole. J. 2019, 148, 299–305.
- Mao, L.; Wang, Q.; Luo, Y.; Gao, Y., Detection of Ag+ Ions Via an Anti-aggregation Mechanism Using Unmodified Gold nanoparticles in the Presence of Thiamazole. Talanta 2021, 222, 121506.
- Selva Sharma, A.; SasiKumar, T.; Ilanchelian, M. A Rapid and Sensitive Colorimetric Sensor for Detection of Silver Ions Based on the Non-aggregation of Gold Nanoparticles in the Presence of Ascorbic Acid. Cluster Sci. 2018, 29, 655–662.
- Safavi, A.; Ahmadi, R.; Mohammadpour, Z. Colorimetric Sensing of Silver ion Based on Anti Aggregation of Gold Nanoparticles. Actuators B 2017, 242, 609–615.
- Gao, Q.; Zheng, Y.; Song, C.; Lu, L.-Q.; Tian, X.-K.; Xu, A.-W. Selective and Sensitive Colorimetric Detection of Copper Ions Based on Anti-aggregation of the Glutathione-Induced Aggregated Gold Nanoparticles and Its Application for Determining Sulfide Anions. RSC Adv. 2013, 3, 21424–21430.
- Hormozi-Nezhad, M.R.; Abbasi-Moayed, S. A Sensitive and Selective Colorimetric Method for Detection of Copper Ions Based on Anti-aggregation of Unmodified Gold Nanoparticles. Talanta 2014, 129, 227–232.
- Deng, H.-H.; Huang, K.-Y.; Fang, Q.-H.; Lv, Y.-P.; He, S.-B.; Peng, H.-P.; Xia, X.-H.; Chen, W. Schiff Base and Lewis Acid-Base Interaction-Regulated Aggregation/Dispersion of Gold Nanoparticles for Colorimetric Recognition of Rare-Earth Sc3+ Sens. Actuators B 2020, 311, 127925.
- Plaisen, S.; Cheewasedtham, W.; Rujiralai, T. Robust Colorimetric Detection Based on the Anti-aggregation of Gold Nanoparticles for Bromide in Rice Samples. RSC Adv. 2018, 8, 21566–21576.
- Chen, L.; Lu, W.; Wang, X.; Chen, L. A Highly Selective and Sensitive Colorimetric Sensor for Iodide Detection Based on Anti-aggregation of Gold Nanoparticles. Actuators B 2013, 182, 482–488.
- Zhou, G.; Zhao, C.; Pan, C.; Li, F. Highly Sensitive and Selective Colorimetric Detection of Iodide Based on Anti-Aggregation of Gold Nanoparticles. Methods 2013, 5, 2188–2192.
- Rasouli, Z.; Ghavami, R. Colorimetric Sensing of Iodide by the Competitive Interactions in the Surface of Gold Nanoparticles with the Simultaneous Aggregation/ Anti-Aggregation Mechanisms in Edible Salts. Current Anal. Chem. 2018, 14, 539–547.
- Peng, R.; He, H.; Wang, Q.; Yan, X.; Yu, Q.; Qin, H.; Lei, Y.; Luo, L.; Feng, Y. Cu(Ⅱ) Triggering Redox-regulated Anti-aggregation of Gold Nanoparticles for Ultrasensitive Visual Sensing of Iodide. Chim. Acta 2018, 1036, 147–152.
- Pournaghi, A.; Keshvari, F.; Bahram, M. Colorimetric Determination of Iodine Based on Highly Selective and Sensitive Anti-aggregation Assay. Iran. Chem. Soc. 2019, 16, 143–149.
- Deng, H.-H.; Wu, C.-L.; Liu, A.-L.; Li, G.-W.; Chen, W.; Lin, X.-H. Colorimetric Sensor for Thiocyanate Based on Anti-aggregation of Citrate-Capped Gold Nanoparticles. Actuators B 2014, 191, 479–484.
- Song, J.; Huang, P.-C.; Wan, Y.-Q.; Wu, F.-Y. Colorimetric Detection of Thiocyanate Based on Anti-aggregation of Gold Nanoparticles in the Presence of Cetyltrimethyl Ammonium Bromide. Actuators B 2016, 222, 790–796.
- Zhao, Y.; Liu, R.; Cui, X.; Fu, Q.; Yu, M.; Fei, Q.; Feng, G.; Shan, H.; Huan, Y. Colorimetric Sensor for Thiocyanate Based on Anti-aggregation of Gold Nanoparticles in the Presence of 2-Aminopyridine. Sci. 2020, 36, 1165–1169.
- Lu, L.; Zhang, J.; Yang, X. Simple and Selective Colorimetric Detection of Hypochlorite Based on Anti-aggregation of Gold Nanoparticles. Actuators B 2013, 184, 189–195.
- Liu, W.; Du, Z.; Qian, Y.; Li, F. A Specific Colorimetric Probe for Phosphate Detection Based on Anti-aggregation of Gold Nanoparticles. Actuators B 2013, 176, 927–931.
- Ye, Y.; Guo, Y.; Yue, Y.; Zhang, Y. Facile Colorimetric Detection of Nitrite Based on Anti-Aggregation of Gold Nanoparticles. Methods 2015, 7, 4090–4096.
- Xu, H.; Wang, Y.; Huang, X.; Li, Y.; Zhang, H.; Zhong, X. Hg2+-Mediated Aggregation of Gold Nanoparticles for Colorimetric Screening of Biothiols. Analyst 2012, 137, 924–931.
- Li, Z.-J.; Zheng, X.-J.; Zhang, L.; Liang, R.-P.; Li, Z.-M.; Qiu, J.-D. Label-Free Colorimetric Detection of Biothiols Utilizing SAM and Unmodified Au Nanoparticles. Bioelectron. 2015, 68, 668–674.
- Li, Y.; Wu, P.; Xu, H.; Zhang, H.; Zhong, X. Anti-aggregation of Gold Nanoparticle-Based Colorimetric Sensor for Glutathione with Excellent Selectivity and Sensitivity. Analyst 2011, 136, 196–200.
- Li, J.-F.; Huang, P.-C.; Wu, F.-Y. Specific pH Effect for Selective Colorimetric Assay of Glutathione Using Anti-aggregation of Label-Free Gold Nanoparticles. RSC Adv. 2017, 7, 13426–13432.
- Li, J.-F.; Huang, P.-C.; Wu, F.-Y. Highly Selective and Sensitive Detection of Glutathione Based on Anti-aggregation of Gold Nanoparticles via pH Regulation. Actuators B 2017, 240, 553–559.
- Yuan, L.-F.; He, Y.-J.; Zhao, H.; Zhou, Y.; Gu, P. Colorimetric Detection of D-Amino Acids Based on Anti-aggregation of Gold Nanoparticles. Chinese Chem. Lett. 2014, 25, 995–1000.
- Huang, P.-C.; Gao, N.; Li, J.-F.; Wu, F.-Y. Colorimetric Detection of Methionine Based on Anti-aggregation of Gold Nanoparticles in the Presence of Melamine. Actuators B 2018, 255, 2779–2784.
- Keshvari, F.; Bahram, M.; Farhadi, K. A Selective, Sensitive and Label-Free Visual Assay of Fructose Using Anti-aggregation of Gold Nanoparticles as A Colorimetric Probe. Chinese Chem. Lett. 2016, 27, 847–851.
- Kim, H.-M.; Kim, W.-J.; Kim, K.-O.; Park, J.-H.; Lee, S.-K. Performance Improvement of A Glucose Sensor Based on Fiber Optic Localized Surface Plasmon Resonance and Anti-aggregation of the Non-Enzymatic Receptor. Alloys Comp. 2021, 884, 161140.
- Liu, S.; Du, Z.; Li, P.; Li, F. Sensitive Colorimetric Visualization of Dihydronicotinamide Adenine Dinucleotide Based on Anti-aggregation of Gold nanoparticles Via Boronic Acid–Diol Binding. Bioelectron. 2012, 35, 443–446.
- Sang, F.; Zhang, X.; Liu, J.; Yin, S.; Zhang, Z. A Label-Free Hairpin Aptamer Probe for Colorimetric Detection of Adenosine Triphosphate Based on the Anti-aggregation of Gold Nanoparticles. Acta A 2019, 217, 122–127.
- Zhang, Z.; Ye, X.; Liu, Q.; Hu, C.; Yun, J.; Liu, R.; Liu, Y. Colorimetric Nucleic Acid Detection Based on Gold Nanoparticles with Branched DNA. Nano 2020, 15, 2050110.
- Khurana, S.; Kukreti, S.; Kaushik, M. Designing A Two-Stage Colorimetric Sensing Strategy Based on Citrate Reduced Gold Nanoparticles: Sequential Detection of Sanguinarine (Anticancer Drug) and Visual Sensing of DNA. Acta A 2021, 246, 119039.
- Zhang, C.; Liang, X.; You, T.; Yang, N.; Gao, Y.; Yin, P. An Ultrasensitive “Turn-Off” SERS Sensor for Quantitatively Detecting Heparin Based on 4-Mercaptobenzoic Acid Functionalized Gold Nanoparticles. Methods 2017, 9, 2517–2522.
- Ma, X.; Kou, X.; Xu, Y.; Yang, D.; Miao, P. Colorimetric Sensing Strategy for Heparin Assay Based on PDDA-Induced Aggregation of Gold Nanoparticles. Nanoscale Adv. 2019, 1, 486–489.
- Kim, H.Y.; Lee, D.; Ryu, K.-Y.; Choi, I., A Gold Nanoparticle-Mediated Rapid In Vitro Assay of Anti-aggregation Reagents for Amyloid β and Its Validation. Commun. 2017, 53, 4449–4452.
- Kim, H.Y.; Kwon, J.A.; Kang, T.; Choi, I. Rapid and High-Throughput Colorimetric Screening for Anti-aggregation Reagents of Protein Conformational Diseases by Using Gold Nanoplasmonic Particles. Nanotechnol. Biol. Med. 2017, 13, 1575–1585.
- Pasieka, A.; Panek, D.; Szałaj, N.; Espargaró, A.; Więckowska, A.; Malawska, B.; Sabaté, R.; Bajda, M. Dual Inhibitors of Amyloid-β and Tau Aggregation with Amyloid-β Disaggregating Properties: Extended In Cellulo, In Silico, and Kinetic Studies of Multifunctional Anti-Alzheimer’s Agents. ACS Chem. Neurosci. 2021, 12, 2057–2068.
- Chang, C.-C.; Chen, C.-Y.; Chen, C.-P.; Lin, C.-W. Facile Colorimetric Detection of Human Chorionic Gonadotropin Based on the Peptide-Induced Aggregation of Gold Nanoparticles. Methods 2015, 7, 29–33.
- Wang, S.-T.; Lin, Y.; Spicer, C.D.; Stevens, M.M. Bio-Inspired Maillard-Like Reactions Enable A Simple and Sensitive Assay for Colorimetric Detection of Methylglyoxal. Commun. 2015, 51, 11026–11029.
- Su, R.; Xu, J.; Luo, Y.; Li, Y.; Liu, X.; Bie, J.; Sun, C. Highly Selective and Sensitive Visual Detection of Oxytetracycline Based on Aptamer Binding-Mediated the Anti-Aggregation of Positively Charged Gold Nanoparticles. Lett. 2016, 180, 31–34.
- Chen, Z.; Chen, L.; Lin, L.; Wu, Y.; Fu, F. A Colorimetric Sensor for the Visual Detection of Azodicarbonamide in Flour Based on Azodicarbonamide-Induced Anti-Aggregation of Gold Nanoparticles. ACS Sens. 2018, 3, 2145–2151.
- Liu, G.; Zhang, R.; Li, L.; Huang, X.; Li, T.; Lu, M.; Xu, D.; Wang, J. Anti-Agglomeration Behavior and Sensing Assay of Chlorsulfuron Based on Acetamiprid-Gold Nanoparticles. Nanomaterials 2018, 8, 499.
- Liu, G.; Zhang, R.; Huang, X.; Li, L.; Liu, N.; Wang, J.; Xu, D. Visual and Colorimetric Sensing of Metsulfuron-Methyl by Exploiting Hydrogen Bond-Induced Anti-Aggregation of Gold Nanoparticles in the Presence of Melamine. Sensors 2018, 18, 1595.
- Keshvari, F.; Bahram, M. Selective, Sensitive and Reliable Colorimetric Sensor for Catechol Detection Based on Anti-aggregation of Unmodified Gold Nanoparticles Utilizing Boronic Acid–Diol Reaction: Optimization by Experimental Design M J. Iran. Chem. Soc. 2017, 14, 977–984.
- Chen, N.; Liu, H.; Zhang, Y.; Zhou, Z.; Fan, W.; Yu, G.; Shen, Z.; Wu, A. A Colorimetric Sensor Based on Citrate-Stabilized AuNPs for Rapid Pesticide Residue Detection of Terbuthylazine and Dimethoate. Actuators B 2018, 255, 3093–3101.
- Li, D.; Wang, S.; Wang, L.; Zhang, H.; Hu, J. A Simple Colorimetric Probe Based on Anti-aggregation of AuNPs for Rapid and Sensitive Detection of Malathion in Environmental Samples. Bioanal. Chem. 2019, 411, 2645–2652.
- Chungchai, W.; Amatatongchai, M.; Meelapsom, R.; Seebunrueng, K.; Suparsorn, S.; Jarujamrus, P. Development of A Novel Three-Dimensional Microfluidic Paper-Based Analytical Device (3D-μPAD) for Chlorpyrifos Detection Using Graphene Quantum-dot Capped Gold Nanocomposite for Colorimetric Assay. J. Environ. Anal. Chem. 2020, 100, 1160–1178.
- Liu, K.; Jin, Y.; Wu, Y.; Liang, J. Simple and Rapid Colorimetric Visualization of Tetramethylthiuram Disulfide (Thiram) Sensing Based on Anti-aggregation of Gold Nanoparticles. Food Chem. 2022, 384, 132223.
- Zhou, Z.; Zhang, Y.; Kang, J.; Dong, C.; Chen, N.; Li, X.; Guo, Z.; Wu, A. Detection of Herbicide Glyphosates Based on An Anti-aggregation Mechanism by Using Unmodified Gold Nanoparticles in the Presence of Pb2+. Methods 2017, 9, 2890–2896.
- Duan, J.; Yin, H.; Wei, R.; Wang, W. Facile Colorimetric Detection of Hg2+ Based on Anti-aggregation of Silver Nanoparticles. Bioelectron. 2014, 57, 139–142.
- Ye, Y.; Guo, Y.; Yue, Y.; Huang, H.; Zhao, L.; Gao, Y.; Zhang, Y. Colorimetric Sensing of Copper Ions Based on the Anti-aggregation of Unmodified Silver Nanoparticles in the Presence of 1,4-D Anal. Methods 2015, 7, 566–572.
- He, Y.; Zhang, X. Ultrasensitive Colorimetric Detection of Manganese(II) Ions Based on Anti-aggregation of Unmodified Silver Nanoparticles. Sens. Actuators B 2016, 222, 320–324.
- Basiri, S.; Mehdinia, A.; Jabbari, A. Green Synthesis of Reduced Graphene Oxide-Ag Nanoparticles as A Dual-Responsive Colorimetric Platform for Detection of Dopamine and Cu2+. Sens. Actuators B 2018, 262, 499–507.
- Bothra, S.; Kumar, R.; Pati, R.K.; Kuwar, A.; Choi, H.-J.; Sahoo, S.K. Virgin Silver Nanoparticles as Colorimetric Nanoprobe for Simultaneous Detection of Iodide and Bromide Ion in Aqueous M Spectrochim. Acta A 2015, 149, 122–126.
- Motahhari, A.; Abdolmohammad-Zadeh, H.; Farhadi, K. Development of A New Fluoride Colorimetric Sensor Based on Anti-aggregation of Modified Silver Nanoparticles. Anal. Bioanal. Chem. Res. 2021, 8, 79–89.
- Dong, C.; Ma, X.; Qiu, N.; Zhang, Y.; Wu, A. An Ultra-Sensitive Colorimetric Sensor Based on Smartphone for Pyrophosphate Determination. Actuators B 2021, 329, 129066.
- Pinyorospathum, C.; Rattanarat, P.; Chaiyo, S.; Siangproh, W.; Chailapakul, O. Colorimetric Sensor for Determination of Phosphate Ions Using Anti-aggregation of 2-Mercaptoethanesulfonate-Modified Silver Nanoplates and Europium Ions. Actuators B 2019, 290, 226–232.
- Chen, L.; Fu, X.; Li, J. Ultrasensitive Surface-Enhanced Raman Scattering Detection of Trypsin Based on Anti-aggregation of 4-Mercaptopyridine-Functionalized Silver Nnanoparticles: An Optical Sensing Platform Toward Proteases. Nanoscale 2013, 5, 5905–5911.
- Trisaranakul, W.; Chompoosor, A.; Maneeprakorn, W.; Nacapricha, D.; Choengchan, N.; Teerasong, S. A Simple and Rapid Method Based on Anti-aggregation of Silver Nanoparticles for Detection of Poly(diallyldimethylammonium chloride) in Tap Water. Sci. 2016, 32, 769–773.
- Shellaiah, M.; Sun, K.W. Review on Nanomaterial-Based Melamine Detection. Chemosensors 2019, 7, 9.
- Abdel-Lateef, M.A.; Almahri, A.; Alzahrani, E.; Pashameah, R.A.; Abu-Hassan, A.A.; El Hamd, M.A. Sustainable PVP-Capped Silver Nanoparticles as a Free-Standing Nanozyme Sensor for Visual and Spectrophotometric Detection of Hg2+ in Water Samples: A Green Analytical Method. Chemosensors 2022, 10, 358.
- Mochi, F.; Burratti, L.; Fratoddi, I.; Venditti, I.; Battocchio, C.; Carlini, L.; Iucci, G.; Casalboni, M.; De Matteis, F.; Casciardi, S. et al., Plasmonic Sensor Based on Interaction between Silver Nanoparticles and Ni2+ or Co2+ in Water. Nanomaterials 2018, 8, 488.
- Rossi, A.; Zannotti, M.; Cuccioloni, M.; Minicucci, M.; Petetta, L.; Angeletti, M.; Giovannetti, R. Silver Nanoparticle-Based Sensor for the Selective Detection of Nickel Ions. Nanomaterials 2021, 11, 1733.
- Liu, X.; Wang, J.; Wang, Y.; Huang, C.; Wang, Z.; Liu, L. In Situ Functionalization of Silver Nanoparticles by Gallic Acid as a Colorimetric Sensor for Simple Sensitive Determination of Melamine in Milk. ACS Omega 2021, 6, 23630–23635.
- Sharma, R.; Dhillon, A.; Kumar, D. Mentha-Stabilized Silver Nanoparticles for High-Performance Colorimetric Detection of Al(III) in Aqueous Systems. Rep. 2018, 8, 5189.
- Omar, N.A.S.; Fen, Y.W.; Irmawati, R.; Hashim, H.S.; Ramdzan, N.S.M.; Fauzi, N.I.M., A Review on Carbon Dots: Synthesis, Characterization and Its Application in Optical Sensor for Environmental Monitoring. Nanomaterials 2022, 12, 2365.
- Shellaiah, M.; Sun, K.W. Review on Sensing Applications of Perovskite Nanomaterials. Chemosensors 2020, 8, 55.
- Anas, N.A.A.; Fen, Y.W.; Omar, N.A.S.; Daniyal, W.M.E.M.M.; Ramdzan, N.S.M.; Saleviter, S. Development of Graphene Quantum Dots-Based Optical Sensor for Toxic Metal Ion Detection. Sensors 2019, 19, 3850.
- Shellaiah, M.; Sun, K.W. Luminescent Metal Nanoclusters for Potential Chemosensor Applications. Chemosensors 2017, 5, 36.
- Shellaiah, M.; Thirumalaivasan, N.; Aazaad, B.; Awasthi, K.; Sun, K.W.; Wu, S.-P.; Lin, M.-C.; Ohta, N. An AIEE Active Anthracene-Based Nanoprobe for Zn2+ and Tyrosine Detection Validated by Bioimaging Studies. Chemosensors 2022, 10, 381.
- Shellaiah, M.; Simon, T.; Srinivasadesikan, V.; Lin, C.-M.; Sun, K.W.; Ko, F.-H.; Lin, M.-C.; Lin, H.-C. Novel Pyrene Containing Monomeric and Dimeric Supramolecular AIEE Active Nano-Probes Utilized in Sselective “Off–On” Trivalent Metal and Highly Acidic pH Sensing with Live Cell A J. Mater. Chem. C 2016, 4, 2056–2071.
- Olean-Oliveira, A.; Oliveira Brito, G.A.; Cardoso, C.X.; Teixeira, M.F.S. Nanocomposite Materials Based on Electrochemically Synthesized Graphene Polymers: Molecular Architecture Strategies for Sensor Applications. Chemosensors 2021, 9, 149.
- Shellaiah, M.; Simon, T.; Venkatesan, P.; Sun, K.W.; Ko, F.-H.; Wu, S.-P. Cysteamine-Modified Diamond Nanoparticles Applied in Cellular Imaging and Hg2+ Ions Detection. Surf. Sci. 2019, 465, 340–350.
- Shellaiah, M.; Sun, K.W. Conjugation of cysteamine functionalized nanodiamond to gold nanoparticles for pH enhanced colorimetric detection of Cr3+ ions demonstrated by real water sample analysis. Acta A 2022, 286, 121962.
- Nguyen, V.-N.; Ha, J.; Cho, M.; Li, H.; Swamy, K.M.K.; Yoon, J. Recent Developments of BODIPY-Based Colorimetric and Fluorescent Probes for the Detection of Reactive Oxygen/Nitrogen Species and Cancer diagnosis. Coord. Chem. Rev. 2021, 439, 213936.
- Arumugaperumal, R.; Srinivasadesikan, V.; Lin, M.-C.; Shellaiah, M.; Shukla, T.; Lin, H.-C. Facile Rhodamine-Based Colorimetric Sensors for Sequential Detections of Cu(ii) Ions and Pyrophosphate (P2O74−) A RSC Adv. 2016, 6, 106631–106640.
- Liu, B.; Zhuang, J.; Wei, G. Recent Advances in the Design of Colorimetric Sensors for Environmental M Environ. Sci. Nano 2020, 7, 2195–2213.
- Fang, H.-P.; Shellaiah, M.; Singh, A.; Raju, M.V.R.; Wu, Y.-H.; Lin, H.-C. Naked Eye and Fluorescent Detections of Hg2+ Ions and Cysteine via J-Aggregation and Deaggregation of a Perylene Bisimide D Sens. Actuators B 2014, 194, 229–237.
- Shellaiah, M.; Thirumalaivasan, N.; Aazaad, B.; Awasthi, K.; Sun, K.W.; Wu, S.-P.; Lin, M.-C.; Ohta, N. Novel Rhodamine Probe for Colorimetric and Fluorescent Detection of Fe3+ Ions in Aqueous Media with Cellular Imaging. Acta A 2020, 242, 118757.
- Chen, S.; Xue, Z.; Gao, N.; Yang, X.; Zang, L. Perylene Diimide-Based Fluorescent and Colorimetric Sensors for Environmental Detection. Sensors 2020, 20, 917.
- Ericson, M.N.; Shankar, S.K.; Chahine, L.M.; Omary, M.A.; Herbing, I.H.v.; Marpu, S.B. Development of Neutral Red as a pH/pCO2 Luminescent Sensor for Biological Systems. Chemosensors 2021, 9, 210.