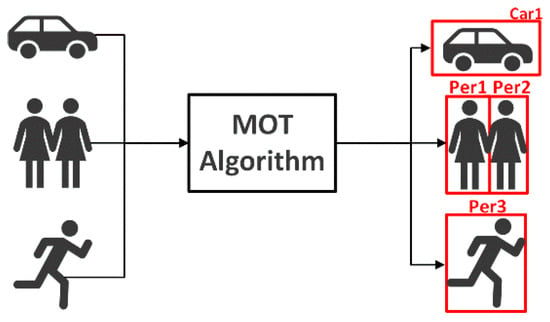
Multi-target tracking is an advanced visual work in computer vision, which is essential for understanding the autonomous driving environment. Due to the excellent performance of deep learning in visual object tracking, many state-of-the-art multi-target tracking algorithms have been developed.
- autonomous driving
- deep learning
- visual multi-object tracking
- transformer
1. Introduction

2. Overview of Deep Learning-Based Visual Multi-Object Tracking
Deep learning-based visual multi-object tracking systems have several overview techniques from various angles. The methods for visual multi-object tracking based on deep learning are outlined here in terms of algorithm classification, related data sets, and algorithm assessment.2.1. Visual Multi-Object Tracking Algorithm Based on Deep Learning
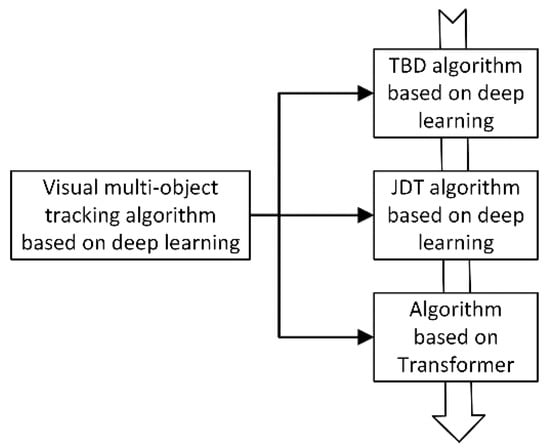
The tracking algorithm based on detection results has evolved and has quickly taken over as the standard framework for multi-object tracking due to the rapid advancement of object detection algorithm performance [5][7]. The TBD sub-modules, such as feature extraction, can be included in the object detection network, though, from the standpoint of the deep neural network’s structure. Joint detection and tracking, or JDT, using a deep network framework to perform visual multi-object tracking, has emerged as a new development trend based on TBD neutron module fusion [6][7][11,12]. The attention mechanism has been incorporated into computer vision systems recently because it has the benefit of efficiently capturing the region of interest in the image, enhancing the performance of the entire network [8][9][10][11][13,14,15,16]. It is used to solve various vision problems, including multi-object tracking. The specific classification structure for the three types of tracking frameworks is shown in Figure 23.
| Tracking Algorithm Framework |
Principle | Advantage | Disadvantage |
|---|---|---|---|
| TBD | All objects of interest are detected in each frame of the video, and then they are associated with the detected objects in the previous frame to achieve the effect of tracking | Simple structure and strong interpretability | Over-reliance on object detector performance; bloated algorithm design |
| JDT | End-to-end trainable detection box paradigm to jointly learn detection and appearance features | Multi-module joint learning, weight sharing | Local receptive field, when the object is occluded, the tracking effect is not good |
| Tranformer-based | Transformer encode-decoder architecture to obtain global and rich contextual interdependcies for tracking | Paraller coputing; rich global and contextual information; the tracking accuracy and accuracy have been greatly improved,with great potential in the filed of computer vision | The parameters are too large and the computational overhead is high; the Transformer-based network has not been fully adapted to the filed of computer vision |
2.2. MOT Datasets
Deep learning has the benefit over more conventional machine learning techniques in that it can automatically identify data attributes that are pertinent to a specific task. For deep learning-based computer vision algorithms, data sets are crucial. The datasets and traits that are frequently utilized in the field of automatic driving tracking are outlined in the following. Due to their frequent updates and closer resemblance to the actual scene, the MOT datasets [20][21] raise the most concerns in the field of visual multi-object tracking. On the MOT dataset, other cutting-edge tracking methods are also tested.Deep learning has the benefit over more conventional machine learning techniques in that it can automatically identify data attributes that are pertinent to a specific task. For deep learning‐based computer vision algorithms, data sets are crucial. The datasets and traits that are frequently utilized in the field of automatic driving tracking are outlined in the following. Due to their frequent updates and closer resemblance to the actual scene, the MOT datasets [25,26]raise the most concerns in the field of visual multi‐object track‐ing. On the MOT dataset, other cutting‐edge tracking methods are also tested.
The MOT16 Dataset[25] is used exclusively for tracking pedestrians. There are a total of 14 videos, 7 practice sets, and 7 test sets. These videos were created using a variety of techniques, including fixed and moving cameras, as well as various shooting perspectives. Additionally, the shooting circumstances vary, depending on whether it is day or night and the weather. The MOT16 detector, called DPM, performs better in the area of detecting pedestrians.
The MOT16 dataset [20] is used exclusively for tracking pedestrians. There are a total of 14 videos, 7 practice sets, and 7 test sets. These videos were created using a variety of techniques, including fixed and moving cameras, as well as various shooting perspectives. Additionally, the shooting circumstances vary, depending on whether it is day or night and the weather. The MOT16 detector, called DPM, performs better in the area of detecting pedestrians. Thatase video content of the MOT17 dataset [20] [25]is the same as that of MOT16, but it also provides two detector detection results, namely SDP and Faster R-‐CNN, which have more accurate ground-‐truth annotations. The MOT20 dDataset[26] [21] has 8 video sequences, 4 training sets and 4 testing sets, and the pedestrian density is further increased, with an average of 246 pedestrians per frame. The KITTI dataset [22][23] is currently the largest dataset for evaluating computer vision algorithms in autonomous driving scenarios. These data are used to evaluate 3D object detection and tracking, visual odometry, evaluation of stereo images, and optical flow images.The KITTI dataset[27,28]is currently the largest dataset for evaluating computer vision algorithms in autonomous driving scenarios. These data are used to evaluate 3D object detection and tracking, visual odometry, evaluation of stereo images, and optical flow images.
The NuScenes dataset[29] provides a large dataset of full sensor data for autonomous vehicles, including six cameras, one lidar, five radars, as well as GPS and IMU. Compared with the KITTI dataset, it includes more than seven times more object annotations. For each scene, its key frames are selected for annotation, and the annotation rate is 2 Hz. However, it is worth noting that since 23 types of objects are marked, the class‐ The imbalance problem will be more serious
The NuScenes dataset [24] provides a large dataset of full sensor data for autonomous vehicles, including six cameras, one lidar, five radars, as well as GPS and IMU. Compared with the KITTI dataset, it includes more than seven times more object annotations. For each scene, its key frames are selected for annotation, and the annotation rate is 2 Hz. However, it is worth noting that since 23 types of objects are marked, the class- The imbalance problem will be more serious. The Waymo dataset [25] is collected with five LiDAR and five high-resolution pinhole cameras. The entire dataset contains 1150 scenes, which are divided into 1000 training sets and 150 test sets, with a total of about 12 million LiDAR annotation boxes and approx. 12 million image annotation boxes.The Waymo dataset[30] is collected with five LiDAR and five high‐resolution pinhole cameras. The entire dataset contains 1150 scenes, which are divided into 1000 training sets and 150 test sets, with a total of about 12 million LiDAR annotation boxes and approx. 12 million image annotation boxes.
The Mapillary Traffic sign dataset [26] is the largest and most diverse traffic sign dataset in the world, which can be used for research on the automatic detection and classification of traffic signs in autonomous driving.The Mapillary Traffic sign dataset[31] is the largest and most diverse traffic sign dataset in the world, which can be used for research on the automatic detection and classification of traffic signs in autonomous driving.
To perform visual multi‐object tracking tasks, we the dgather and introduce the datasets are listed in Table 23. Most detection and tracking elements in data collection are related to autos and pedestrians, which helps enhance autonomous driving.
| Ref. | Datasets | Year | Feature | DOI/URL |
|---|---|---|---|---|
| [20][21][27][25,26,32 ] | MOT15,, 16,17,,17,20 | 2016–2020 | Sub datasets containing multiple different camera angles and scenes | https://doi.org/10.48550/arXiv.1504.01942 https://doi.org/10.48550/arXiv.1504.01942 https://motchallenge.net/https://motchallenge.net/ |
| [22][23][27,28 ] | KITTI-Tracking | 2012 | Provides annotations for cars and pedestrians, scene objects are sparse | https://doi.org/10.1177/0278364913491297 https://www.cvlibs.net/datasets/kitti/eval_tracking.php https://doi.org/10.1177/0278364913491297 https://www.cvlibs.net/datasets/kitti/eval_tracking.php |
| [24][29] | NuScenes | 2019 | Dense traffic and challenging driving conditions | https://doi.org/10.48550/arXiv.1903.11027 https://www.nuscenes.org/ https://doi.org/10.48550/arXiv.1903.11027 https://www.nuscenes.org/ |
| [25][30] | Waymo | 2020 | Diversified driving environment, dense label information | https://doi.org/10.48550/arXiv.1912.04838 https://waymo.com/open/data/motion/tfexample https://doi.org/10.48550/arXiv.1912.04838 https://waymo.com/open/data/motion/tfexample |
2.3. MOT Evaluating Indicator
Setting realistic and accurate evaluation metrics is essential for comparing the effectiveness of visual multi-‐object tracking algorithms in an unbiased and fair manner. The three criteria that make up the multi-‐object tracking assessment indicators are if the object detection is real-‐time, whether the predicted position matches the actual position, and whether each object maintains a distinct ID [28][33]. MOT Challenge offers recognized MOT evaluation metrics.
MOTA (Multi‐Object‐Tracking Accuracy): the accuracy of multi‐object tracking is used to count the accumulation of errors in tracking, including the number of tracking objects and whether they match:
where FN (False Negative) is the number of detection frames that do not match the prediction frame; FP (False positive) is the number of prediction frames that do not match the detection frame; IDSW (ID Switch) is the object ID change the number of times; GT(Ground Truth) is the number of tracking objects.
MOTP (Multi‐Object‐Tracking Precision): the accuracy of multi‐object tracking, which is used to evaluate whether the object position is accurately positioned.
where Ct is the number of matches between the object and the predicted object in the t‐th frame; Bt(i) is the distance between the corresponding position of the object in the t‐th frame and the predicted position, also known as the matching error.
AMOTA (Average Multiple Object Tracking Accuracy): summarize MOTA over all object confidence thresholds instead of using a single threshold. Similar to mAP for object detection, it is used to evaluate the overall accurate performance of the tracking algorithm under all thresholds to improve algorithm robustness. AMOTA can be calculated by integrating MOTA under the recall curve, using interpolation to approximate the integral in order to simplify the calculation.
where L represents the number of recall values (integration confidence threshold), the higher the L, the more accurate the approximate integral. AMOTA represents the multi‐object tracking accuracy at a specific recall value r.
AMOTP (Average Multi‐object Tracking Precision): The same calculation method as AMOTA, with recall as the abscissa and MOTP as the ordinate, use the interpolation method to obtain AMOTP.
IDF1 (ID F1 score): measures the difference between the predicted ID and the correct ID.
MT (Mostly Tracked): the number of objects that are successfully tracked 80% of the time as a percentage of all tracked objects.
ML (Mostly Lost): the percentage of the number of objects that satisfy the tracking success 20% of the time out of all the objects tracked.
FM (Fragmentation): evaluate tracking integrity, defined as FM, counted whenever a trajectory changes its state from tracked to untracked, and the same trajectory is tracked at a later point in time.
HOTA (Higher Order Metric): A higher order metric for evaluating MOT proposed by [29][34]. Previous metrics overemphasized the importance of detection or association. This evaluation metric explicitly balances the effects of performing accurate detection, association, and localization into a unified metric for comparing trackers. HOTA scores are more consistent with human visual evaluations.
where α is the IoU threshold, and c is the number of positive sample trajectories. In the object tracking experiment, there are predicted detection trajectories and ground truth trajectories. The intersection between the two trajectories is called true positive association(TPA), and the trajectory outside the intersection in the predicted trajectory is called false positive association (FPA). Detections outside the intersection in ground truth trajectories are false negative associations (FNA).
