Limiting an essential nutrient has a profound impact on microbial growth. The notion of growth under limited conditions was first described using simple Monod kinetics proposed in the 1940s. Different operational modes (chemostat, fed-batch processes) were soon developed to address questions related to microbial physiology and cell maintenance and to enhance product formation. With more recent developments of metabolic engineering and systems biology, as well as high-throughput approaches, the focus of current engineers and applied microbiologists has shifted from these fundamental biochemical processes.
- chemostat
- Escherichia coli
- fed-batch
- metabolic engineering
1. Introduction
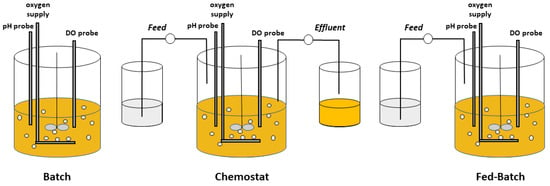
2. Chemostat Processes
3. Fed-Batch Processes
Fed-batch is a semi-continuous process in which one or more nutrients are supplied to the growing microbial culture with or without periodic withdrawal [32][11]. A fed-batch process can be implemented so that nutrients are intermittently added to the reactor and are always in excess from the perspective of the cells (i.e., relative to KS), resulting in a process physiologically similar to a batch process. Such a culture allows prolonged growth at µmax and can be considered a non-limited-nutrient fed-batch or a repeated fed-batch, although the latter term is often applied to a fill-and-draw process in which a portion of culture is periodically withdrawn and fresh nutrients supplied [33][46]. This type of fed-batch process is particularly beneficial in cases for which a high concentration of a particular nutrient inhibits microbial growth, since that nutrient can be maintained below its inhibitory concentration while achieving a near maximal growth rate [34][35][47,48]. Alternatively, a nutrient-starved fed-batch is a common process which involves growing a culture first with ample nutrients, and then in a subsequent cycle, supplying the culture with a feed in which at least one essential nutrient is absent. In such a nutrient-starved process, often the carbon/energy source is supplied to satisfy the cultures’ maintenance requirement, while the absence of another nutrient (e.g., N) prevents growth [36][49]. In this case, cells cannot continue growing without the missing essential nutrient(s), but they often remain able to metabolize the supplied carbon source and accumulate storage products or transform that carbon source into a desired product [37][38][39][40][50,51,52,53]. A fed-batch process can also be implemented as a nutrient-limited fed-batch, which like a chemostat necessitates that a nutrient feed is introduced at a rate lower than the growing culture can maximally metabolize. In contrast to a nutrient-starved process, though, the culture is growing continuously, and the rate of introducing the limiting nutrient controls the metabolic and growth rates [41][54]. Because no effluent typically exists, cells and products remain in the culture, enabling fed-batch processes to achieve high cell density and product concentration. A quasi-steady state is achieved in nutrient-limited fed-batch cultures [41][54]. Nutrient-limited fed-batch processes can be operated in several ways. For example, the growth-limiting nutrient can be introduced into the culture at a constant rate or at an exponential rate [32][11]. When a growth-limiting nutrient is fed at a fixed rate (Fc), the growth rate of the culture decreases with time [32][42][11,55]. In an exponential fed-batch process the nutrients are fed at an exponentially increasing rate to match the needs of the growing culture, to maintain a constant growth rate μc less than μmax.4. Nutrient Limitation Compared to Nutrient Starvation
From the cells’ perspective, nutrient limitation is quite different from nutrient starvation [43][61], the latter which is often called a “resting cell” process. Nutrient limitation permits continued, possibly steady-state growth, whereas starvation in one or more essential nutrient induces dynamic stress responses and ultimately prevents further growth [44][45][46][62,63,64]. Many researchers examine the effect of nutrient scarcity by restricting an essential nutrient in the medium to cause that nutrient to be depleted first, or by transferring washed and concentrated cells from a complete to a depleted medium (e.g., [47][65]). Similarly, batch processes are typically composed of a medium from which carbon is depleted first, leading many to refer to such a batch process as “carbon-limited”. The term “starved” would be preferred to describe a batch process: only after a period of maximal growth do the cells transition quickly to non-growth due to first deficiency then absence of that one (or more) nutrient. The distinction is more important when a nutrient other than the carbon source is the first to be depleted, because the remaining excess carbon/energy source often continues to be consumed and converted into an intracellular or extracellular product despite, or often because of, the lack of growth. Because of these physiological differences, care should be taken when comparing results from nutrient starvation with nutrient limitation, wherein growth is maintained by the slow addition of one or more limiting nutrients. The literature is replete with studies describing “nutrient limitation”, when in fact the initial medium was merely adjusted so that the cells experience a short batch process until a specified nutrient is depleted, that is, the cells transition from a higher growth rate to being starved for that nutrient. Typically, these studies examine the culture for the metabolism of a remaining excess carbon source while the culture transitions from nutrient scarcity to nutrient exhaustion. Nutrient limitation implies a process in which the cells continue to grow. To understand the physiological response of an organism to nutrient limitation, it is very important to have controlled conditions (pH, temperature, and oxygen) and a well-defined medium since common complex components such as yeast extract and peptone complicate the identification of the limiting nutrient and interpretation of the cellular response [14][48][26,66]. One important measurement associated with nutrient limitation and cell growth in general is the biomass yield, which expresses the quantity of cells on a dry basis generated per quantity of nutrient consumed (e.g., units of g cells/g nutrient).5. Physiological Effects of Non-Carbon Nutrient Limitation
5.1. Nitrogen
Nitrogen occurs throughout cells, in proteins, nucleotides, and many metabolites. Nitrogen as ammonium is assimilated in E. coli and most bacteria and yeast into glutamine and glutamate [49][100], which are the primary intracellular nitrogen donors. In bacteria, 88% of the cellular nitrogen is derived from glutamate, while 12% is derived from glutamine [50][101]. Glutamate is the most abundant metabolite in E. coli, accounting for about 40% of the total metabolite concentration [51][102]. In many bacteria such as E. coli, two ammonium-assimilating pathways are available, a NADPH-dependent glutamate dehydrogenase and a high-affinity glutamate synthase (glutamine oxoglutarate aminotransferase, GOGAT)/glutamine synthase. Glutamate dehydrogenases generally have high values of KM for ammonium, so that during N-limited growth, glutamine synthase expression is elevated to maintain sufficient glutamate [52][103]. Dynamic N starvation in E. coli and S. cerevisiae growing on glucose depletes glutamine and to a lesser extent glutamate while α-ketoglutarate increases markedly and can even be excreted [47][53][65,104]. Accumulation of α-ketoglutarate occurs in cyanobacteria also, a signal which upregulates nitrogen assimilation via the global regulator NtcA and other regulators [54][55][105,106]. In yeast, the concentration of tryptophan, which relies on glutamine for its synthesis, decreases, while phenylalanine and tyrosine, which rely on glutamate for nitrogen, do not change, resulting in an accumulation of phenylpyruvate and phenylethanol, a quorum-sensing signal [56][107]. Accumulated α-ketoglutarate in E. coli noncompetitively and cooperatively inhibits EI of the PTS [57][108], citrate synthase [58][109], and PEP synthetase [59][110]. Furthermore, sudden nitrogen availability in N-starved wild-type E. coli induces a decrease in α-ketoglutarate and rapid increase in glucose uptake rate, while in a PTS-deficient strain with elevated galactose permease, glucose uptake is insensitive to N-availability [57][108]. In general, S. cerevisiae N-limitation leads to depletion of intracellular amino acids, particularly at low dilution rates [53][104]. Because intracellular glutamine and arginine concentration correlates strongly with dilution rate, these compounds likely control growth in N-limited S. cerevisiae [53][104]. Synechocystis also accumulate α-ketoglutarate [60][111] under N-starvation as well as glycogen, which is associated with the induction of the glgX gene [61][62][63][112,113,114]. E. coli has a high protein turnover under N-limited conditions compared to C-limited or P-limited conditions [64][115].
5.2. Phosphorus
Phosphorus occurs in cells as phosphorylated organic compounds such as general sugar-phosphates, phospholipids, phosphorylated proteins, RNA, DNA, and ATP. The response to a P-deficiency is typically mediated by a two-component signal transduction system. The sensor kinase component, PhoR, phosphorylates a response regulator that amplifies its own response, increases expression of proteins which scavenge phosphate such as a high-affinity phosphate transporter [65][150]. Thus, P-limitation has multiple physiological consequences. For example, P-limitation causes a shift in the structure of the cell wall of Gram-positive microbes such as B. subtilis from P-containing teichoic acid to teichuronic acid which lacks phosphorus [66][67][151,152]. As a result, P-limited B. subtilis contain less than half as much cellular phosphate as bacteria grown in excess P, and phages which bind to teichoic acid bind less effectively under P-limited conditions [68][69][153,154]. In this case, phosphorylated PhoPR represses tagAB operon to restrict teichoic acid synthesis and activates the tua operon to stimulate teichuronic acid synthesis [65][150]. P-limitation triggers the synthesis of phosphate-mobilizing hydrolases such as alkaline phosphatases and ribonucleases [70][155]. In S. cerevisiae, genes responsible for uptake of inorganic phosphates and inositol phosphates are upregulated under steady-state P-limitation at 0.1 h−1, and surprisingly, polyphosphates accumulate in this yeast’s vacuoles [71][141]. Cells appear to use ribosomes for protein synthesis at higher efficiency under phosphate limitation [72][156], and the RNA content is 6–8-fold greater than expected to be necessary for maintenance of the growth rate, though this RNA is immediately usable when P-limitation is relieved [73][157].5.3. Sulfur
Sulfur is present in the amino acids methionine and cysteine, and important metabolites such as S-adenosylmethionine, Coenzyme A (CoA), and lipoic acid. In most media, S is supplied as the sulfate ion, and thus, S-limitation is often studied specifically as sulfate-limitation.
Unsurprisingly, S-limited growth leads to increased transcription of proteins encoding for the uptake of sulfur, such as in S. cerevisiae [71][141], E. coli [74][184]. Under S-limitation or S-starvation, several organisms preferentially express proteins having a low sulfur content [71][75][76][77][10,141,185,186]. For example, under S-limitation, S. cerevisiae upregulates by as great as 50-fold the PDC6 transcript expressing a protein with only 6 sulfur-containing amino acids compared to isozymes PDC1 and PDC5 having 17–18 sulfur-containing amino acids [71][141], while K. aerogenes maintains lower protein content in the cell wall under S-limitation compared to other nutrient-limited conditions, and this remaining protein contains a low sulfur content [78][187]. The ABC transporter sulfate-binding proteins of Salmonella typhimurium and E. coli responsible for sulfate uptake in a low S environment themselves contain no sulfur [79][188]. When Pseudomonas putida encounters S-depletion, it replaces proteins having high S content with proteins having lower amounts of cysteine and methionine [80][86]. K. aerogenes also excretes proteins lacking S when grown under S-limited conditions on glucose [81][161]. This phenomenon has been observed in many microbes, including cyanobacteria [77][186]. In transitioning between S-limitation and S-enrichment, cells must synthesize new RNA, whereas under C-limitation, the cells use previously synthesized translation machinery, including inactive ribosomes [72][82][156,189]. In E. coli, S-starvation resulted in a 2.8-fold greater glucose uptake rate than N-starvation, and 40% greater glucose uptake rate than P-starvation, but about 70% less than the glucose uptake rate observed during Mg-starvation [83][190]. In B. subtilis, S-starvation resulted in identical glucose uptake rates as observed during N-, P-starved conditions [83][190]. S-limitation in E. coli led to secretion of pyruvate (yield of 0.33 g/g), succinate (0.11 g/g), and acetate (0.10 g/g) despite the aerobic conditions [83][190]. S-limited chemostat cultures of K. aerogenes also secreted more pyruvate than N-, P- or C-limited growth on glucose [81][161], while S-limited chemostat cultures of K. aerogenes (formerly Aerobacter aerogenes) at high growth rate (0.42 h−1) showed pyruvate and 2-oxoglutarate accumulation [84][191]. These observations may be explained by comparing a typical protein (~3% S content by mass) to the sulfur-containing cofactors CoA-SH (4.2% S), lipoic acid (31.1% S), and thiamine pyrophosphate (7.5% S). Each one of these cofactors is a component of the subsequent pyruvate/2-oxoglutarate dehydrogenase step, and the limitation of these cofactors would likely limit metabolic conversion of pyruvate under S-limited conditions [84][191]. Further evidence identifies lipoic acid as the predominant limiting factor [85][192]. Interestingly, in contrast to growth on glucose which generated pyruvate and acetate, acetate was the only significant product when K. aerogenes was grown on glycerol, mannitol or lactate under S-limited conditions [81][161]. S-limitation appears to favor plasmid stability compared to C-, N- or P-limitation, particularly at high growth rate [86][193]. This observation was attributed to the fact that among these four nutrients, only S is not a constituent of nucleic acids. S-starvation resulted in the greatest mevalonate yield from glucose (0.6 mol/mol) compared to Mg-, P- or N-starvation [87][88][194,195]. S-starvation (referred to as MgSO4 limitation) increased limonene formation by E. coli [89][196]. Similarly, lipid formation elevated when the oleaginous yeast Rhodosporidium toruloides became starved for S [90][197]. The fluxes through the TCA cycle and toward acetate formation were suppressed by S-starvation, and the pentose phosphate pathway appears to be the principal route for NADPH generation [87][194].5.4. Magnesium
Magnesium is an integral component of ribosomes [91][204], and stabilizes the outer membrane in Gram-negative prokaryotes through the creation of ionic bridges [92][205]. The element as Mg2+ is also involved in DNA stability and repair [93][206], and it plays an important role as an enzyme cofactor. Many complex medium formulations supplemented with carbon source (such as “Lysogeny Broth” medium) become starved for Mg, and can lead to protein acetylation at lysine residues [94][207]. There have been a few reports on cellular Mg composition, and the yield coefficient is highly dependent on cell growth rate. Mg-starvation causes E. coli cells to restructure the outer membrane and redistribute Mg [95][96][209,210]. Although the yield coefficient decreased with increasing dilution rate, Mg-limited K. aerogenes cultures do not synthesize intracellular polysaccharides, which is attributed to an impaired ability to synthesize these materials when Mg is limiting [97][88]. Mg-limitation results in larger and filamentous E. coli cells [98][99][211,212]. Within 400 steady-state Mg-limited generations, mutations arise in genes involved in the cell-membrane in E. coli [95][209]. Under Mg-limited conditions, both yeast [100][213] and bacteria [95][209] reduce the surface hydrophobicity of the lipopolysaccharide (LPS) component of the outer membrane, likely by increasing the proportion of polar sugar residues in the LPS, such that lower amounts of Mg are needed for stabilization of the LPS.5.5. Iron
Consistent with the theme of cells conserving limited resources, Fe-limitation causes cells to reduce their reliance on pathways which contain significant Fe, such as the tricarboxylic acid cycle (aconitase, fumarate hydratase, succinate dehydrogenase) and the proton-pumping components of the electron transport chain [101][102][103][71,231,232]. This realignment of metabolism has physiological consequences. For example, under Fe-limiting aerobic conditions, E. coli generates acetate at a yield of 0.25 g/g at a dilution rate of 0.4 h−1, but accumulates predominantly lactate (yield of 0.60 g/g) at 0.1 h−1 [101][71]. Elevated lactate under the most severe steady-state Fe-limitation provides cells a means to oxidize NADH when the Fe-requiring Nuo complex is curtailed, while an increased glucose uptake rate serves to meet ATP demand [101][71]. Lactate formation is also observed for Staphylococcus aureus exposed to Fe-starvation [104][233]. The reduction in activity of TCA cycle enzymes and accumulation of NADH encourages the formation of ethyl acetate by Kluyveromyces marxianus [105][234] and Candida utilis [106][235]. Because of the restricted capacity of the electron transport chain subject to Fe-limited conditions, cells essentially behave like they are encountering anaerobic conditions. For example, E. coli accumulates acetate and formate under Fe-limited steady-state conditions, attains a 60% greater glycolytic flux, and reduces by a factor of 5 the fraction of glucose entering the TCA cycle [107][236]. More generally, Fe-limitation impacts oxygenation and redox state because numerous electron-carrying enzymes contain Fe-S clusters, and many Fe-containing enzymes or pathways are constrained under Fe-limitation. For example, the nitrogenase enzyme system contains significant Fe [108][237], and Fe-limitation thus severely reduces nitrogen fixation by Azotobacter vinelandii [109][238]. Notably, lactic acid bacteria, which lack cytochrome and show generally high tolerance to peroxide, do not require iron for growth at all [110][111][239,240].