In recent years, high entropy alloys (HEAs) have become a research hotspot in materials science. Nowadays, HEAs are frequently used for the energy conversion and storage applications
[1][2][3][4][1,2,3,4]. HEAs are also called multi-principal alloys, baseless alloys, or alloys without main component. They were first proposed by Brian Cantor and coworkers
[5] and Jien-Wei Yeh and his team
[6]. The first HEAs were alloys with six or more components in equiatomic proportions. It was unexpected that such alloys may form a uniform disordered solid solution. This is because their unique combination of atoms with different atomic radii can strongly prevent the nucleation of second phases and their subsequent growth
[5][6][7][8][9][10][11][12][5,6,7,8,9,10,11,12]. Such alloys can exhibit better properties than traditional alloys. In particular, they possess high hardness
[7][8][7,8], good strength at high temperatures
[9], and excellent wear, oxidation, and corrosion resistance
[10][11][12][10,11,12]. The most used approaches to manufacturing HEAs are casting or arc melting technologies
[5][6][7][8][9][10][11][12][5,6,7,8,9,10,11,12]. In these methods, the elemental powders are mixed first and then remelted several times in order to ensure the homogeneity of HEAs. However, the size of HEA parts produced by casting or arc melting is limited. This fact impedes the application of HEAs. One of the ways to overcome this restriction is to produce the part from other regular or ordinary (possibly even cheaper) material and to deposit the HEA coating on the surface. Due to this fact, various methods were used to produce the HEA coatings, such as plasma cladding
[1][2][13][14][1,2,13,14], plasma spray
[15][16][17][18][19][20][21][22][15,16,17,18,19,20,21,22], thermal spray
[23], laser cladding
[24][25][26][27][24,25,26,27], magnetron sputtering
[28][29][30][31][32][33][34][35][36][37][28,29,30,31,32,33,34,35,36,37], vacuum arc deposition
[38][39][40][41][38,39,40,41], electric arc deposition
[42], and electron beam deposition
[43]. All these deposition methods have their advantages and disadvantages. For example, thermal spraying can take place in low vacuum. On the other hand, the increased oxidation of the components can proceed. The magnetron sputtering or vacuum arc deposition ensure high density and uniformity of coatings, they also do not include melting of HEA during manufacturing. However, the maximal thickness does not exceed a few μm. In the case of plasma cladding, the coatings can be a hundred times thicker. Also, the small droplets of a melt can form during the vacuum arc deposition; in most cases, they need to be filtered with magnetic loops, decreasing the deposition rate. The magnetron sputter-deposited films have columnar grain structure, and the coatings after vacuum arc deposition have uniform equiaxed grains.
RWe
searchers listed here only several differences of HEA synthesis methods. Each of them has, therefore, its own niche (which frequently partly overlaps with those of other synthesis methods). This
entryreview discusses the plasma cladding, which started to be developed quite recently, just few years ago, and, nevertheless, has already taken its own place among other technologies.
2. Grain Boundary Wetting Phase Transitions
In most cases, HEAs contain numerous components. Therefore, the equilibrium phase diagrams for such complicated systems must be constructed in 5–6 or more dimensions. Due to this trouble,
rwe
searchers are forced to use a simplified approach. Fortunately, the most important features of GB wetting phase transitions
[48][49] can be described using the simple two-dimensional phase diagram for binary alloys like that shown in
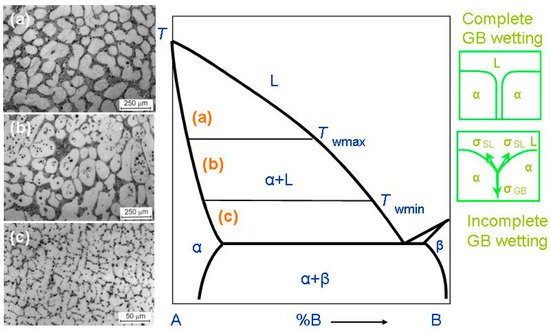
Figure 12. Bold lines in this scheme (e.g., solidus, liquidus, solvus, and eutectic lines) depict the bulk phase transitions. The thin lines (like tie-lines at
Twmin and
Twmax) depict the GB phase transformations. When the solidification of HEAs starts, the composition of an alloy can be found in the phase diagram in the liquid area L. Afterwards, by cooling, it crosses the liquidus line and moves into the two-phase area L + α. In this L + α area the melt is in equilibrium with solid solution α. The solid solution α is based on component A. By following cooling, the amount of solid solution α in this L + α mixture increases and the portion of melt L decreases. The composition of remaining melt L follows the liquidus line. Thus, the melt becomes more and more enriched by component B. Similarly, the composition of solidifying phase α changes along the solidus line. If the concentration of component B in α-phase is low, the solidification finishes at the solidus line. Afterwards, the solidified alloy has only phase, namely the solid solution α. However, the portions of α-phase solidified at the end of the process are enriched by the component B. If
rwe
searchers discuss the multicomponent HEAs instead of this simple example of binary alloy, the GB wetting transitions would be more complicated. This is because, for example, an HEA with five components is described by the 5D phase diagram. Therefore, when the liquid alloy L with five components starts to crystallize, it can intersect with not only one binary-phase region, α + L, such as in
Figure 12, but numerous multiphase areas. Only afterwards can HEA be completely solid and contain only one α-phase. These multiphase regions can contain more than one liquid phase and one solid phase.
Figure 12. Binary A–B diagram of 3D phases for the discussion of the GB wetting phenomena. Thick lines (solidus, solvus, liquidus, eutectic lines) mark the bulk transitions between 3D phases. Thin lines at
Twmin and
Twmax mark the tie-lines for the wetting of α/α GBs by the liquid phase, L. On the left-hand side of the figure the micrographs are shown for the L + (Al) polycrystals containing liquid and solid phases. Case (
a) shows the alloy structure above
Twmax. Here, all (Al)/(Al) GBs are fully wetted. The scheme (
b) shows the alloy structure between
Twmax and
Twmin. Here, some (Al)/(Al) GBs are completely wetted, and other (Al)/(Al) GBs are partially wetted. The scheme (
c) shows the alloy structure below
Twmin. This sample contains only partially wetted (Al)/(Al) GBs. The respective thermodynamic schemes for complete and incomplete GB wetting are shown right. Here, σ
GB is the GB energy, σ
SL is the IB energy, θ is the contact angle. The micrographs are reprinted with permission from ref.
[49][60]. Copyright 2021 MDPI.
When a polycrystal crosses the α + L area of the phase diagram, it contains, first, the interphase boundaries (IBs) between liquid phase, L, and solid phase, α-phase. It also contains the α/α grain boundaries (GBs). The melt, L, contacts the solid phase, α, in the triple junctions (TJs) between GBs and, respectively, two solid/liquid IBs, (see green schemes on the right-hand side of
Figure 12). The GB has the energy σ
GB and each solid/liquid IB has energy 2σ
SL. If σ
GB < 2σ
SL, (see lower scheme in right-hand side of
Figure 12), the GB has a non-zero contact angle, θ > 0, with the melt. The GB wetting in this case is partial (or incomplete). The micrograph (
c) on the left-hand side of the phase diagram shows an example of how the microstructure of the two-phase α + L polycrystal of the Al–Mg alloy can appear below
Twmin. This sample contains only (Al)/(Al) GBs partially wetted by the Mg-rich melt. If the energy of two solid/liquid IBs, 2σ
SL, is lower than the GB energy, σ
GB > 2σ
SL (see upper scheme in
Figure 12), then the contact angle becomes equal to zero, θ = 0. In this case, the thick melted layer should separate the solid α-grains, and the GB wetting is complete. The transition between complete and partial GB wetting is described for numerous binary alloys. In these alloys the θ value decreases with growing temperature and becomes zero at a certain temperature,
Tw (called the temperature of GB wetting phase transition)
[50][51][52][50,51,52]. Above
Tw, the GB is completely wetted. The GB wetting phase-transition is in principle two-dimensional one. Nevertheless, it can be of first or second order, similar to phase transformations in the bulk
[53][54][55][53,54,55]. In the case of a first-order GB wetting transition, the first temperature derivative of θ, dθ/d
T, has a discontinuity at
Tw. The dθ/d
T suddenly descends at
Tw from a certain finite value to zero
[50][53][54][50,53,54]. In case of the continuous (second-order) wetting transition in GBs, the dθ/d
T value continuously changes with growing
T and smoothly reaches zero dθ/d
T = 0 at
Tw [54][55][54,55]. One must take into consideration that the σ
GB value can strongly depend both on the grain boundary misorientation angle, χ, and on the grain boundary inclination angle, ψ
[56]. The dependences of GB energy on χ and ψ, σ
GB(χ) and σ
GB (ψ), possess the sharp cusps at certain χ and ψ values
[57]. These special misorientation and inclination angles, χ and ψ, are determined by the coincidence site lattices. Due to this fact, the σ
GB can vary in a rather broad interval of values. Obviously, the lower σ
GB, the higher GB contact with the liquid phase would be at θ. This means that contact angles in a polycrystal can vary in a very broad interval. Moreover, these contact angles for different GBs should decrease with growing temperature with a different rate. Also, the low-angle GBs have lower σ
GB than high-angle GBs, and, therefore, the higher
Tw values
[58]. Actually, the low-angle GBs are not continuous two-dimensional (2D) defects, but consist of arrows of 1D defects, namely dislocations. The GB triple junctions are also 1D defects, and for them, it is lower than for high-angle GBs
[59]. Due to these reasons, the spectrum of
Tw temperatures in a polycrystal can be quite broad.
Such microstructures of two-phase polycrystals can be seen in
Figure 12 (micrographs in the left-hand side). These are the microstructures of the binary Al–Mg alloys. As a result, a conventional phase diagram for 3D-phases gets the additional tie-lines at
Twmin and
Twmax for 2D GB wetting transformations. At
T >
Twmax all GBs in a polycrystal are fully wetted and contain, therefore, the melted layer between solid grains. The micrograph (a) on the left-hand side of the phase diagram shows an example of how the microstructure of the two-phase α + L polycrystal of the Al–Mg alloy can appear above
Twmax. The micrograph (a) is reprinted with permission from ref.
[49][60]. In this sample, all (Al)/(Al) GBs are completely wetted by the Mg-rich melt. The liquid phase surrounded all solid (Al) grains. The
Twmax tie-line describes the GB wetting transformation for GBs with the lowest σ
GB in a polycrystal. By cooling, the first partially wetted GBs appear below
Twmax. Between
Twmax and
Twmin, the amount of completely wetted GBs decreases with decreasing
T. The micrograph (b) on the left-hand side of the phase diagram shows an example of how the microstructure of the two-phase α + L polycrystal of the Al–Mg alloy can appear between
Twmin and
Twmax. The micrograph (b) is reprinted with permission from ref.
[49][60]. In this sample, some (Al)/(Al) GBs are completely wetted by the Mg-rich melt and other (Al)/(Al) GBs are partially wetted by the liquid phase. At
Twmin, the completely wetted GBs disappear. The
Twmin tie-line describes the GBs with the highest energy σ
GB. Below
Twmin there are no completely wetted GBs in an alloy, and the polycrystal has only partially wetted GB with θ > 0. The respective example of the Al–Mg alloy is shown in the micrograph (c) on the left-hand side of the phase diagram.
Above
Twmax, the liquid phase completely surrounds each solid grain (or crystallite). Thus, solid grains cannot contact each other. It is because the “dry” GBs are thermodynamically forbidden above
Twmax.
RWe
searchers can see, therefore, how the new GB tie-lines appear in the α + L area of a conventional binary diagram for bulk or 3D phases.
RWe
searchers must underline here that GB wetting phenomena can be observed not only in HEA coatings, but also in the bulk HEAs manufactured by the arc or induction melting in argon or vacuum
[60][61][62][63][64][65][66][67][68][69][70][71][72][73][74][75][76][77][78][79][80][61,62,63,64,65,66,67,68,69,70,71,72,73,74,75,76,77,78,79,80,81], electric-current-assisted sintering (ECAS)
[81][82], or additive manufacturing
[82][83].