The world is undergoing exciting haste to install photovoltaic (PV) systems in industry, residential/commercial buildings, transportation, deserts, street lights, and many other applications. Solar photovoltaic energy systems are clean and reliable energy sources that are unlimited, unlike their fossil fuel counterparts. PV, is a necessity. PV technology, however, stands a better chance among all the renewable energy sources to protect the environment due to its cleanliness [21,22]. Moreover, this technology is a more beneficial, efficient energy resource than other renewable technologies. For instance, solar PV technology remains a significant motivator for electrification in rural regions in developing countries [23].
- solar photovoltaic system
- efficiency
- renewable energy
- fossil fuel
- environment
1. The Contributions and Impact of Solar Photovoltaics on National Development

1.1. The Price Reduction and Installation Capacity of Photovoltaic Cells/Modules
1.2. The Trending Position of Current and Future Photovoltaic Power Generation around the World
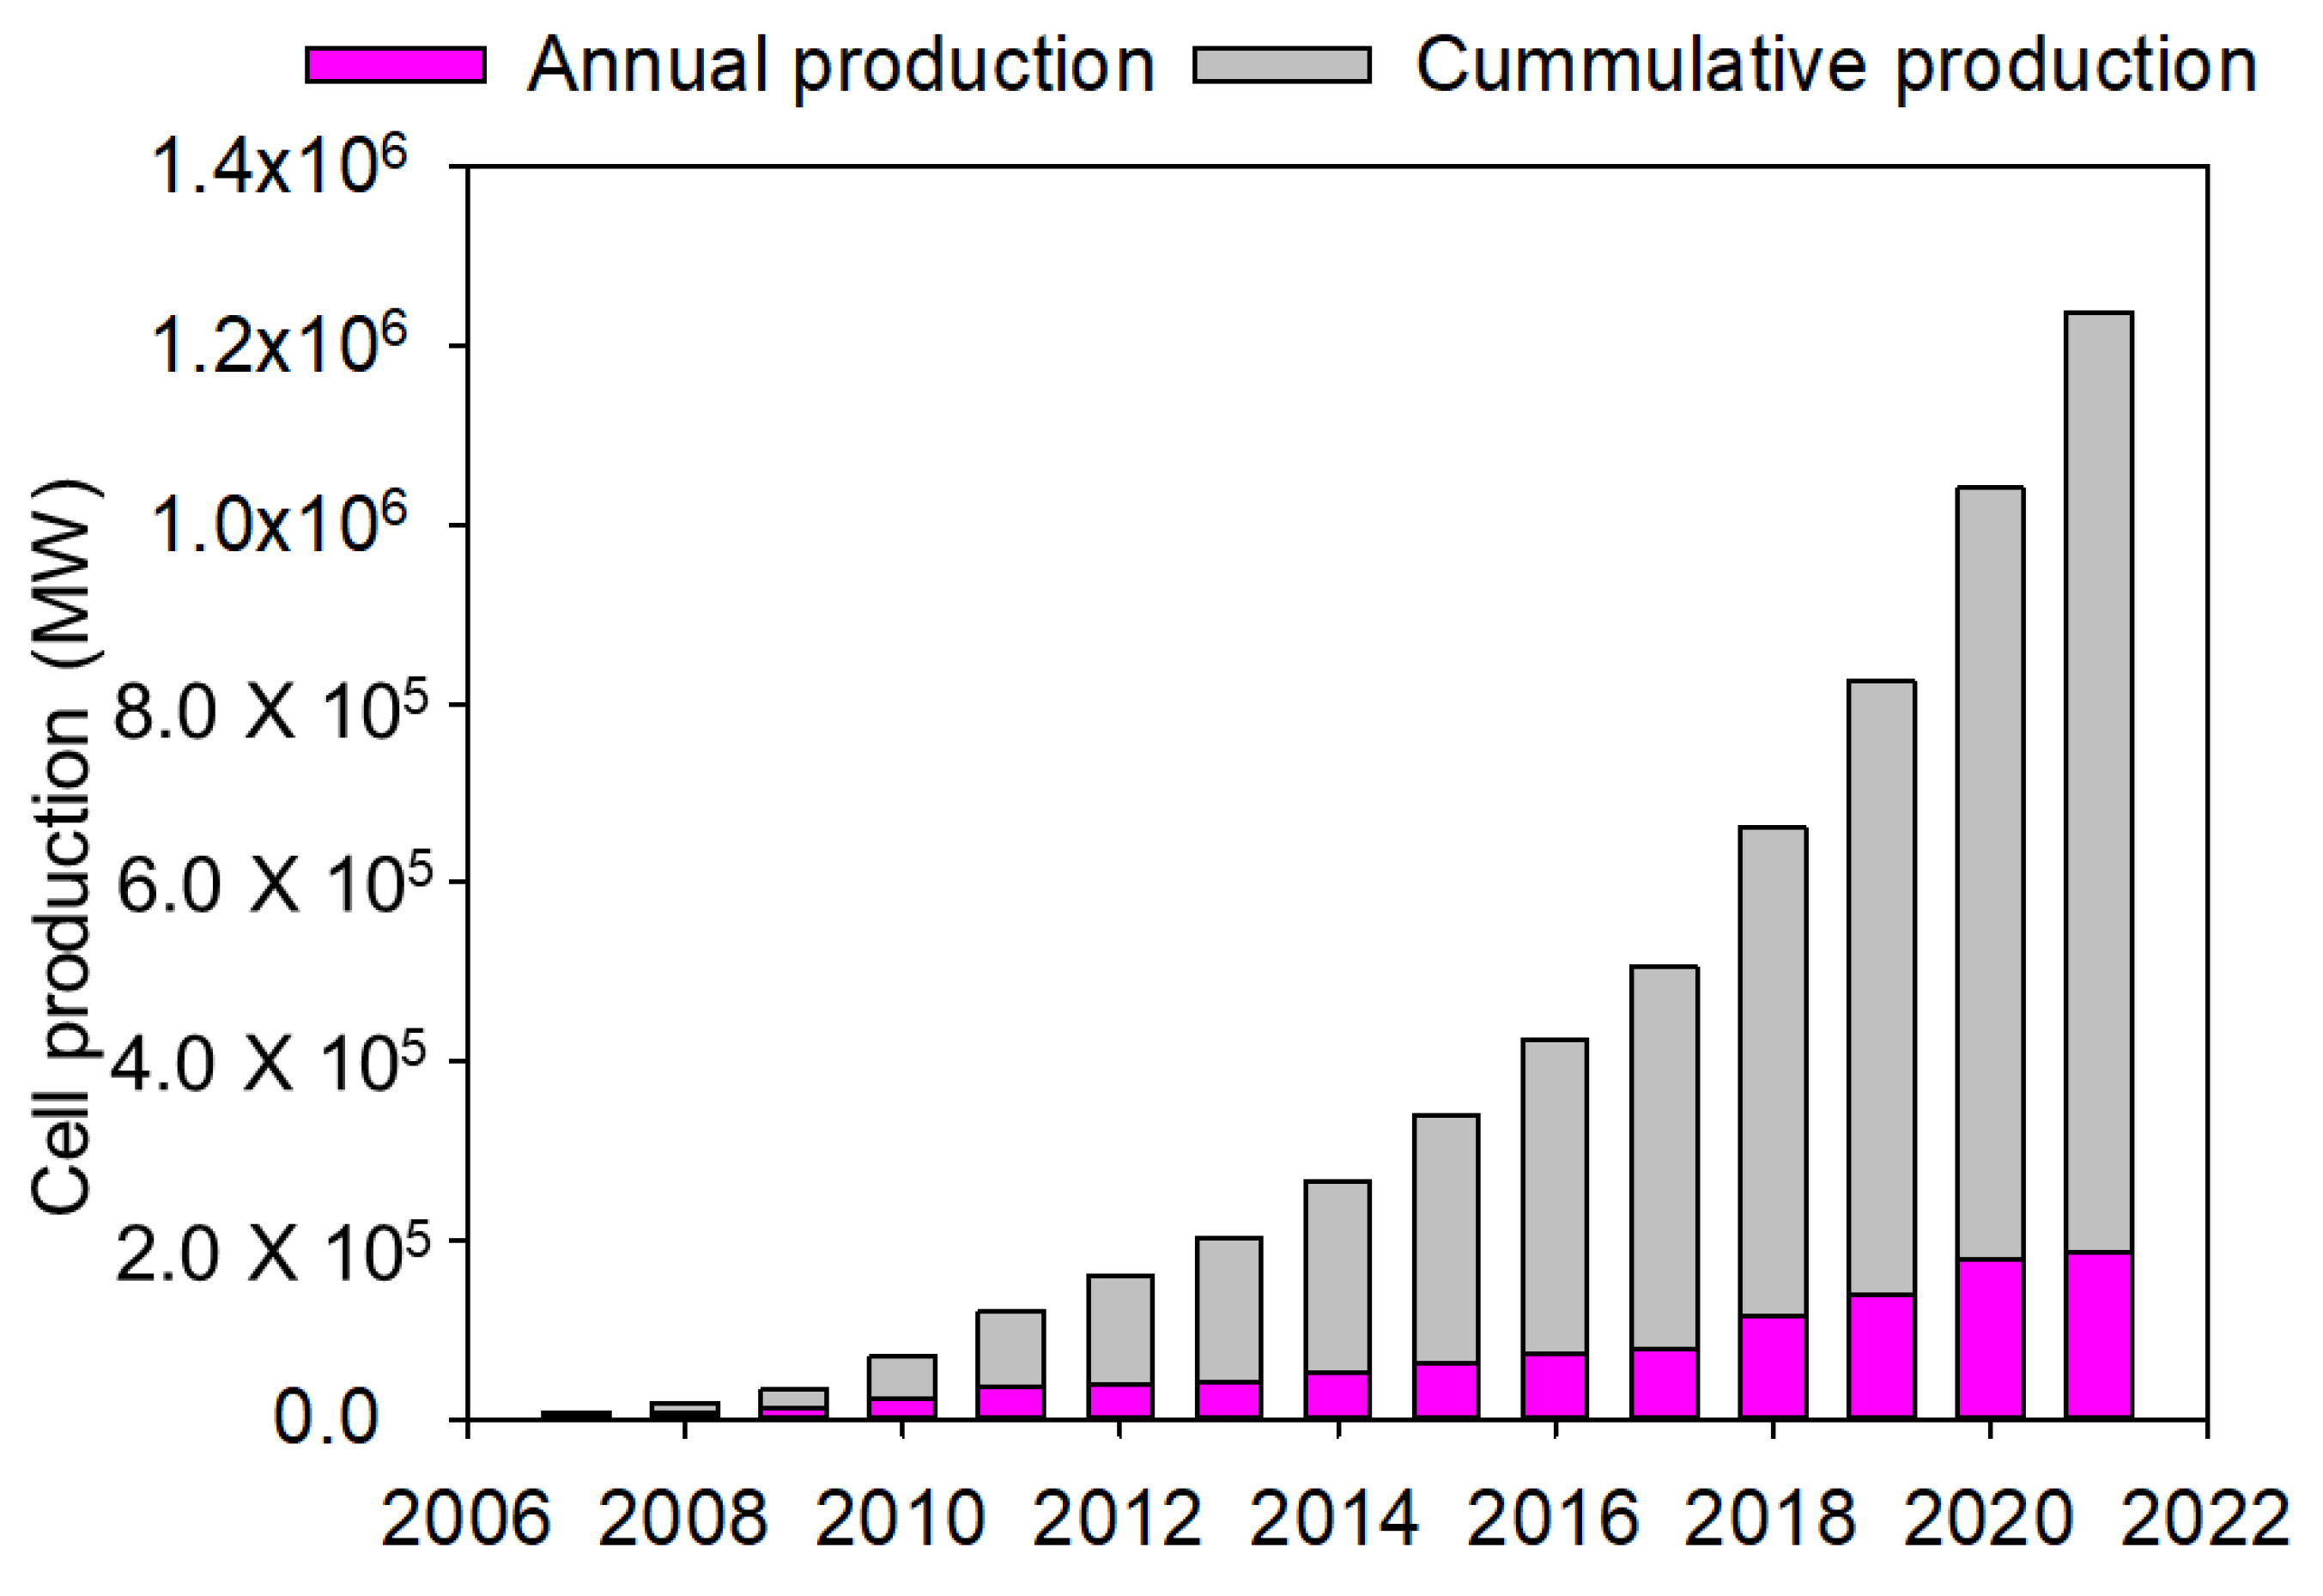
Currently, scientific researchers are continuously improving PV power production globally. The international PV market has undergone a sudden rise since 1998, with an annual growth of 35% of the installed capacity. The installed cumulative PV capacity had also risen from 1200 MW in 2000 with a rapid increase up to 188 GW in 2014 and was found to be 490 GW by 2020 [91][11]. These fast advancements in PV production have created high competition in the market industries. Clearly, some nations such as the US, China, Japan, Germany, and South Africa have significantly improved in the PV market. The global PV modules at the end of 2014 were about 50 GW, in which China shared 27.2%, contributing to about 70% of the worldwide market [92][12]. Hence, as this swift development continues, the global market production outlook projects the PV to reach 266 GW by 2025 and 270 GW by 2030. Recently, there has been growing attention on PV prospects, investigation, and future. Most of the studies emphasized decreasing costs, expanding efficiency, and improving the present systems’ technical strategy [22][13]. On the other hand, many countries have also declared their strategies and policies to endorse PVs’ growth [93,94][14][15]. On 2nd June 2014, the US Environmental Protection Agency (EPA) issued its Clean Power Plan by declaring that renewable energy practices (as well as solar energy) will be doubled within the next ten years. In another development, the US Department of Energy (DOE) also spent $15 million to assist peoples’ initiatives and societies in developing the solar energy platform [95][16]. In the same vein, the Japanese government has passed laws, such as the Renewable Energy Special Measure Law and the Renewable Portfolio Standard Law, to ascertain the expansion of fresh energy ideas and tasks the parties for immense contributions [96][17]. China, from another angle, had emphasized a few essential and critical demonstration schemes of the PV technologies in the Outline of the National Program for Long- and Medium-Term Scientific and Technological Development (2006–2020), the National 11th Five-Year Scientific and Technological Development Plan, and the Renewable Energy 12th Five-Year Plan [93,94,95,96,97][14][15][16][17][18]. On the other hand, the contributions of PV technology to electricity are improving globally. According to the Statistical Review of World Energy, 2017, the total world value of the newly installed capacity was about 37.6 GW, which accounts for 53% of the world. Solar PV market research estimated that approximately 38% of the new solar PV modules were manufactured in China, Japan, the US, and Germany. China led in cumulative solar photovoltaics in 2017 with a capacity of 11.3 GW. The research by [100][19] on grid-connected PV systems in China showed that PV technology is swiftly emerging. The study noticed that China’s government offers unusual incentives to research and development (R&D) groups in the country for solar PV and enacts some policies for PV installations. The PV industry has experienced massive growth in the worldwide PV market for several years. The report presented by European Photovoltaic Industry Association (EAPIA), a global PV market outlook, showed that the world’s cumulative PV power installed was 22.9 GW in 2010, which rose by 45% when compared to 2008 (16 GW), and in 2017, it was about 139.6 GW, and a value of 55% was installed worldwide [99][20].2. The Importance of Solar Photovoltaics as Compared to Fossil Fuels
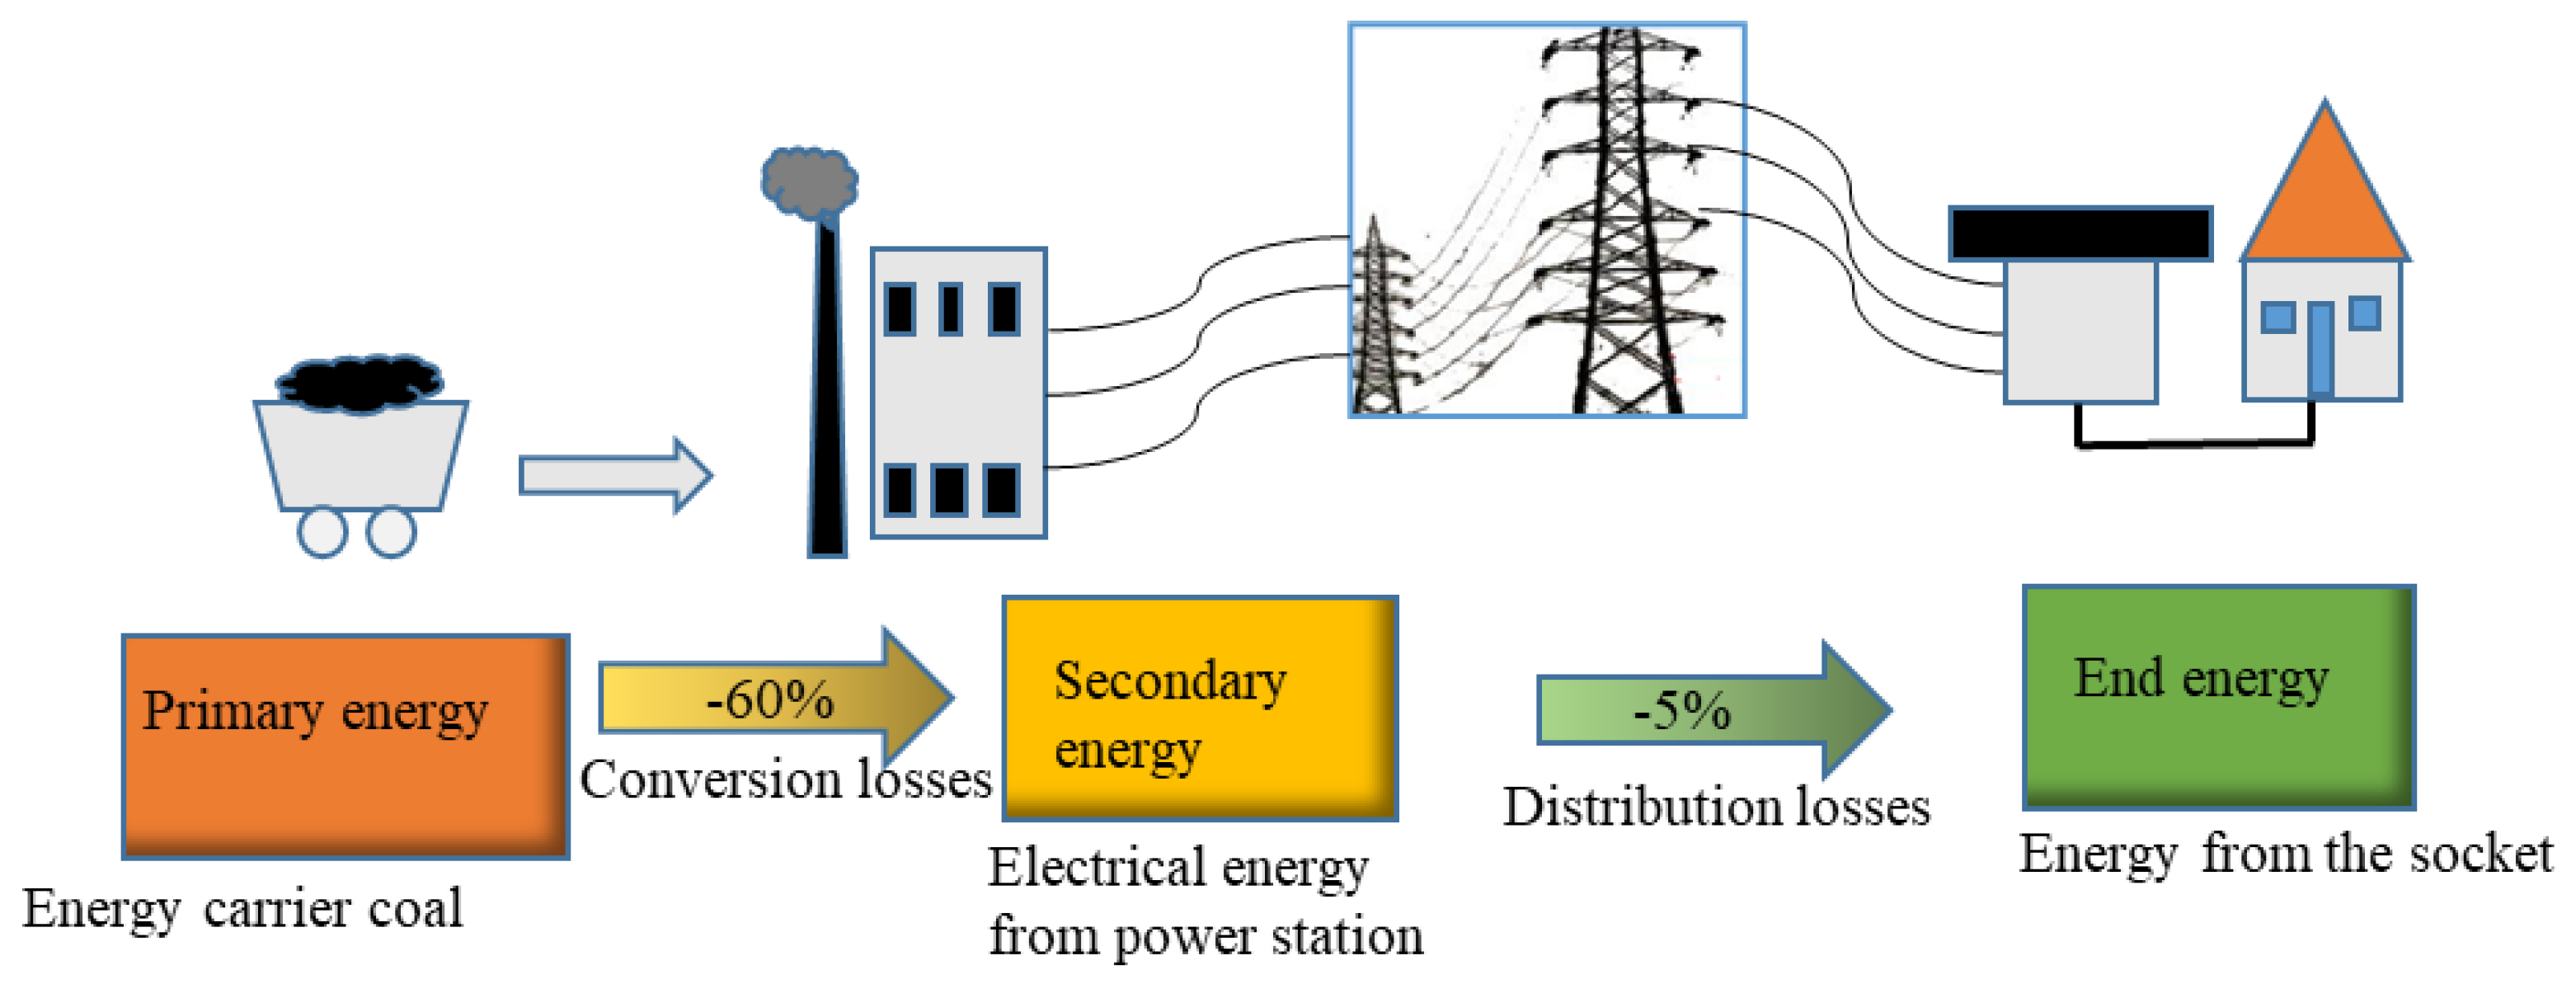
It is becoming more apparent that the prevailing global method of generating electricity through coal fire has been unsustainable for the past years. Fossil fuel power plants control over 90% of the global electricity generation. The plants are vertically integrated in the sense that it generates, transmits, and distributes electricity to internal markets and purchases and sells electricity to and from the developing communities. Fuel is typically stored in the form of energy carried as a primary energy, which must be converted for practical purposes. Therefore, it must be burned to generate electricity, and lots of energy is wasted in transporting from the coal-fired station to the consumers. Figure 82 shows that about 65% of the energy is lost from the consumers’ primary source.
3. Socioeconomic Impacts of Photovoltaic Technology

4. Policies Adopted That Helped to Boost Solar Photovoltaic Systems in Leading Countries
References
- Brano, V.L.; Orioli, A.; Ciulla, G.; Di Gangi, A. An improved five-parameter model for photovoltaic modules. Sol. Energy Mater. Sol. Cells 2010, 94, 1358–1370.
- Infield, D.; Freris, L. Renewable Energy in Power Systems; John Wiley & Sons: Hoboken, NJ, USA, 2020; ISBN 1118649931.
- REN21. Global Status Report; REN21 Secretariat: Paris, France, 2018.
- Aman, M.M.; Solangi, K.H.; Hossain, M.S.; Badarudin, A.; Jasmon, G.B.; Mokhlis, H.; Bakar, A.H.A.; Kazi, S.N. A review of Safety, Health and Environmental (SHE) issues of solar energy system. Renew. Sustain. Energy Rev. 2015, 41, 1190–1204.
- Pearlmutter, D.; Theochari, D.; Nehls, T.; Pinho, P.; Piro, P.; Korolova, A.; Papaefthimiou, S.; Mateo, M.C.G.; Calheiros, C.; Zluwa, I. Enhancing the circular economy with nature-based solutions in the built urban environment: Green building materials, systems and sites. Blue-Green Syst. 2020, 2, 46–72.
- Harris, J.M.; Roach, B. Environmental and Natural Resource Economics: A Contemporary Approach; Routledge: England, UK, 2017; ISBN 1317216210.
- Wirth, H.; Schneider, K. Recent Facts about Photovoltaics in Germany; Fraunhofer ISE: Freiburg, Germany, 2015; Volume 92.
- Morata, F.; Sandoval, I.S. European Energy Policy: An Environmental Approach; Edward Elgar Publishing: Cheltenham, UK, 2012; ISBN 0857939211.
- Nemet, G.F. Beyond the learning curve: Factors influencing cost reductions in photovoltaics. Energy Policy 2006, 34, 3218–3232.
- Gul, M.; Kotak, Y.; Muneer, T. Review on recent trend of solar photovoltaic technology. Energy Explor. Exploit. 2016, 34, 485–526.
- Needleman, D.B.; Poindexter, J.R.; Kurchin, R.C.; Peters, I.M.; Wilson, G.; Buonassisi, T. Economically sustainable scaling of photovoltaics to meet climate targets. Energy Environ. Sci. 2016, 9, 2122–2129.
- Peng, H.; Liu, Y. How government subsidies promote the growth of entrepreneurial companies in clean energy industry: An empirical study in China. J. Clean. Prod. 2018, 188, 508–520.
- Tawalbeh, M.; Al-Othman, A.; Kafiah, F.; Abdelsalam, E.; Almomani, F.; Alkasrawi, M. Environmental impacts of solar photovoltaic systems: A critical review of recent progress and future outlook. Sci. Total Environ. 2020, 759, 143528.
- Solangi, K.H.; Islam, M.R.; Saidur, R.; Rahim, N.A.; Fayaz, H. A review on global solar energy policy. Renew. Sustain. Energy Rev. 2011, 15, 2149–2163.
- Timilsina, G.R.; Kurdgelashvili, L.; Narbel, P.A. Solar energy: Markets, economics and policies. Renew. Sustain. Energy Rev. 2012, 16, 449–465.
- Pitt, D.; Congreve, A. Collaborative approaches to local climate change and clean energy initiatives in the USA and England. Local Environ. 2017, 22, 1124–1141.
- Lau, L.C.; Tan, K.T.; Lee, K.T.; Mohamed, A.R. A comparative study on the energy policies in Japan and Malaysia in fulfilling their nations’ obligations towards the Kyoto Protocol. Energy Policy 2009, 37, 4771–4778.
- Liu, L.; Wang, Z.; Zhang, H.; Xue, Y. Solar energy development in China—A review. Renew. Sustain. Energy Rev. 2010, 14, 301–311.
- Wu, H.; Hou, Y. Recent development of grid-connected PV systems in China. Energy Procedia 2011, 12, 462–470.
- Petroleum, B. BP Statistical Review of world energy 2015. Br. Pet 2017, 66, 1–52.
- Kabir, E.; Kumar, P.; Kumar, S.; Adelodun, A.A.; Kim, K.-H. Solar energy: Potential and future prospects. Renew. Sustain. Energy Rev. 2018, 82, 894–900.
- Rabaia, M.K.H.; Abdelkareem, M.A.; Sayed, E.T.; Elsaid, K.; Chae, K.-J.; Wilberforce, T.; Olabi, A.G. Environmental impacts of solar energy systems: A review. Sci. Total Environ. 2021, 754, 141989.
- Pachauri, R.K.; Allen, M.R.; Barros, V.R.; Broome, J.; Cramer, W.; Christ, R.; Church, J.A.; Clarke, L.; Dahe, Q.; Dasgupta, P. Climate Change 2014: Synthesis Report. Contribution of Working Groups I, II and III to the Fifth Assessment Report of the Intergovernmental Panel on Climate Change; IPCC: Geneva, Switzerland, 2014; ISBN 9291691437.
- Philibert, C.; Frankl, P.; Tam, C.; Abdelilah, Y.; Bahar, H.; Marchais, Q.; Wiesner, H. Technology Roadmap: Solar Photovoltaic Energy; International Energy Agency: Paris, France, 2014.
- Grau, T.; Huo, M.; Neuhoff, K. Survey of photovoltaic industry and policy in Germany and China. Energy Policy 2012, 51, 20–37.
- Sen, S.; Ganguly, S. Opportunities, barriers and issues with renewable energy development–A discussion. Renew. Sustain. Energy Rev. 2017, 69, 1170–1181.
- Ahmad, L.; Khordehgah, N.; Malinauskaite, J.; Jouhara, H. Recent advances and applications of solar photovoltaics and thermal technologies. Energy 2020, 207, 118254.
- Whiteman, A.; Esparrago, J.; Elsayed, S. Renewable Energy Statistics 2018; International Renewable Energy Agency: Abu Dhabi, United Arab Emirates, 2018.
- IRENA. Future of Solar Photovoltaic: Deployment, Investment, Technology, Grid Integration and Socio-Economic Aspects (A Global Energy Transformation: Paper); Abu Dhabi. 2019. ISBN 9789292601553. Available online: www.irena.org/publications (accessed on 1 June 2021).
- Observ, E.R. The state of renewable energies in europe: Frankfurt School of Finance and Management (DE), Fraunhofer ISI (DE) and Statistics Netherlands (NL), Report, 18th EuroObserv’ER, Edition. 2013; Volume 33, p. 103.
- Boshell, F.; Gielen, D.; Roesch, R.; Anisie, A.; Salgado, A.; Ratka, S. Innovation Driving The Energy Transition. In Global Innovation Index 2018; IRENA: Abu Dhabi, United Arab Emirates, 2018; p. 97.
- IEA. Renewable Energy and Jobs–Annual Review; IEA: Abu Dhabi, United Arab Emirate, 2020; ISBN 978-92-9260-266-6.
- Burns, J.E.; Kang, J.-S. Comparative economic analysis of supporting policies for residential solar PV in the United States: Solar Renewable Energy Credit (SREC) potential. Energy Policy 2012, 44, 217–225.
- Fouquet, D.; Johansson, T.B. European renewable energy policy at crossroads—Focus on electricity support mechanisms. Energy Policy 2008, 36, 4079–4092.
- Sarasa-Maestro, C.J.; Dufo-López, R.; Bernal-Agustín, J.L. Photovoltaic remuneration policies in the European Union. Energy Policy 2013, 55, 317–328.
- Poullikkas, A. Parametric cost–benefit analysis for the installation of photovoltaic parks in the island of Cyprus. Energy Policy 2009, 37, 3673–3680.
- Papadopoulos, A.M.; Karteris, M.M. An assessment of the Greek incentives scheme for photovoltaics. Energy Policy 2009, 37, 1945–1952.
- Celik, A.N.; Muneer, T.; Clarke, P. A review of installed solar photovoltaic and thermal collector capacities in relation to solar potential for the EU-15. Renew. Energy 2009, 34, 849–856.
- Ren, H.; Gao, W.; Ruan, Y. Economic optimization and sensitivity analysis of photovoltaic system in residential buildings. Renew. Energy 2009, 34, 883–889.
- Luethi, S. Effective deployment of photovoltaics in the Mediterranean countries: Balancing policy risk and return. Sol. Energy 2010, 84, 1059–1071.
- Dusonchet, L.; Telaretti, E. Economic analysis of different supporting policies for the production of electrical energy by solar photovoltaics in western European Union countries. Energy Policy 2010, 38, 3297–3308.
- Focacci, A. Residential plants investment appraisal subsequent to the new supporting photovoltaic economic mechanism in Italy. Renew. Sustain. Energy Rev. 2009, 13, 2710–2715.
- Dincer, F. The analysis on photovoltaic electricity generation status, potential and policies of the leading countries in solar energy. Renew. Sustain. Energy Rev. 2011, 15, 713–720.
- Cucchiella, F.; D’Adamo, I. Feasibility study of developing photovoltaic power projects in Italy: An integrated approach. Renew. Sustain. Energy Rev. 2012, 16, 1562–1576.
- Orioli, A.; Di Gangi, A. Effects of the Italian financial crisis on the photovoltaic dissemination in a southern city. Energy 2013, 62, 173–184.
