Your browser does not fully support modern features. Please upgrade for a smoother experience.
Please note this is a comparison between Version 1 by Sebastien Jacques and Version 2 by Vivi Li.
Segmentation of brain tumor images from magnetic resonance imaging (MRI) is a challenging topic in medical image analysis. The brain tumor can take many shapes, and MRI images vary considerably in intensity, making lesion detection difficult for radiologists. Image segmentation is the action of grouping pixels according to predefined criteria, in order to build regions or classes of pixels. There are several methods of image segmentation: methods based on contours, regions, classification, or hybrid. Segmentation and its automation remain today one of the major challenges in MRI, mainly in relation to brain tumor images, in order to help the practitioner in his daily practice, in the presence of a huge volume of images.
- brain tumor
- image segmentation
- PSO
- ANOVA
- K-means
1. What Is a Brain Tumor?
A brain tumor is a cluster of uncontrolled cancer cells that grow in or around the brain. Brain tumors are divided into two categories: primary tumors, originating in the brain or spinal cord, and secondary tumors, also called brain metastases, which develop elsewhere in the body and spread to the brain [1]. In the first category (i.e., primary tumors), the probability of a person developing this type of tumor in their lifetime is less than 1% [2]. This probability is low; however in 2020, for example, it still represented just over 308,000 people diagnosed worldwide [3]. A figure that should also alert reusearchers, is the increased incidence of brain tumors at all ages over the last 20 years. For example, the incidence has increased by more than 40% in adults. In the second category (i.e., secondary tumors), the cancers that most often spread to the brain are breast, kidney, and lung cancers, as well as leukemia, lymphoma, and melanoma [4].
A brain tumor can take many forms; it is therefore difficult for radiologists and physicians to diagnose it indisputably, because medical imaging images can vary in intensity. Several approaches for detecting and segmenting brain tumors from magnetic resonance imaging (MRI) images have been proposed in the literature, to help practitioners make their diagnoses [5][6][5,6].
In addition to MRI, functional ultrasound is a modality that is gaining recognition in medicine. Functional ultrasound can allow the imaging of the neuronal activity of the brain in small, awake, and mobile animals. Nevertheless, such a modality requires long ultrasound acquisitions at high frequency, to have an acceptable sensitivity; hence, possible material constraints [7].
During brain tumor surgery, two types of difficulties may arise: (i) identification of the tumor and its boundaries related to the healthy brain; (ii) identification of functional brain regions, i.e., those involved in neurological functions (skills, sensitivity, language, vision, cognition, etc.). The standard gold method currently used to improve the quality of brain tumor resection, while minimizing neurological risk, is so-called ‘standby’ surgery with direct electrical brain stimulation. Practitioners commonly use ultrasound to localize the tumor in the brain; however, to date, there are no pre- or intra-operative imaging tools to identify functional brain regions [8]; hence the need for innovative imaging in this area, such as high-frequency Doppler ultrasound, in the surgical management of patients with awake brain tumors. Ultrahigh frequency achieves a spatial resolution of 30 μm, and is thus more than five times better than MRI. The Doppler mode [9][10][11][12][9,10,11,12] detects microvascular flows at velocities less than 1 mm/second.
Gliomas are the most common primary brain tumors in adults. Nearly 3000 new cases are diagnosed each year in France. Men are more frequently affected. Most cases are sporadic, but in rare cases they are associated with certain family cancers [13][14][13,14].
About 75% of gliomas diagnosed are high-grade (III or IV of the World Health Organization (WHO) classification) [15].
Gliomas can develop in any region of the brain. They progressively infiltrate the brain parenchyma, and cause a mass effect.
Today, if the clinical examination should suggest a tumoral process, the diagnosis of a brain tumor relies on magnetic resonance imaging (MRI), due to its shooting in all orientations, its intrinsic 3D, its non-use of ionizing radiation, and its precision.
2. MRI Sequences for Brain Tumors
Brain MRI, with or without the injection of contrast products such as gadolinium, is systematic in cases of a suspected brain tumor. Brain MRI enables:
- -
-
the localization of the expansive process of the tumor, and the specification of its local extension;
- -
-
the specification of its characteristics, e.g., is it homogeneous or heterogeneous; is there perilesional edema, calcifications, necrosis, or intratumoral hemorrhage?;
- -
-
the establishment of a differential diagnosis between a brain tumor and a circumscribed lesion of another nature, e.g., an abscess;
- -
-
the establishment of the diagnosis of certain evolving tumor complications (hemorrhage, hydrocephalus, tumor meningitis, etc.).
- -
-
the establishment of the histological grade, in cases of a glial tumor;
- -
-
the definition of the quality of the tumor removal, and the continuation of the therapeutic strategy after the surgical time.
The most common MRI sequences are T1- and T2-weighted scans, where T1 and T2 are tissue-specific time constants.
T1-weighted images are produced using short TE and TR times, and vice versa for T2-weighted images, where TR is the repetition time, defined as the time interval between two excitations, and TE is the echo time, defined as the interval between the excitation and the appearance of the MRI signal. Generally, T1- and T2-weighted images can be easily differentiated, by observing the cerebrospinal fluid (CSF). The CSF is dark on T1-weighted images, and clear on T2-weighted images.
A third sequence that researchwers will use in theiour work is the FLAIR sequence (i.e., fluid attenuated inversion recovery), which is an inversion-recovery sequence well-adapted to brain imaging, in which the cerebrospinal fluid signal is suppressed or strongly attenuated, and a long TE is used, to give it a solid T2 weighting. The FLAIR sequence has significantly improved the detection of brain parenchymal lesions, particularly those located at the parenchymal–CSF interface. White-matter pathologies (softening, demyelination processes, etc.) appear hyperintense. This sequence is particularly interesting for the early diagnosis of ischemic events; it allows researchersus to obtain an image of excellent definition in a few minutes and can, contrary to the diffusion or perfusion sequences that researcherswe will not use in this work, be performed on all MRI machines. Currently available in 3D volume acquisition, it is part of the basic MRI workup of the brain.
Table 1 compares T1, T2, and FLAIR sequences in the context of brain tissue consisting of gray matter, CSF, and white matter.
Table 1.
Analysis of basic MRI sequences in the context of brain tumors.
| Tissue | T1-Weighted | T2-Weighted | FLAIR |
|---|---|---|---|
| White Matter | Light | Dark Gray | Dark Gray |
| Fat | Bright | Light | Light |
| CSF | Dark | Bright | Dark |
| Inflammation | Dark | Bright | Bright |
| Cortex | Gray | Light Gray | Light Gray |
Figure 1A shows an example of a FLAIR MRI sequence where a cyst is highlighted (see arrow); Figure 1B illustrates a cross-section in the axial plane of the human brain. Interestingly, the FLAIR sequence is very ‘sensitive’ to pathology, and clearly detects the cyst.
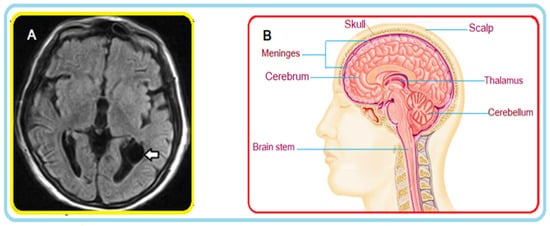
Figure 1. (A) MRI of the brain: axial FLAIR section. A thin-walled cyst-like image (arrow) consistent with an ependymal cyst can be seen in the occipital extension of the left lateral ventricle. (B) Brain cross-section (illustration).
Figure 2 shows an example of three MRI sequences: T1-Weighted, T2-Weighted, and FLAIR; in Figure 3, researchwers have represented a T1-Weighted MRI sequence (noted simply ‘T1’) with and without contrast medium. The T1 sequence with contrast medium is noted ‘T1c’—sometimes noted ‘T1-Gd’, when the contrast agent is Gadolinium. This image represents a metastatic malignant melanoma. T1-weighted MRI shows multiple secondary lesions that are spontaneously hyper-signal. After injection of a contrast medium, the T1c image shows that the lesions have been enhanced, and are therefore better visualized, and new lesions are detected.
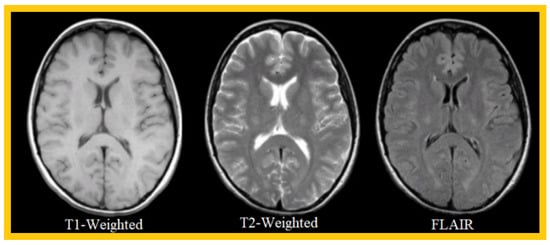
Figure 2.
Example of 3 MRI sequences: T1-Weighted, T2-Weighted, and FLAIR.

Figure 3.
Comparison between a T1-Weighted MRI sequence without a contrast agent (T1) and the same sequence with a contrast agent (T1c).
Figure 4 shows an example of MRI sequences from the BraTS 2015 database [16], representing brain tumor pathologies. These sequences are FLAIR, T1, T1c (or, more precisely, T1-Gd, because the contrast agent used is Gadolinium), T2, and Ground Truth performed by specialists on which the FLAIR sequence is superimposed. The colors represent classes of tumors: red for necrosis; green for edema; and yellow for tumor.
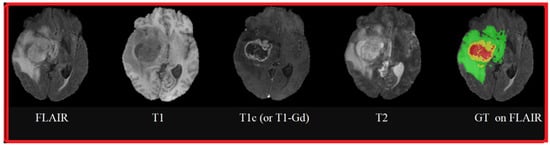
Figure 4.
MRI sequences of brain tumors: FLAIR, T1, T1 contrasted by Gadolinium injection, T2, and Ground Truth superimposed on the FLAIR sequence.
3. Why Researchers Should Be Interested in Brain Tumor Segmentation?
3. Why We Should Be Interested in Brain Tumor Segmentation?
Image segmentation is the action of grouping pixels according to predefined criteria, in order to build regions or classes of pixels. There are several methods of image segmentation: methods based on contours, regions, classification, or hybrid. Segmentation and its automation remain today one of the major challenges in MRI, mainly in relation to brain tumor images, in order to help the practitioner in his daily practice, in the presence of a huge volume of images. These segmentation methods have long been manual or semi-automatic but, with the advent of new methods, some are now fully automated.
The segmentation of brain tumors is vital, because the patient’s life depends on it; the direct implication of reseaourchers' research is to propose efficient and safe methods to respond to this delicate operation fully. Indeed, the segmentation of brain tumors from MRI images, presented in researchers'our work, has direct practical implications for establishing an efficient diagnosis, following the tumor’s progression, or for evaluating the relevance of the prescribed treatment and therapy. It is well known that manual segmentation and analysis of structural MRI images of brain tumors is tedious and time-consuming; therefore, automated and robust segmentation of brain tumors will have a significant impact on disease management, by providing essential information about the nature, volume, location, and shape of the tumor [17][18][17,18].
Figure 5 shows an example of successful segmentation. The Ground Truth segmentation is a manual segmentation performed by experts, and globally it corresponds to the proposed automatic segmentation. The visualized MRI sequences are from the BraTS 2015 database, and correspond to T1, T2, T1c, and FLAIR sequences.
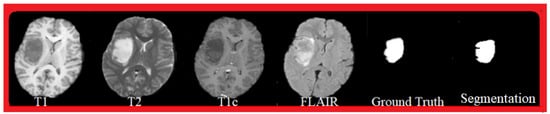
Figure 5.
Segmentation result: MRI sequences: T1, T2, T1c, FLAIR, Ground Truth, and segmentation.
Figure 6 shows the detection result (center image) of ouresearchers' approach, from a T1 MRI sequence with contrast medium (left image) and segmentation (in green) binarization (right image).
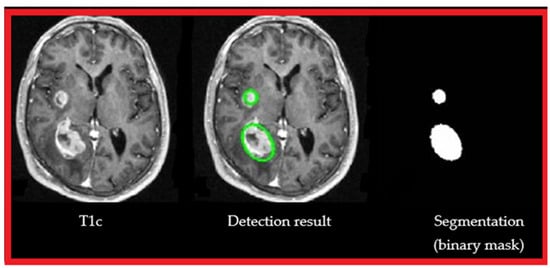
Figure 6.
Segmentation result: T1c, automatic detection of brain tumors, segmentation, and binarization.
4. Brain Tumor Segmentation Algorithms
As reported in [19], brain tumor segmentation algorithms can be grouped into three main categories: (1) conventional techniques; (2) classification and clustering techniques; and (3) deformable model techniques [20][21][20,21]. Threshold-based techniques, which compare pixel intensity to one or more intensity thresholds, belong to the first category: conventional techniques [22][23][22,23]. For example, an Otsu thresholding approach, combined with some morphological operations (i.e., dilation and erosion), was proposed in [24], to detect brain tumor diseases from MRI images. An extended method that would give more accurate thresholding performance was proposed in [25]. In addition, region-based techniques, in which disjoint regions are formed by merging neighboring pixels, based on a similarity criterion, are also classified in the first category [26]; these techniques include region-growth and watershed segmentation techniques. For example, an adaptive region-growing approach was proposed in [27], to solve the problem of manual threshold selection and weakness against noise; this approach was based on the variances and gradients of the inter- and intra-boundary curves. In another work, [28], the authors presented a region-growth approach based on a fixed threshold value for MRI segmentation, enhanced by an efficient pre-processing framework. In work presented by Biratu et al. [29], the authors modified the principle of the classical region-growing segmentation method; they applied it to the detection of abnormality regions in brain images. The seed point initialization, in the suggested method, was designed to be generated automatically for any input brain images, in contrast to the classical approach, where the seed point should be initialized manually. Khosravanian et al. [30] suggested a level set segmentation technique, based on the super-pixel fuzzy clustering and lattice Boltzmann method for autonomously segmenting brain tumors, which is strongly resistant to image intensity and noise.
The second category of brain tumor segmentation algorithms—classification and clustering techniques—includes several effective algorithms [31], such as K-means, support vector machines (SVMs), Markov random fields, artificial neural networks, convolutional neural networks (CNNs), and fuzzy C-means. For example, an SVM classification scheme, combined with a kernel-space feature selection methodology, was proposed in [32] for brain tumor segmentation. An unsupervised framework, based on random forests, was proposed in [33], to extract the tumor location, followed by a pattern classification phase. To define the tumor area, 86 features were used to create a training dataset, to be presented as input to the classifier. Currently, CNNs, or deep-learning-based models, have performed impressively in several medical imaging applications [34][35][36][34,35,36], as they assist in understanding complex patterns precisely. For example, a fully supervised system for brain tumor segmentation, based on a CNN architecture that exploits local and global contextual features, was proposed in [37]. In a recently published paper [38], fast convolutional neural networks were used to train, classify, and distinguish tumor from non-tumor patterns; training focused on patches and slices of axial, coronal, and sagittal brain views. Hussain et al. [39] created a correlation architecture of a parallel CNN layer and a linear CNN layer, by including an induction structure. Segmenting MR images of brain tumors, using this structure, has produced positive results. Using unpaired adversarial training, Li et al. [40] developed the innovative framework called TumorGAN, to provide efficient image segmentation of pairs. They added a regional perceptual loss, to improve the discriminator’s performance and the quality of the output images. Additionally, they created a localized L1 loss, to limit the color of the observed brain tissue. Arora et al. [41] proposed an automatic system to tackle the task of segmenting gliomas from MRI scans, based on a U-Net-based deep-learning model. Before presenting the input image to the deep model, the system transformed it by applying various approaches, including feature scaling, subset division, restricted object region, category brain slicing, and watershed segmentation. An approach for automatic segmentation, based on texture and contour, was proposed by Nabizadeh and Kubat [42]. The machine learning classifier was trained using landmark points, after determining high-level features. In the present work, researchwers opted for K-means, which is an unsupervised learning model applying non-hierarchical data partitioning. This algorithm categorizes the data into multiple clusters, respecting the principle of exclusivity of membership: a single observation can only belong to one cluster. The advantage of K-means lies in its simplicity and the fact that it is used daily in the socio-economic world for data segmentation.
The third category of brain tumor segmentation algorithms consists of deformable model techniques, including parametric and geometric deformable models. These techniques have been proposed, among other things, to support intuitive interaction and high variability of mechanisms. For example, metaheuristic techniques have also been used for brain tumor segmentation, exploiting their ability to solve challenging optimization problems in minimal time, while avoiding local optima. Several techniques for brain tumor segmentation based on metaheuristics have been reported in the literature [43][44][43,44]. In [43], the Cuckoo search algorithm, an efficient optimization model, was applied to brain tumor segmentation, from MRI images. The ant colony optimization metaheuristic and a fuzzy classification approach were combined in [44], to segment and extract the suspicious region from the brain MRI image containing the tumor position. In a recent paper, [6], the authors proposed a novel region of interest (ROI)-based brain tumor segmentation method. The region of interest was first identified, using grid decomposition, and then only the region of interest was segmented, using the spectral clustering method. Segmenting the brain tumor from a region of interest, rather than from the entire image, is an attractive concept. Nevertheless, this approach was limited by the increased computational complexity resulting from the ROI identification step. In this enstry, researchersudy, we performed an analysis of variance (ANOVA) on the data, to quantify the differences between the results. ANOVA is a statistical method generally used to assess the similarity of means in different groups, by comparing variances [45][46][45,46]. The main advantages of ANOVA over other statistical methods lie in the following four points:
-
It is easy to implement, using simple algebra.
-
It can be used to compare more than two samples.
-
It can be applied to groups with different numbers of observations.
-
It has been widely used, and has proven effective in various research fields, such as pharmacology and medicine.