Your browser does not fully support modern features. Please upgrade for a smoother experience.
Please note this is a comparison between Version 2 by Camila Xu and Version 1 by Dimitris Mourtzis.
A dashboard application is proposed and developed to act as a Digital Twin that would indicate the Measured Value to be held accountable for any future failures. The dashboard is implemented in the Java programming language, while information is stored into a Database that is aggregated by an Online Analytical Processing (OLAP) server. This achieves easy Key Performance Indicators (KPIs) visualization through the dashboard.
- digital twin
- decision support system
- factor analysis
- KPI
1. Introduction
Todays’ manufacturing era focuses on monitoring the process on shop-floor by utilizing various sensorial systems that are based on data collection [1,2,3][1][2][3]. The automated systems directly collect an enormous amount of performance data from the shop-floor (Figure 1), and are stored into a repository, in a raw or accumulated form [4,5][4][5]. However, automated decision making in the era of Industry 4.0 is yet to be discovered.

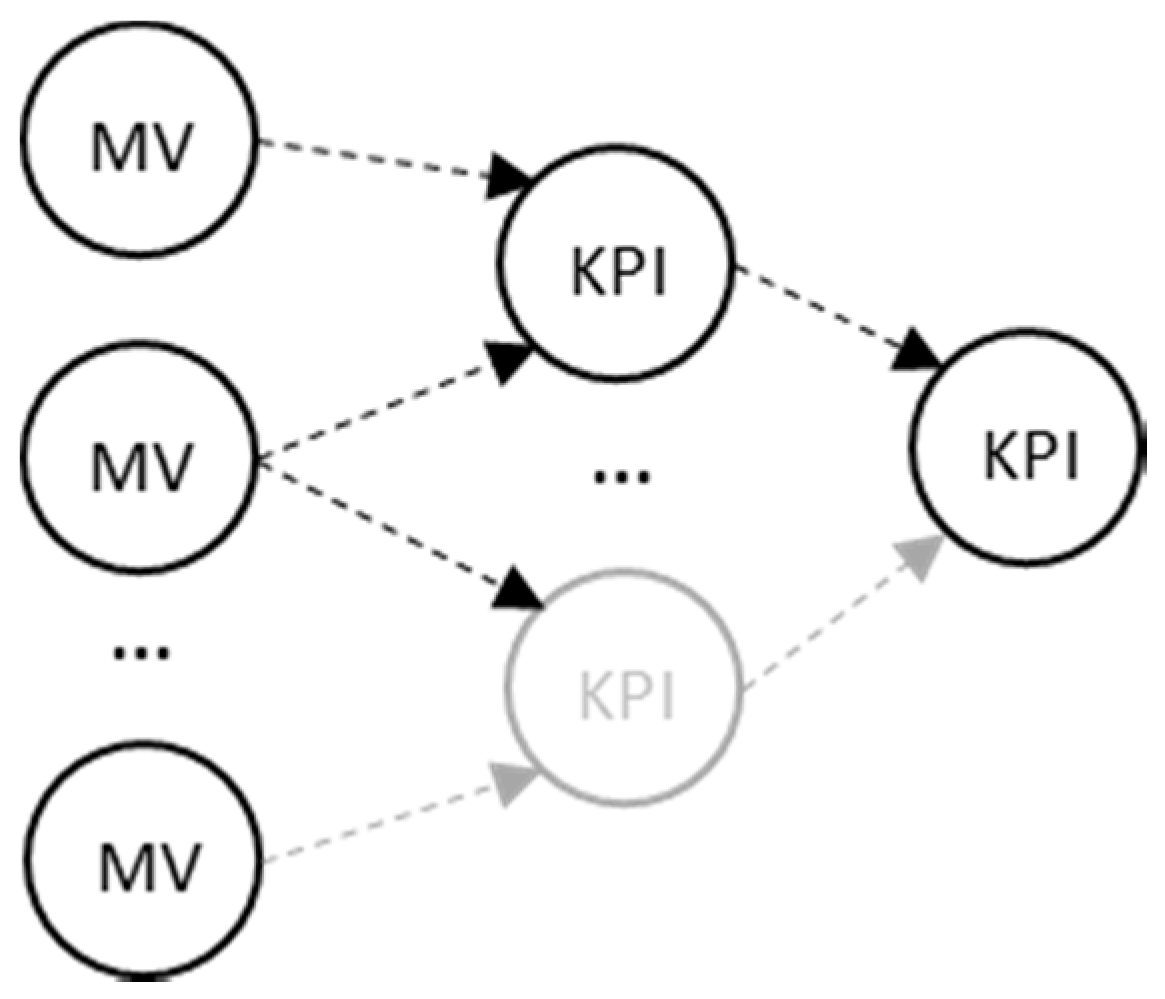 Figure 1. Key Performance Indications (KPIs) aggregation from Measured Values (MV).
2. KPIs and Digital Twin Platforms in Manufacturing
A lot of KPIs have been defined in literature (Manufacturing, Environmental, Design, and Customer) [7][6], and, despite the fact that methods have been developed for the precise acquisition of measured values [8][7], the interconnection of the values (Figure 1) can lead to mistaken decision making when one searches for the root cause of an alarm occurring in a manufacturing environment.
In addition, regarding manufacturing-oriented dashboard systems, they aid in the visualization of complex accumulations, trends, and directions of Key Performance Indications (KPIs) [9][8]. However, despite the situation awareness [10][9] that they offer, they are not able to support the right decision made at management level by elaborating automatically the performance metrics and achieving profitable production [11][10]. In the meantime, multiple criteria methods are widely used for decision support or the optimization of production, plant, or machine levels [1,12][1][11], based (mainly) on the four basic manufacturing attributes i.e.,: Cost, Time, Quality, and Flexibility levels [1]. This set of course can be extended. The “performance” that is collected from the shop-floor has been considered as measured values (MV) and their aggregation or accumulation into higher level Key Performance Indicators, as initially introduced by [13][12]. The goal of all these is the achievement of digital manufacturing [14][13].
On the other hand, the term digital twin can be considered as an “umbrella”, and it can be implemented with various technologies beneath, such as physics [15][14], machine learning [16][15], and data/control models [17][16]. A digital twin deals with giving some sort of feedback back to the system and it varies from process level [15][14] to system level [18][17], and it can even handle design aspects [19][18].
Regarding commercial dashboard solutions, they enable either manual or automated input of measured values for the production of KPIs [20,21,22][19][20][21]. However, their functionality is limited to the reporting features of the current KPI values, typically visualized with a Graphical User Interface (GUI), usually cluttered, with gauges, charts, or tabular percentages. Additionally, there is need to incorporate various techniques from machine learning or Artificial Intelligence in general [23][22] and signal processing techniques [24][23]. The typical functionality that is found in dashboards serves as a visual display of the most important information for one or more objectives, consolidated and arranged on a single screen, so as for the information to be monitored at a glance [9][8]. This is extended in order to analyze the aggregated KPIs and explore potential failures in the future by utilizing monitored production performances. Finding, however, the root cause of a problem occurring, utilizing the real time data in an efficient and fast way, is still being pursued.
3. Similar Methods and Constrains on Applicability
In general, categories in root-cause finding are hard to be defined, but if one borrows the terminology from Intrusion Detection Alarms [25][24], they can claim that there are three major categories: anomaly detection, correlation, and clustering. Specific examples of all three in decision making are given below, in the next paragraph. The alternative classifications of the Decision Support Systems that are given below permit this categorization; the first classification [26][25] regards: (i) Industry specific packages, (ii) Statistical or numerical algorithms, (iii) Workflow Applications, (iv) Enterprise systems, (v) Intelligence, (vi) Design, (vii) Choice, and (viii) Review. Using another criterion, the second classification [27][26] concerns: (a) communications driven, (b) data driven, (c) document driven, (d) knowledge driven, and (e) model driven.
There are several general purpose methods that are relevant and are mentioned here to achieve root-cause finding. Root Cause Analysis is a quite good set of techniques, however, it remains on the descriptive empirical strategy level [28,29][27][28]. Moreover, scorecards are quite descriptive and empirical, while the Analytical Hierarchical Process (AHP) requires criteria definition [30][29]. Finally, Factor Analysis, requires a specific kind of manipulation/modelling due to its stochastic character [31][30].
Regarding specific applications in manufacturing-related decision making, usually finding that the root-cause has to be addressed through identifying a defect in the production. Defects can refer to either product unwanted characteristics, or resources’ unwanted behaviour. Methods that have been previously used—regardless of the application—are Case Based Reasoning [32][31], pattern recognition [33[32][33],34], Analysis of Variance (ANOVA) [35][34], neural networks [36][35], Hypothesis testing [37][36], Time Series [38][37], and many others. However, none of these methods is quick enough to give the results from a deterministic point of view and without using previous measurements for training. Additionally, they are quite focused in application terms, which means that they cannot be used without re-calibration to a different set of KPIs. On the other hand, traditional Statistical Process Control (SPC) does not offer solutions without context, meaning the combination of the application and method [31][30].
References
- Chryssolouris, G. Manufacturing Systems: Theory and Practice; Springer: New York, NY, USA, 2006.
- Larreina, J.; Gontarz, A.; Giannoulis, C.; Nguyen, V.K.; Stavropoulos, P.; Sinceri, B. Smart manufacturing execution system (SMES): The possibilities of evaluating the sustainability of a production process. In Proceedings of the 11th Global Conference on Sustainable Manufacturing, Berlin, Germany, 23–25 September 2013; pp. 517–522.
- Ding, K.; Chan, F.T.; Zhang, X.; Zhou, G.; Zhang, F. Defining a digital twin-based cyber-physical production system for autonomous manufacturing in smart shop floors. Int. J. Prod. Res. 2019, 57, 6315–6334.
- Stavropoulos, P.; Chantzis, D.; Doukas, C.; Papacharalampopoulos, A.; Chryssolouris, G. Monitoring and control of manufacturing processes: A review. Procedia CIRP 2013, 8, 421–425.
- Zendoia, J.; Woy, U.; Ridgway, N.; Pajula, T.; Unamuno, G.; Olaizola, A.; Fysikopoulos, A.; Krain, R. A specific method for the life cycle inventory of machine tools and its demonstration with two manufacturing case studies. J. Clean. Prod. 2014, 78, 139–151.
- Mourtzis, D.; Fotia, S.; Vlachou, E. PSS design evaluation via kpis and lean design assistance supported by context sensitivity tools. Procedia CIRP 2016, 56, 496–501.
- Peng, K.; Zhang, K.; Dong, J.; Yang, X. A new data-driven process monitoring scheme for key performance indictors with application to hot strip mill process. J. Frankl. Inst. 2014, 351, 4555–4569.
- Few, S. Information Dashboard Design: The Effective Visual Communication of Data; O’Reilly Media, Inc.: Sebastopol, CA, USA, 2006; Volume 3, Edv 161245.
- Ghimire, S.; Luis-Ferreira, F.; Nodehi, T.; Jardim-Goncalves, R. IoT based situational awareness framework for real-time project management. Int. J. Comput. Integr. Manuf. 2016, 30, 74–83.
- Epstein, M.J.; Roy, M.J. Making the business case for sustainability: Linking social and environmental actions to financial performance. J. Corp. Citizsh. 2003, 79–96.
- Apostolos, F.; Alexios, P.; Georgios, P.; Panagiotis, S.; George, C. Energy efficiency of manufacturing processes: A critical review. Procedia CIRP 2013, 7, 628–633.
- Kaplan, R.S.; Norton, D.P. The Strategy-Focused Organization: How Balanced Scorecard Companies Thrive in the New Business Environment; Harvard Business School Press: Boston, MA, USA, 2001.
- Mourtzis, D.; Papakostas, N.; Mavrikios, D.; Makris, S.; Alexopoulos, K. The role of simulation in digital manufacturing: Applications and outlook. Int. J. Comput. Integr. Manuf. 2015, 28, 3–24.
- Papacharalampopoulos, A.; Stavropoulos, P.; Petrides, D.; Motsi, K. Towards a digital twin for manufacturing processes: Applicability on laser welding. In Proceedings of the 13th CIRP ICME Conference, Gulf of Naples, Italy, 17–19 July 2019.
- Athanasopoulou, L.; Papacharalampopoulos, A.; Stavropoulos, P. Context awareness system in the use phase of a smart mobility platform: A vision system utilizing small number of training examples. In Proceedings of the 13th CIRP Conference on Intelligent Computation in Manufacturing Engineering, Gulf of Naples, Italy, 17–19 July 2019.
- Papacharalampopoulos, A.; Stavropoulos, P. Towards a digital twin for thermal processes: Control-centric approach. Procedia CIRP 2019, 86, 110–115.
- Gallego-García, S.; Reschke, J.; García-García, M. Design and simulation of a capacity management model using a digital twin approach based on the viable system model: Case study of an automotive plant. Appl. Sci. 2019, 9, 5567.
- Madni, A.M.; Madni, C.C.; Lucero, S.D. Leveraging digital twin technology in model-based systems engineering. Systems 2019, 7, 7.
- Klipfolio Site 2019. Available online: http://www.klipfolio.com/features#monitor (accessed on 10 February 2020).
- KPI Monitoring 2014. Available online: http://www.360scheduling.com/solutions/kpi-monitoring/ (accessed on 23 October 2016).
- SimpleKPI 2014. Available online: http://www.simplekpi.com/ (accessed on 23 October 2016).
- Monostori, L. AI and machine learning techniques for managing complexity, changes and uncertainties in manufacturing. In Proceedings of the 15th Triennial World Congress, Barcelona, Spain, 21–26 July 2002; pp. 119–130.
- Teti, R. Advanced IT methods of signal processing and decision making for zero defect manufacturing in machining. Procedia CIRP 2015, 28, 3–15.
- Julisch, K. Clustering intrusion detection alarms to support root cause analysis. ACM Trans. Inf. Syst. Secur. 2003, 6, 443–471.
- Sheshasaayee, A.; Jose, R. A theoretical framework for the maintainability model of aspect oriented systems. Procedia Comput. Sci. 2015, 62, 505–512.
- Ada, Ş.; Ghaffarzadeh, M. Decision making based on management information system and decision support system. Eur. Res. 2015, 93, 260–269.
- Energy, U.S.D. Doe Guideline—Root Cause Analysis; US Department of Energy: Washington, DC, USA, 1992; DOE-NE-STD-1004-92.
- Nelms, C.R. The problem with root cause analysis. In Proceedings of the 2007 IEEE 8th Human Factors and Power Plants and HPRCT 13th Annual Meeting, Monterey, CA, USA, 26–31 August 2007; pp. 253–258.
- Kurien, G.P. Performance measurement systems for green supply chains using modified balanced score card and analytical hierarchical process. Sci. Res. Essays 2012, 7, 3149–3161.
- Apley, D.W.; Shi, J. A factor-analysis method for diagnosing variability in mulitvariate manufacturing processes. Technometrics 2001, 43, 84–95.
- Mourtzis, D.; Vlachou, E.; Milas, N.; Dimitrakopoulos, G. Energy consumption estimation for machining processes based on real-time shop floor monitoring via wireless sensor networks. Procedia CIRP 2016, 57, 637–642.
- Masood, I.; Hassan, A. Pattern recognition for bivariate process mean shifts using feature-based artificial neural network. Int. J. Adv. Manuf. Technol. 2013, 66, 1201–1218.
- Stavropoulos, P.; Papacharalampopoulos, A.; Vasiliadis, E.; Chryssolouris, G. Tool wear predictability estimation in milling based on multi-sensorial data. Int. J. Adv. Manuf. Technol. 2016, 82, 509–521.
- Jin, J.; Guo, H. ANOVA method for variance component decomposition and diagnosis in batch manufacturing processes. Int. J. Flex. Manuf. Syst. 2003, 15, 167–186.
- Jeng, J.Y.; Mau, T.F.; Leu, S.M. Prediction of laser butt joint welding parameters using back propagation and learning vector quantization networks. J. Mater. Process. Technol. 2000, 99, 207–218.
- Koufteros, X.A. Testing a model of pull production: A paradigm for manufacturing research using structural equation modeling. J. Oper. Manag. 1999, 17, 467–488.
- Asakura, T.; Ochiai, K. Quality control in manufacturing plants using a factor analysis engine. Nec Tech. J. 2016, 11, 58–62.
More