Your browser does not fully support modern features. Please upgrade for a smoother experience.
Please note this is a comparison between Version 2 by Conner Chen and Version 3 by Conner Chen.
Echocardiography, CT and MRI have a crucial role in the management of congenital heart disease (CHD) patients. All of these modalities can be presented in a two-dimensional (2D) or a three-dimensional (3D) rendered format.
- congenital heart disease (CHD)
- 3D imaging
- echocardiography
1. Introduction
Congenital heart disease patients require precise and reliable imaging to facilitate decision making with respect to surgery, catheter intervention or ongoing review. There is currently a plethora of imaging choices available, including echocardiography, CT and MRI. All of these modalities can be presented in a three-dimensional (3D) rendered format or interrogated by “slicing” images in user-defined imaging planes. Guidelines have been published for each of these modalities for the congenital heart disease patient [1][2][3][4]. The reader is referred to these publications for detailed review of each modality.
The use of a multiplanar approach permits detailed re-analysis of an imaging dataset in any desired plane, but does not present truly three-dimensional (3D) images. In contrast, 3D rendered images can be produced using ultrasound, CT and MRI data. However, the display of such images generally remains on a flat screen, with colour coding used to enhance depth perception. To overcome the limitations of this means of image display, 3D printing has gained traction to allow surgeons and interventionists to be able to have a static physical representation of the true cardiac anatomy.
2. Three-Dimensional Echocardiography
Echocardiography is frequently the only imaging modality used in congenital cardiac patients, even when surgical repair is required. Conventional two-dimensional (2D) echocardiography necessitates mental reconstruction of the 3D image for each cardiac lesion. The way in which images are displayed in 2D is not intuitive to many surgeons and often the appearance does not resemble the anatomy as viewed intraoperatively. The limitations to 2D echocardiography become more evident in complex lesions, especially when compared to CT and MRI data. By using 3D echocardiography, cardiac anatomy is depicted in all dimensions; while retaining adjacent anatomic landmarks to assist with orientation. The major advantage of this is that it provides clinicians with the depth of field that is missing in conventional echocardiography. Furthermore, in contrast to 3D CT and MRI, dynamic motion of the heart, including heart valves, is retained. This provides clinicians with better perspective of cardiac structures and allows for a more accurate evaluation of morphology, relative position, area, circumference and dynamic variation during the cardiac cycle [5] (Figure 1). This technique also offers non-conventional views, not available on 2D imaging [6], including the so called ‘en face’ view which mirrors the intraoperative surgical view and allows for rapid understanding of the pathology with surgeons’ and cardiologists’ collaboration in postprocessing [7].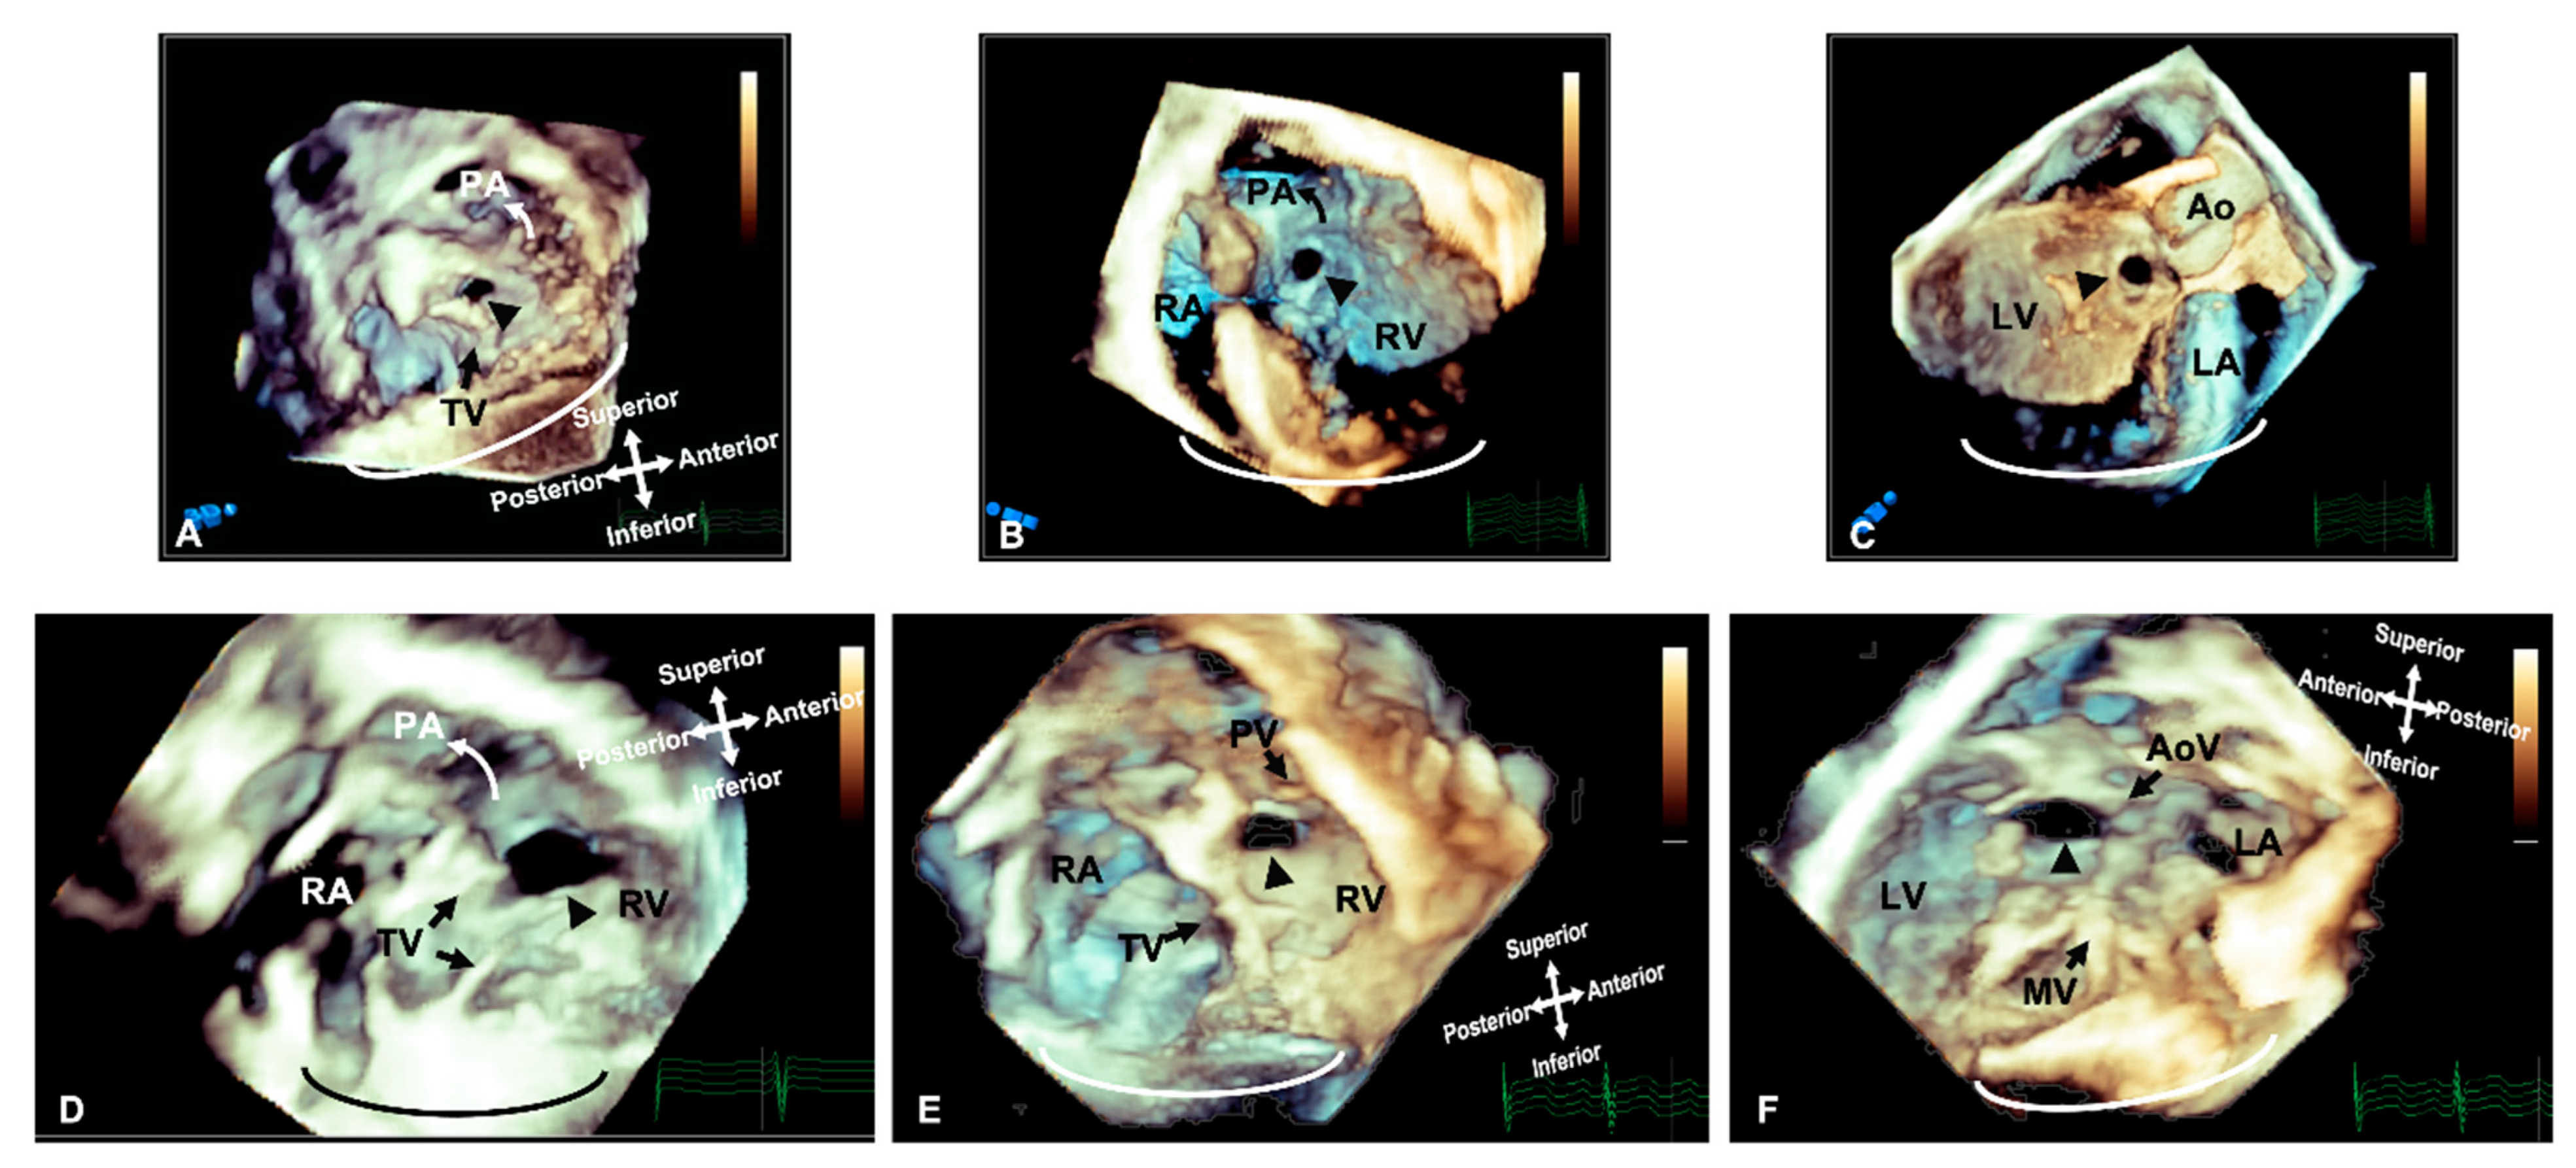
Figure 1. Three-dimensional rendered imaging demonstrating the appearance of VSDs of various morphologies. (A) Demonstrates a perimembranous VSD (arrowhead), as seen from the right ventricular view—here, it can be seen the area of proximity between the defect and the TV, which allows fibrous continuity between the AoV and the TV. An outlet muscular VSD (arrowhead) seen from the right ventricle and (B,C) left ventricle—the tissue surrounding the defect and the distance from the AoV makes it suitable for consideration of device closure. (D) A view from the right ventricle showing a large muscular VSD (arrowhead) positioned more anteriorly towards the pulmonary artery. A doubly committed VSD, as seen from the right ventricle (E) and left ventricle (F), demonstrating the proximity to the outlet valves, which allow fibrous continuity of the PV and AoV. All images are shown in anatomic orientation. Ao: Aorta; AoV: Aortic valve; LV: Left ventricle; MV: Mitral valve; PA: Pulmonary valve; PV: Pulmonary valve; RA: Right atrium; RV: Right ventricle and TV: Tricuspid valve.
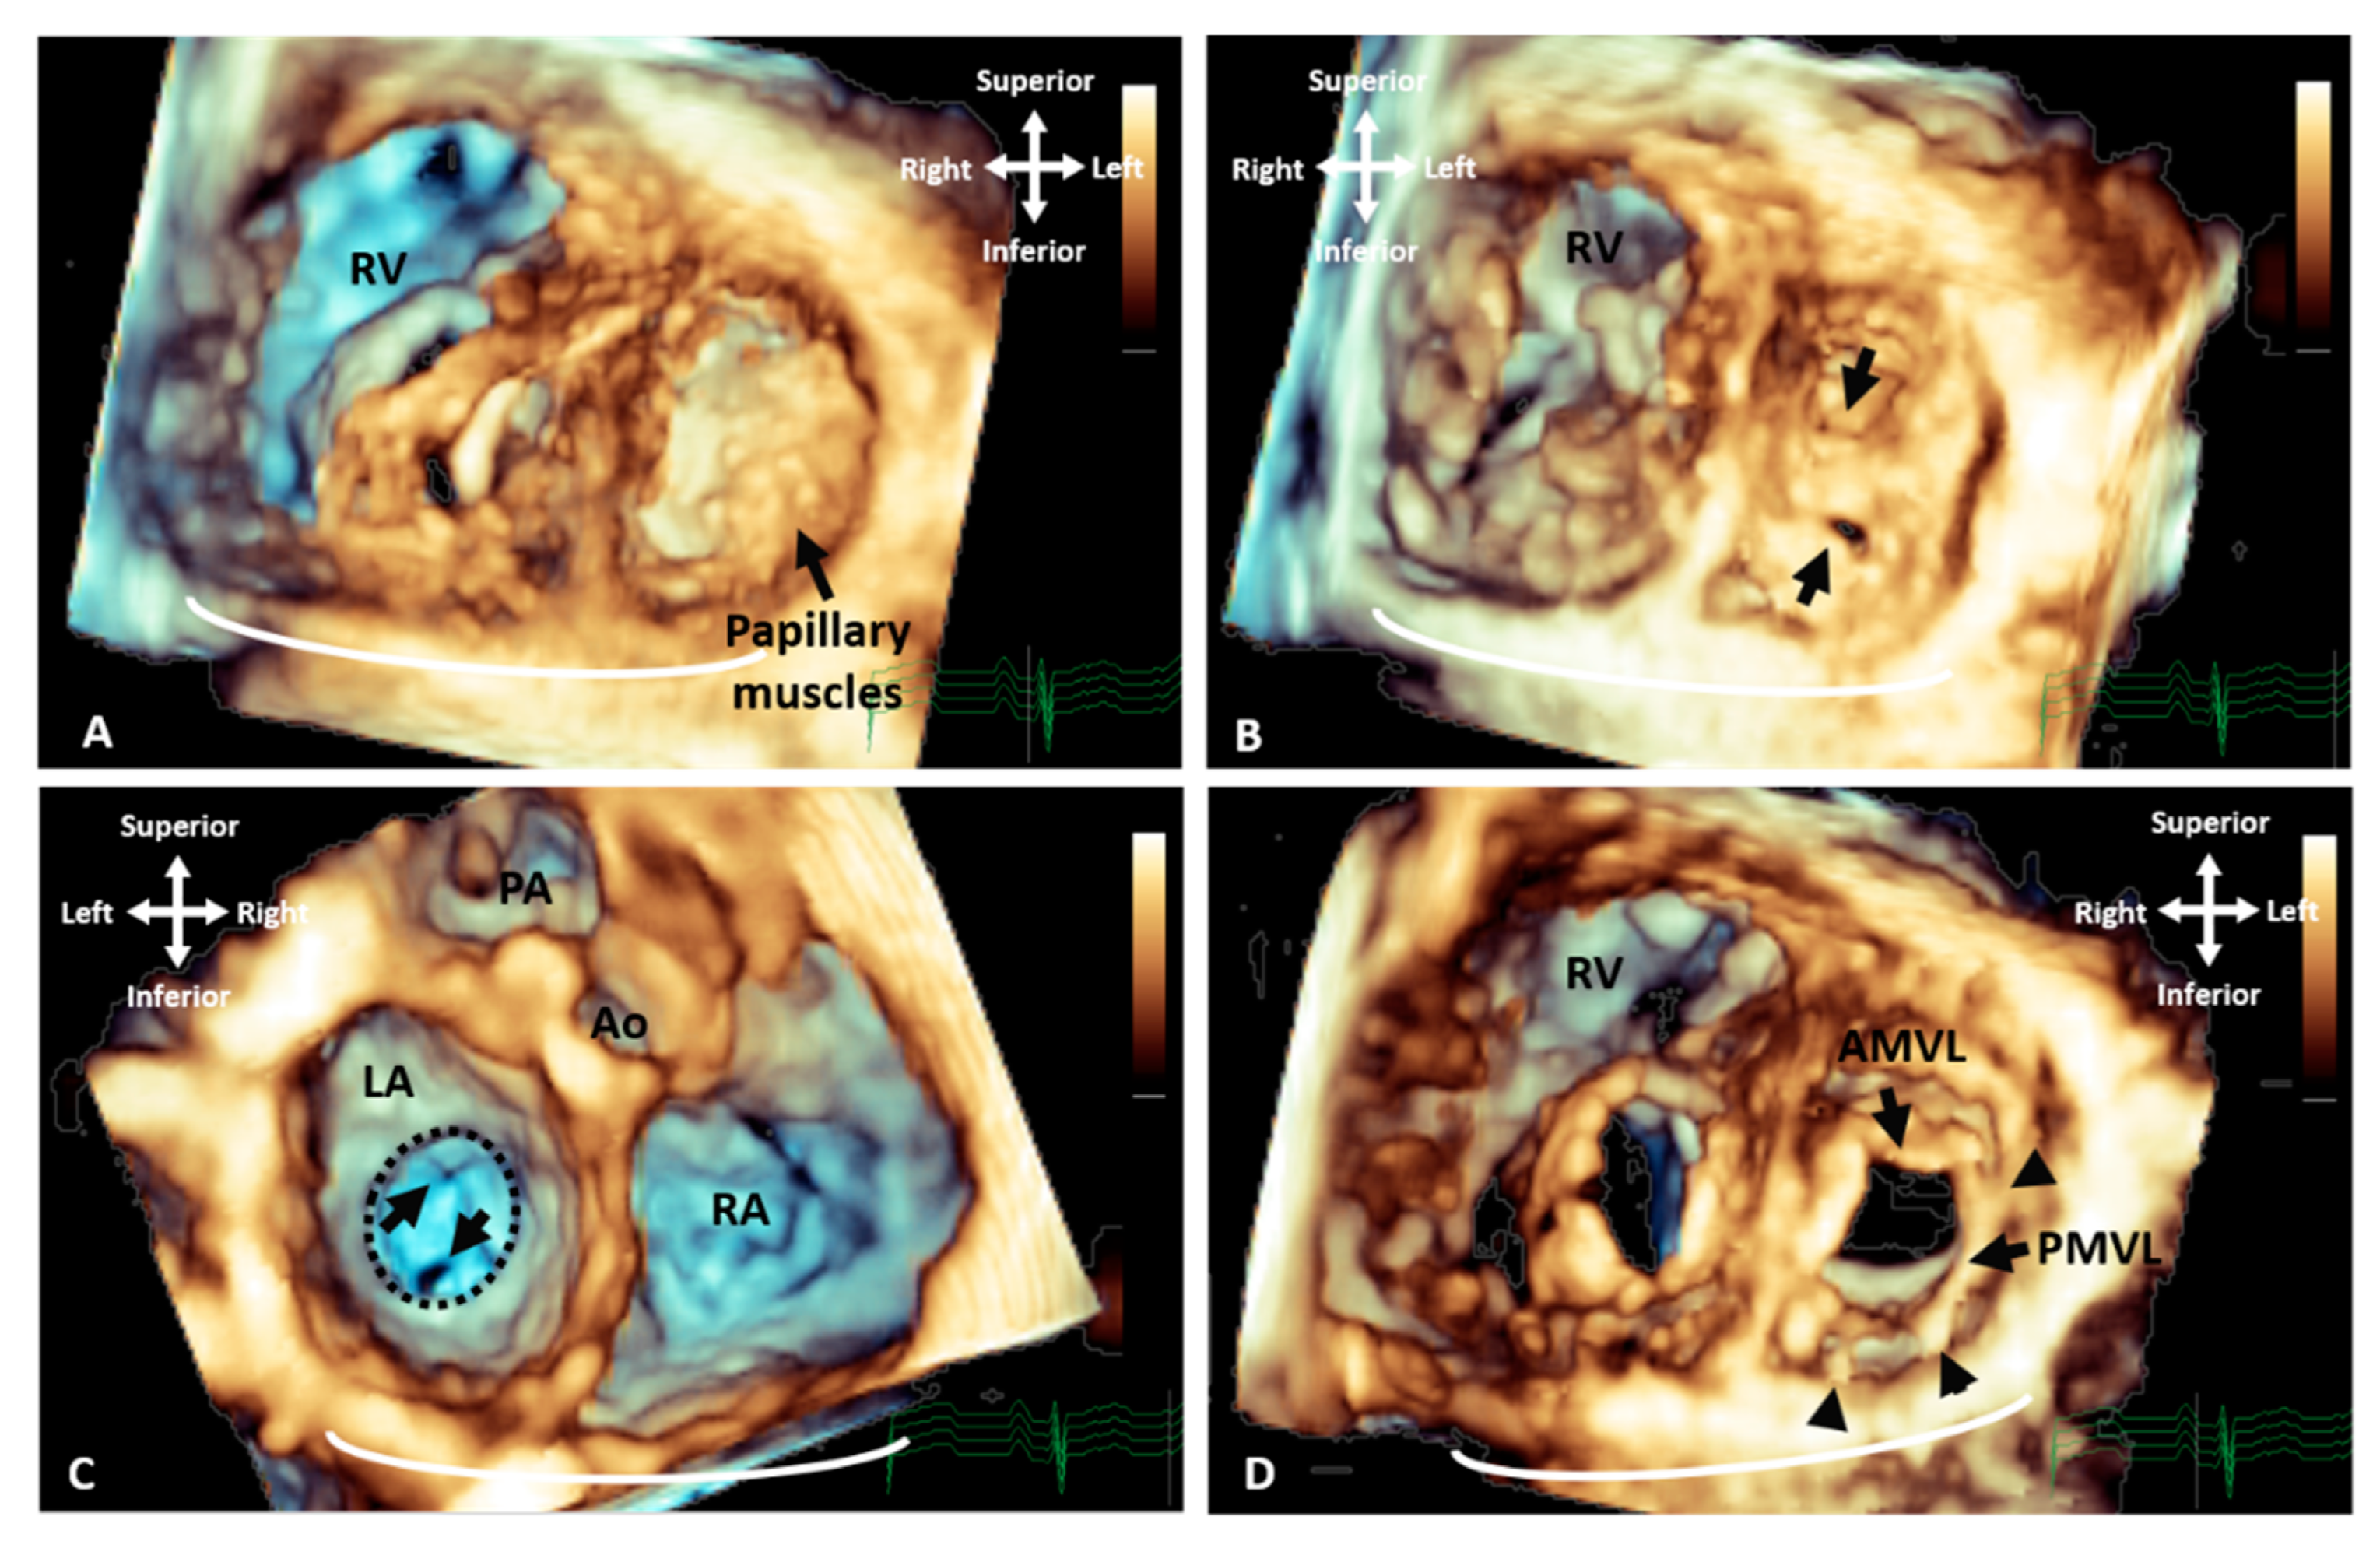
Figure 2. Three-dimensional TTE demonstrating the appearance of parachute mitral valve with complex subvalvar stenosis. (A) Demonstrates the thickened and fused subvalvar apparatus with indistinguishable papillary muscles and chords as seen from a distal ventricular view. A view through the middle of subvalvar tissue reveals two small orifices as seen from the (B) ventricular and (C) atrial aspects, the atrial view also shows the small annulus that is highlighted with the dashed line. (D) A view at the level of the mitral valve leaflets shows that although the posterior leaflet is tethered with multiple short chords (arrowheads), the anterior leaflet retains adequate excursion, with area of narrowing and stenosis being within the subvalvar tissue. Ao: Aorta; AMVL: Anterior mitral valve leaflet; LA: Left atrium; PA: Pulmonary valve; PMVL: Posterior mitral valve leaflet and RA: Right atrium.
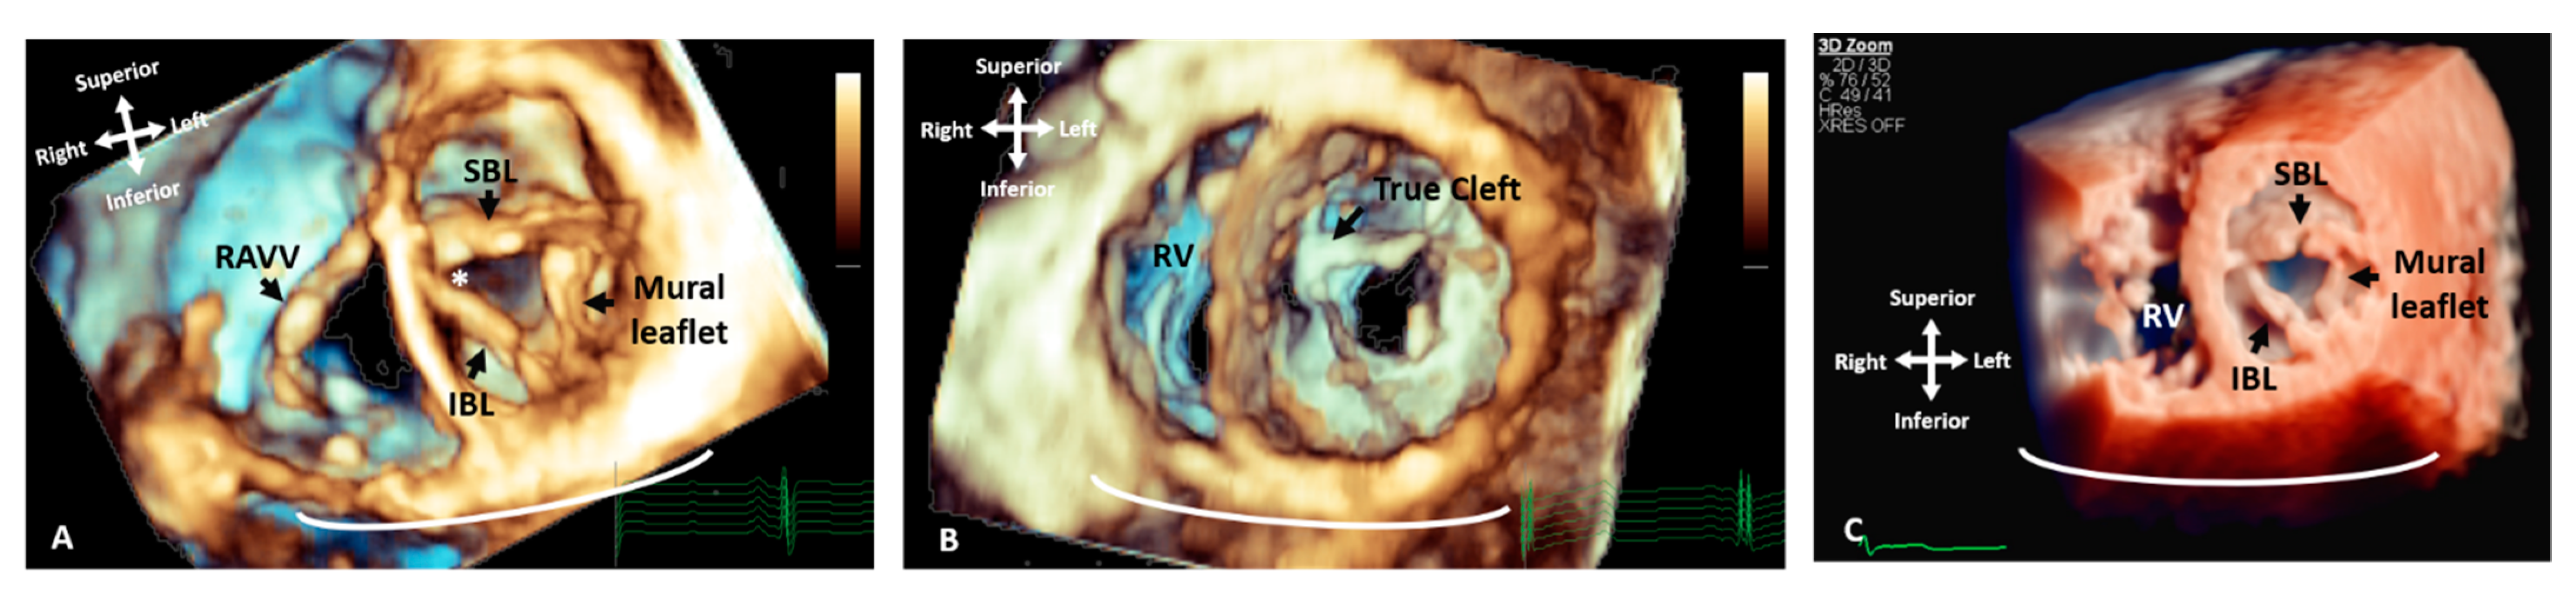
Figure 3. Three-dimensional TTE comparing the appearance of a LAVV and a true mitral valve cleft. (A) A LAVV demonstrating the zone of apposition (asterisk) compared to (B) a true cleft of the AMVL, both demonstrated with rendered 3D imaging and (C) illustrates the greater degree of resolution that can be appreciated in the structures with True Vue imaging modality. The images are depicted in anatomical orientation from the ventricular aspect. AMVL: Anterior mitral valve leaflet; IBL: Inferior bridging leaflet; RV: Right ventricle; RAVV: Right atrioventricular valve and SBL: Superior bridging leaflet.

Figure 4. Three-dimensional TTE and CT demonstrating the intracardiac anatomy in a case of DORV. (A)View from ventricular apex, demonstrating the position of the ventricular septum (small arrowheads) in relation with the great arteries, both committed to RV. (B) Similar view to A, cropped closer to the base of the heart, depicting the interventricular communication. Baffling the aorta to the LV can be established without impinging on the tricuspid valve or obstructing the pulmonary artery. (C) Right ventricular view of interventricular communication, looking at the IVS “en face”. The rims of the defect can be appreciated in relationship to the pulmonary outflow, TV and chords. (D) View of the anterior surface of the heart, demonstrating that both great arteries are committed to RV. (E) Similar view to B (from ventricular apex), demonstrating the relationship of the great arteries and the interventricular communication. (F) Similar view to C (“en face” view of IVS from RV side), illustrating how the aorta can be baffled to LV. Ao: Aorta; IVC: Inferior vena cava; LV: Left ventricle; MPA: Main pulmonary artery; MV: Mitral valve; PA: Pulmonary artery; RA: Right atrium; RV: Right ventricle; TV: Tricuspid valve; VSD: Ventricular septal defect.
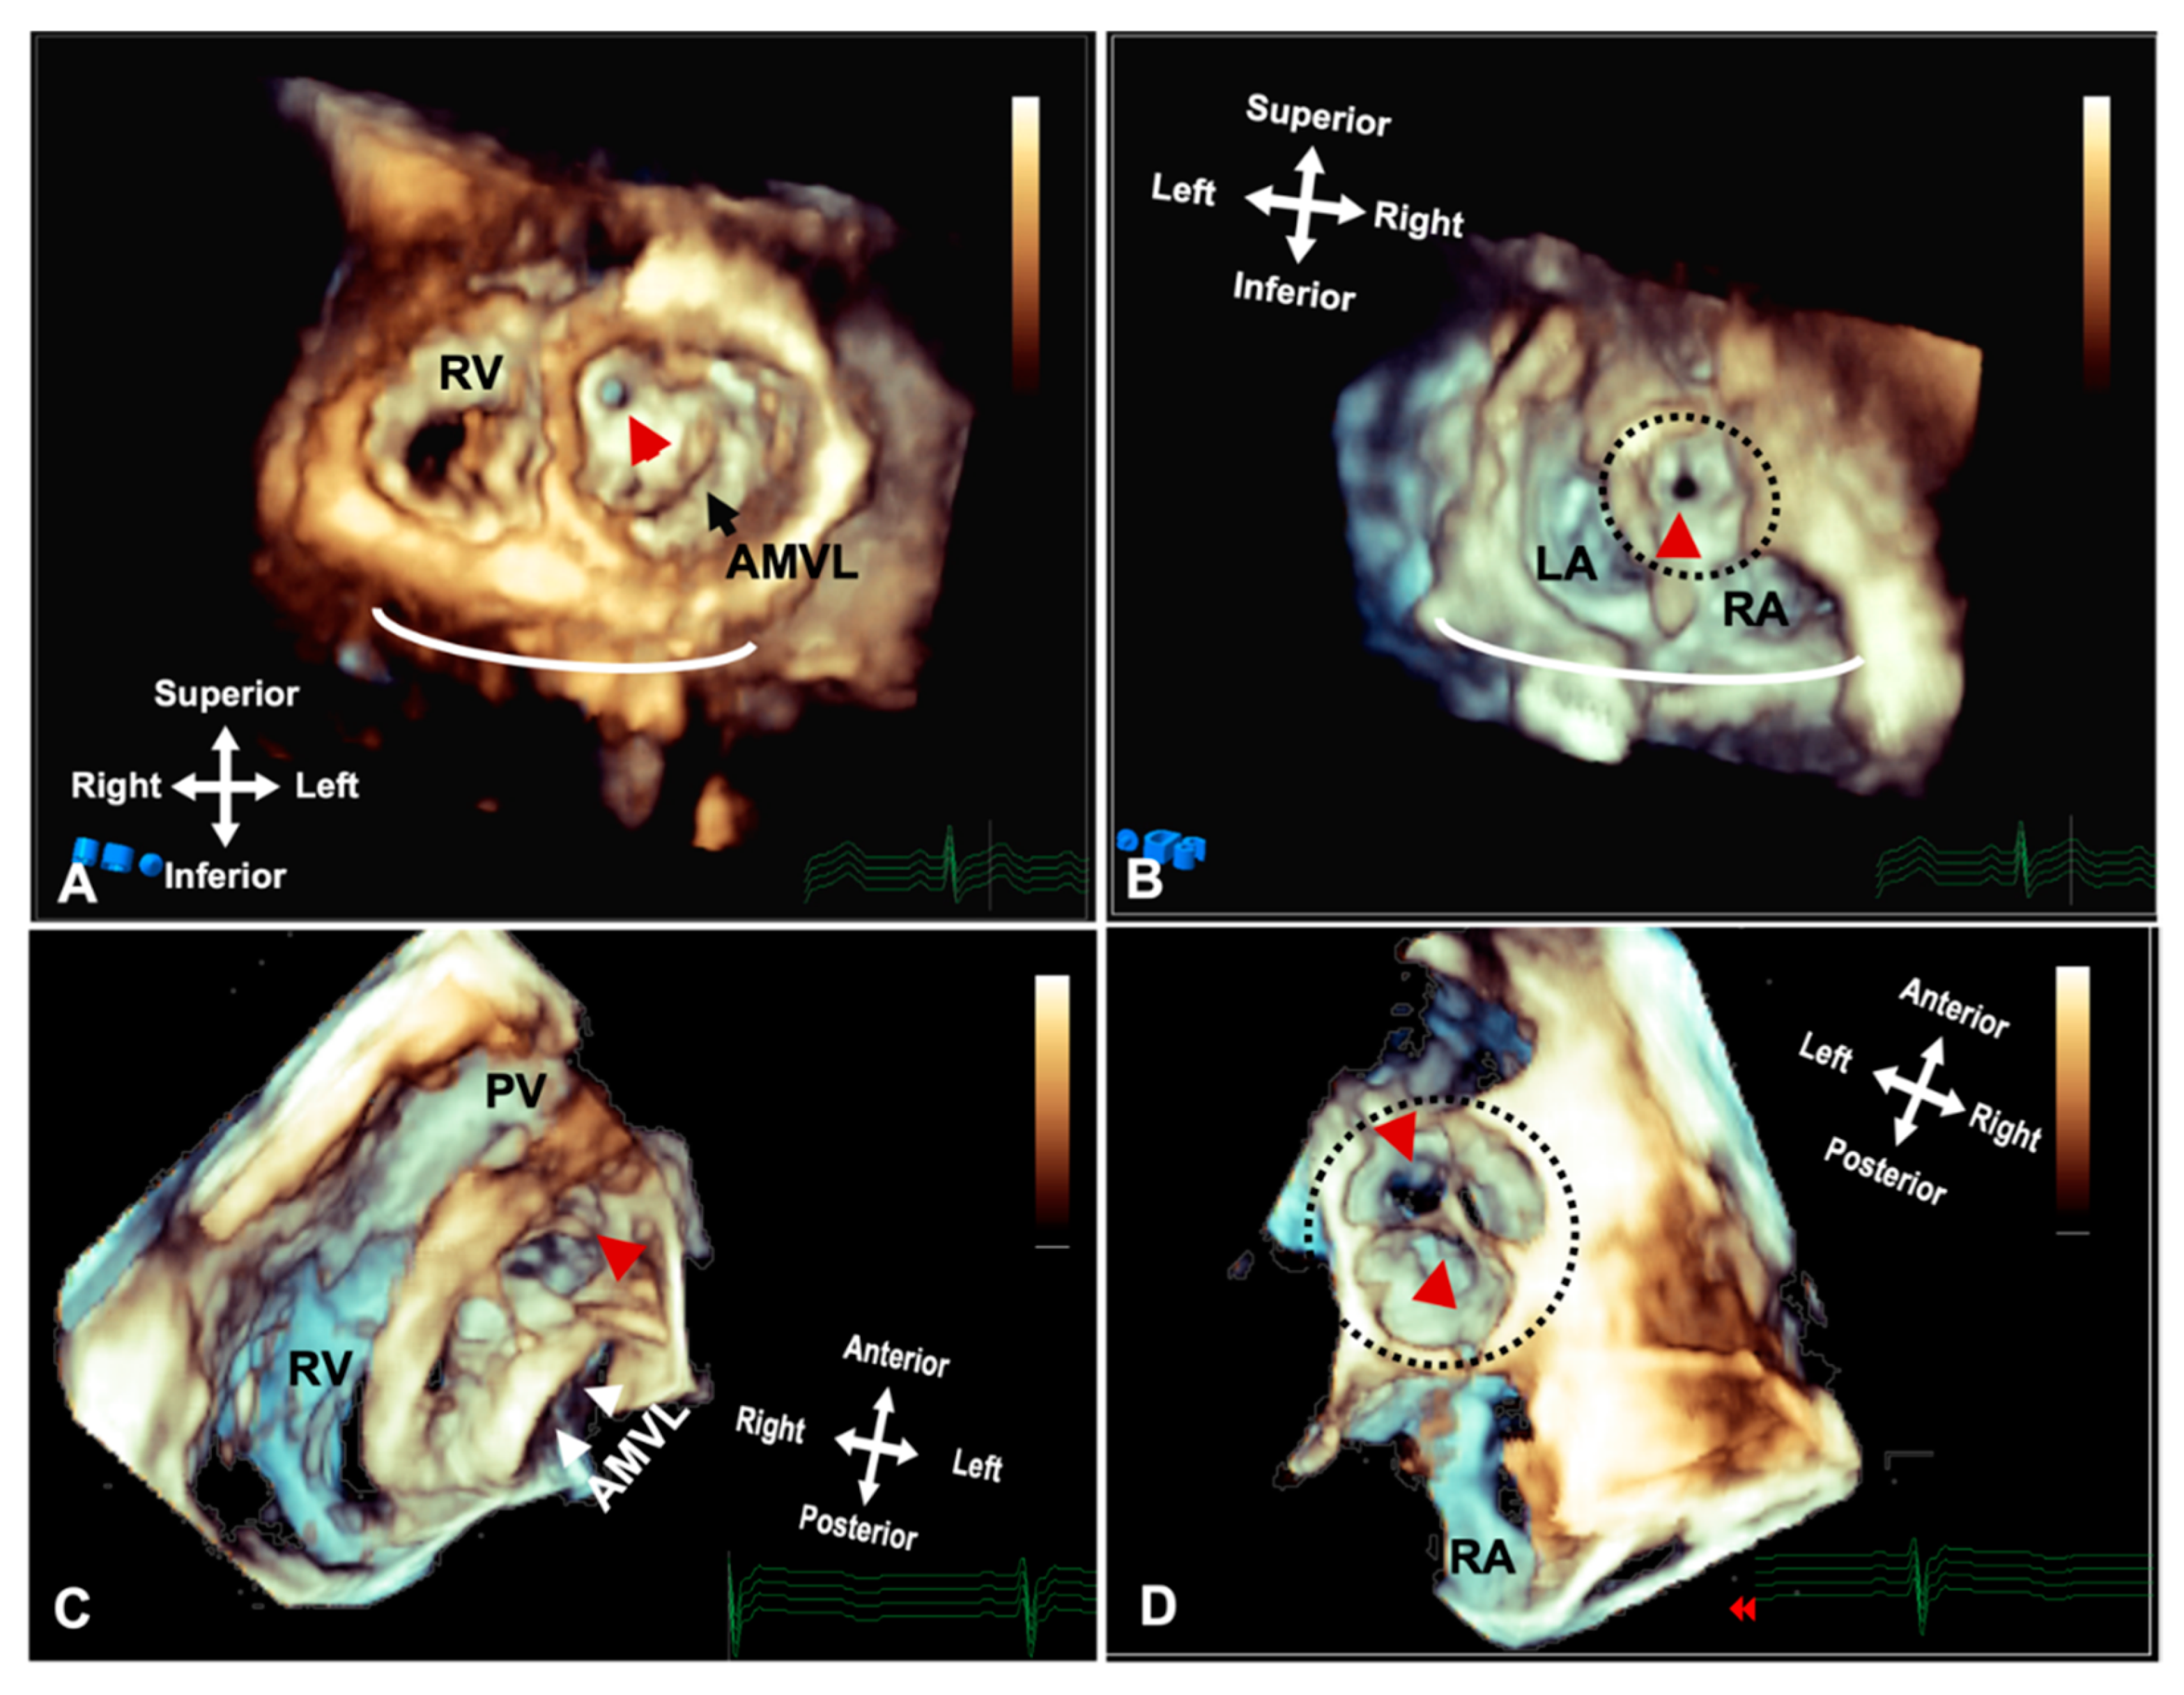
Figure 5. Three-dimensional rendered imaging from TTE/TOE demonstrating the appearance of significant subaortic stenosis. (A) TTE demonstrates a thickened circumferential ridge within the LVOT causing significant stenosis and leaving a small orifice (arrowhead) shown from the ventricular aspects and (B) the atria, with the aorta highlighted by a dashed line. (C) Shows a subaortic membrane as seen from the ventricular aspect and (D) from the atria with the circumferential membrane seen through the leaflets of the aortic valve highlighted by the dashed line. AMVL: Anterior mitral valve leaflet; LA: Left atrium; RA: Right atrium and RV: Right ventricle.
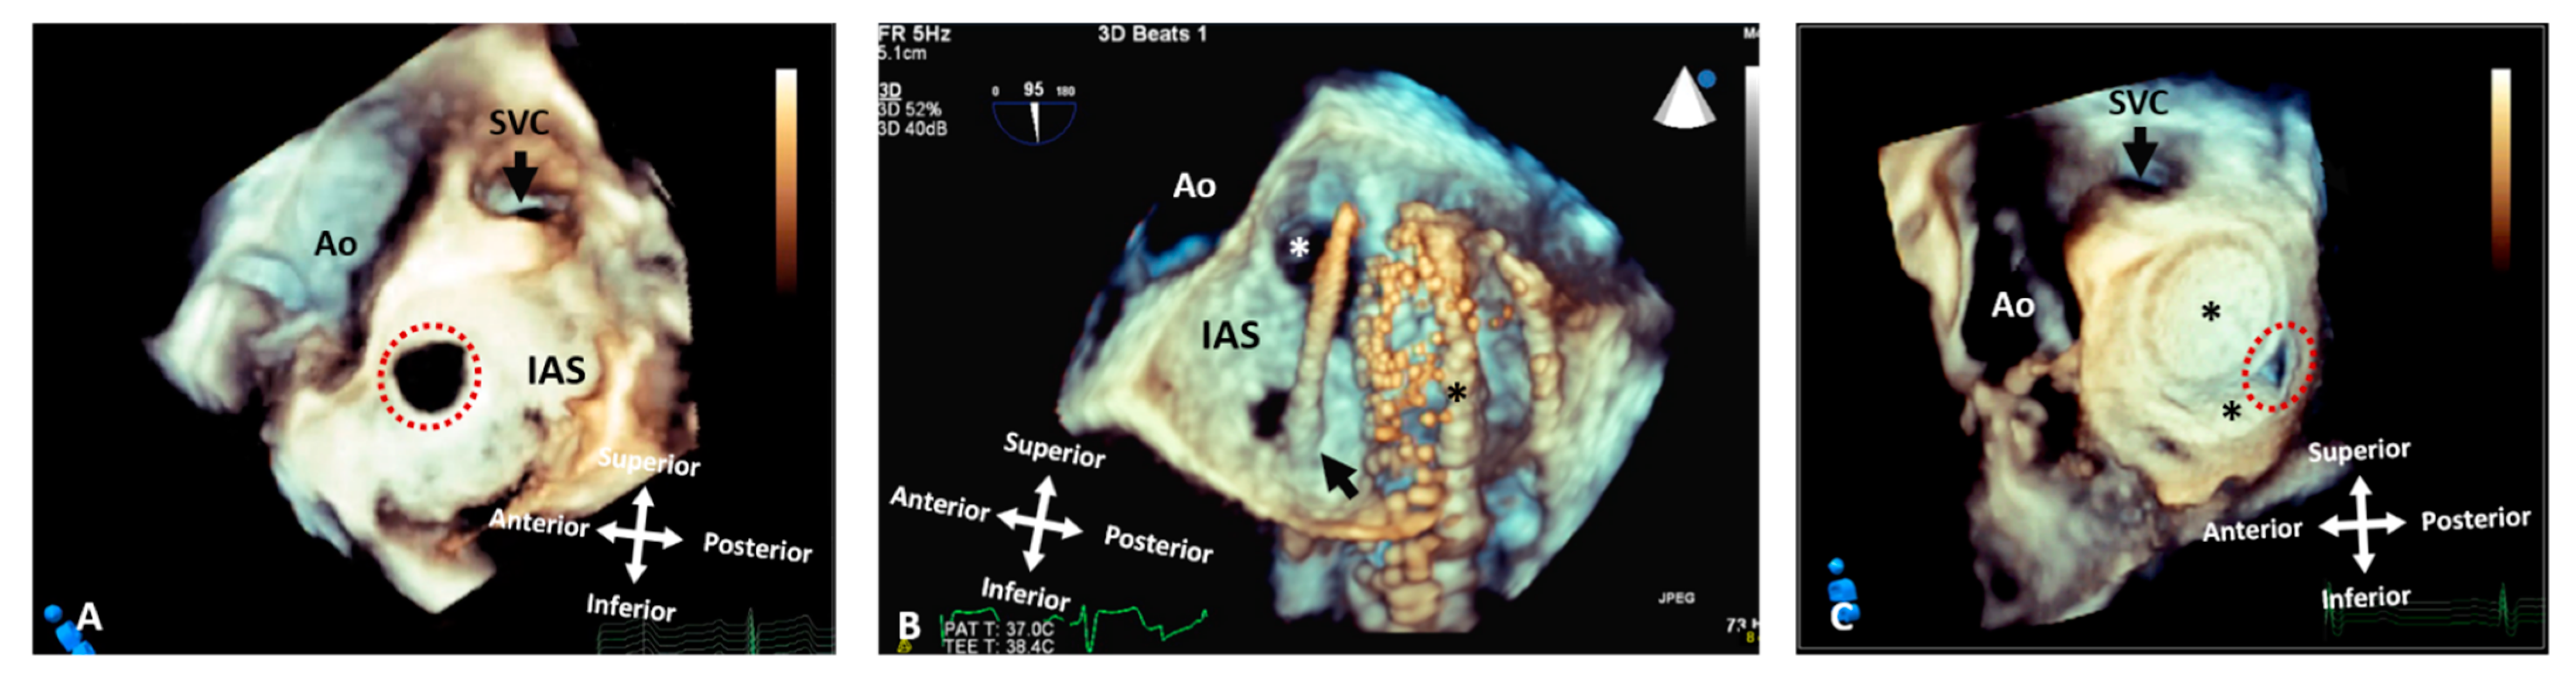
Figure 6. Three-dimensional rendered images from TOE demonstrating the appearance of defects within the atrial septum. All images are shown in anatomic orientation from the left atrial view. (A) Demonstrates a secundum ASD as outlined by the dashed line, which appears ideal for closure with a percutaneous device. (B) This image illustrates careful intra-procedure imaging depicting a septum with multiple defects. Live 3D can be very informative in allowing visualization of catheters (arrow), multiple defects (white asterisk) and balloons used to interrogate the defect size and septal tissue (black asterisk). (C) Two ASD occlusion devices (asterisk) used to close multiple defects, with a small residual defect noted posteriorly (dashed line). Ao: Aorta; IAS: Interatrial septum; LA: Left atrium; RA: Right atrium; RLPV: Right lower pulmonary vein; RUPV: Right upper pulmonary vein and SVC: Superior vena cava.
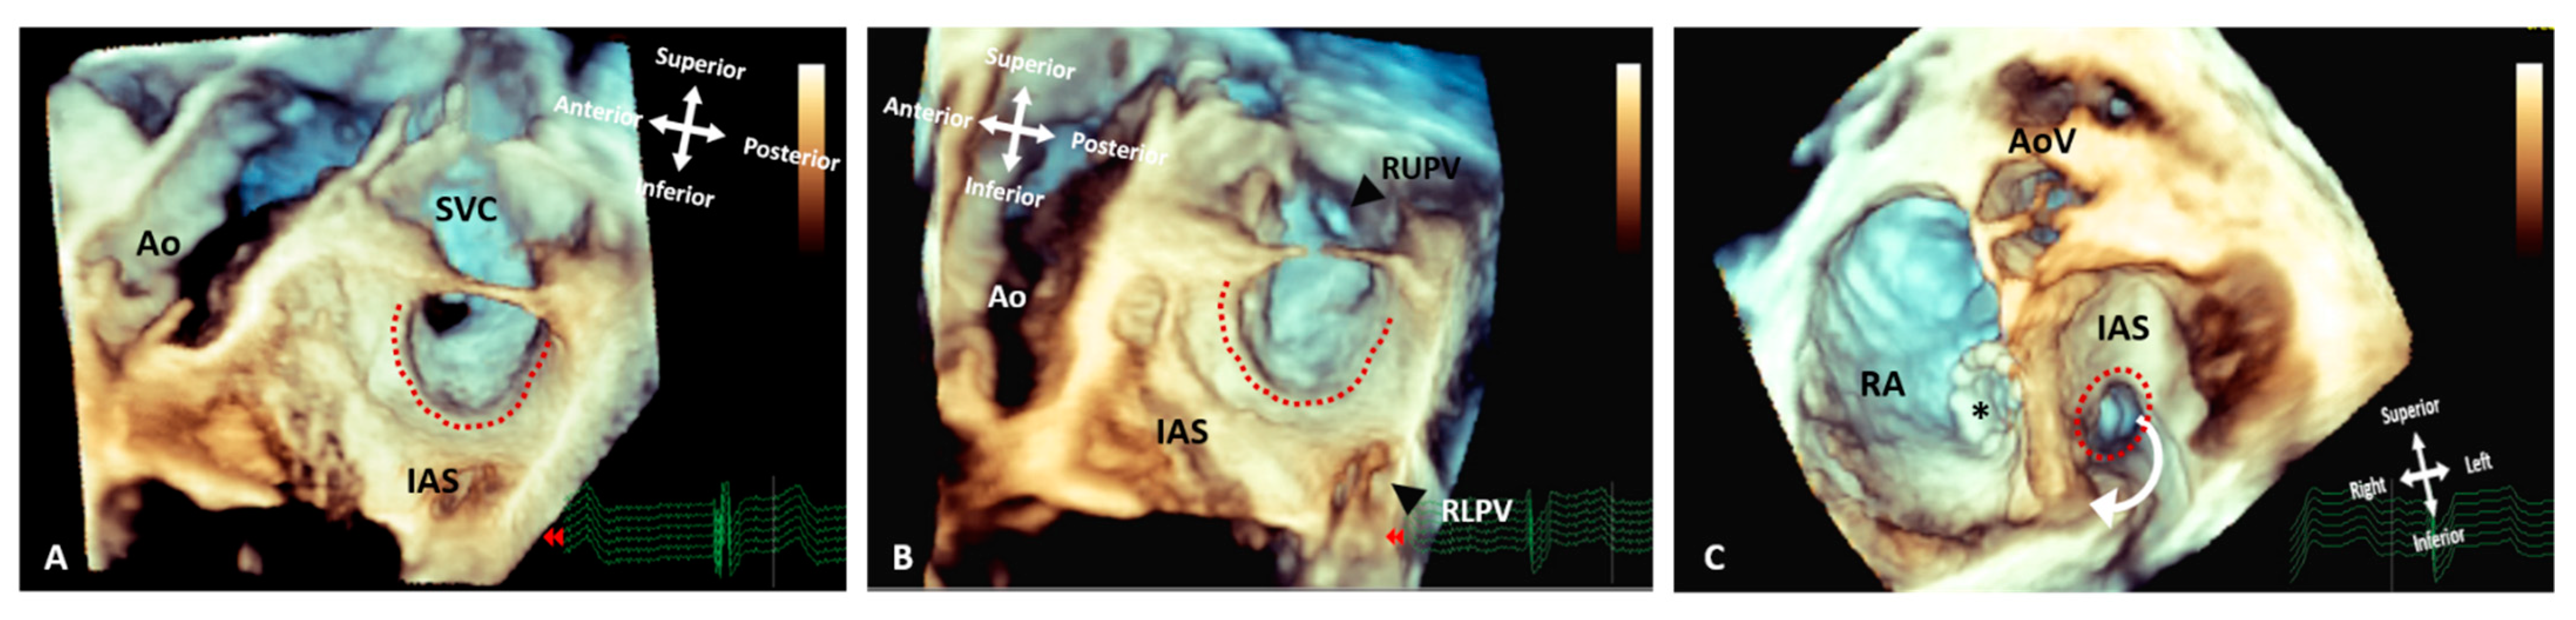
Figure 7. Three-dimensional rendered images from TOE demonstrating the appearance of Superior Sinus Venosus ASDs before and after stenting. (A) Demonstrates a superior sinus venosus ASD as outlined by the dashed line–seen from the left atrial aspect. (B) Illustrates that careful imaging and angulation allows visualization of the right pulmonary veins (arrowheads), the anomalous RUPV and the RLPV draining into the LA. (C) An image seen from the ventricle with the AV valves removed allowing visualization of the roof of the atria. A covered stent in situ within the SVC extending into the RA (asterisk) and the unoccluded defect (dashed line) allowing the anomalous vein to drain around the stent back into the LA. All images are shown in anatomic orientation. Ao: Aorta; AoV: Aortic valve; AS; Interatrial septum; LA: Left atrium; RA: Right atrium; RLPV: Right lower pulmonary vein; RUPV: Right upper pulmonary vein and SVC: Superior vena cava.
3. CT
CT provides extremely high-resolution cardiovascular imaging, including 3D rendered views, with the most recent generation of ultrafast scanners reducing both scan time and radiation dose. This facilitates high-resolution imaging in the context of un-cooperative or unstable patients, for example in an intensive care setting. However, CT still uses ionising radiation and paediatric patients are likely to need repeat imaging and their rapidly dividing cells make them more susceptible to radiation damage [18]. It is also known that CT alongside angiography are the main sources of radiation exposure during follow up of adult patients with congenital heart disease [19]. Due to the lifelong sequalae involved, CT scanners have incorporated radiation dose reduction technology and dose optimisation protocols to minimise associated risks [20]. CT acquisition parameters are adjusted to minimise exposure, and post-processing filters are applied to reduce noise and maintain image quality [21][22]. Dual-energy CT (DECT) is a new technology that is able to reduce the radiation exposure dose even further [23]. CT offers the option of both surface and volume rendering, with surface rendering using only part of the available data for 3D reconstruction (Figure 8). After the determination of surface representation, this can be a fast technique with good depth perception, but it relies on well-differentiated surfaces and thresholds [20]. The introduction of dynamic CT has allowed for the uninterrupted acquisition of cardiac structures, resulting in even shorter scanning times.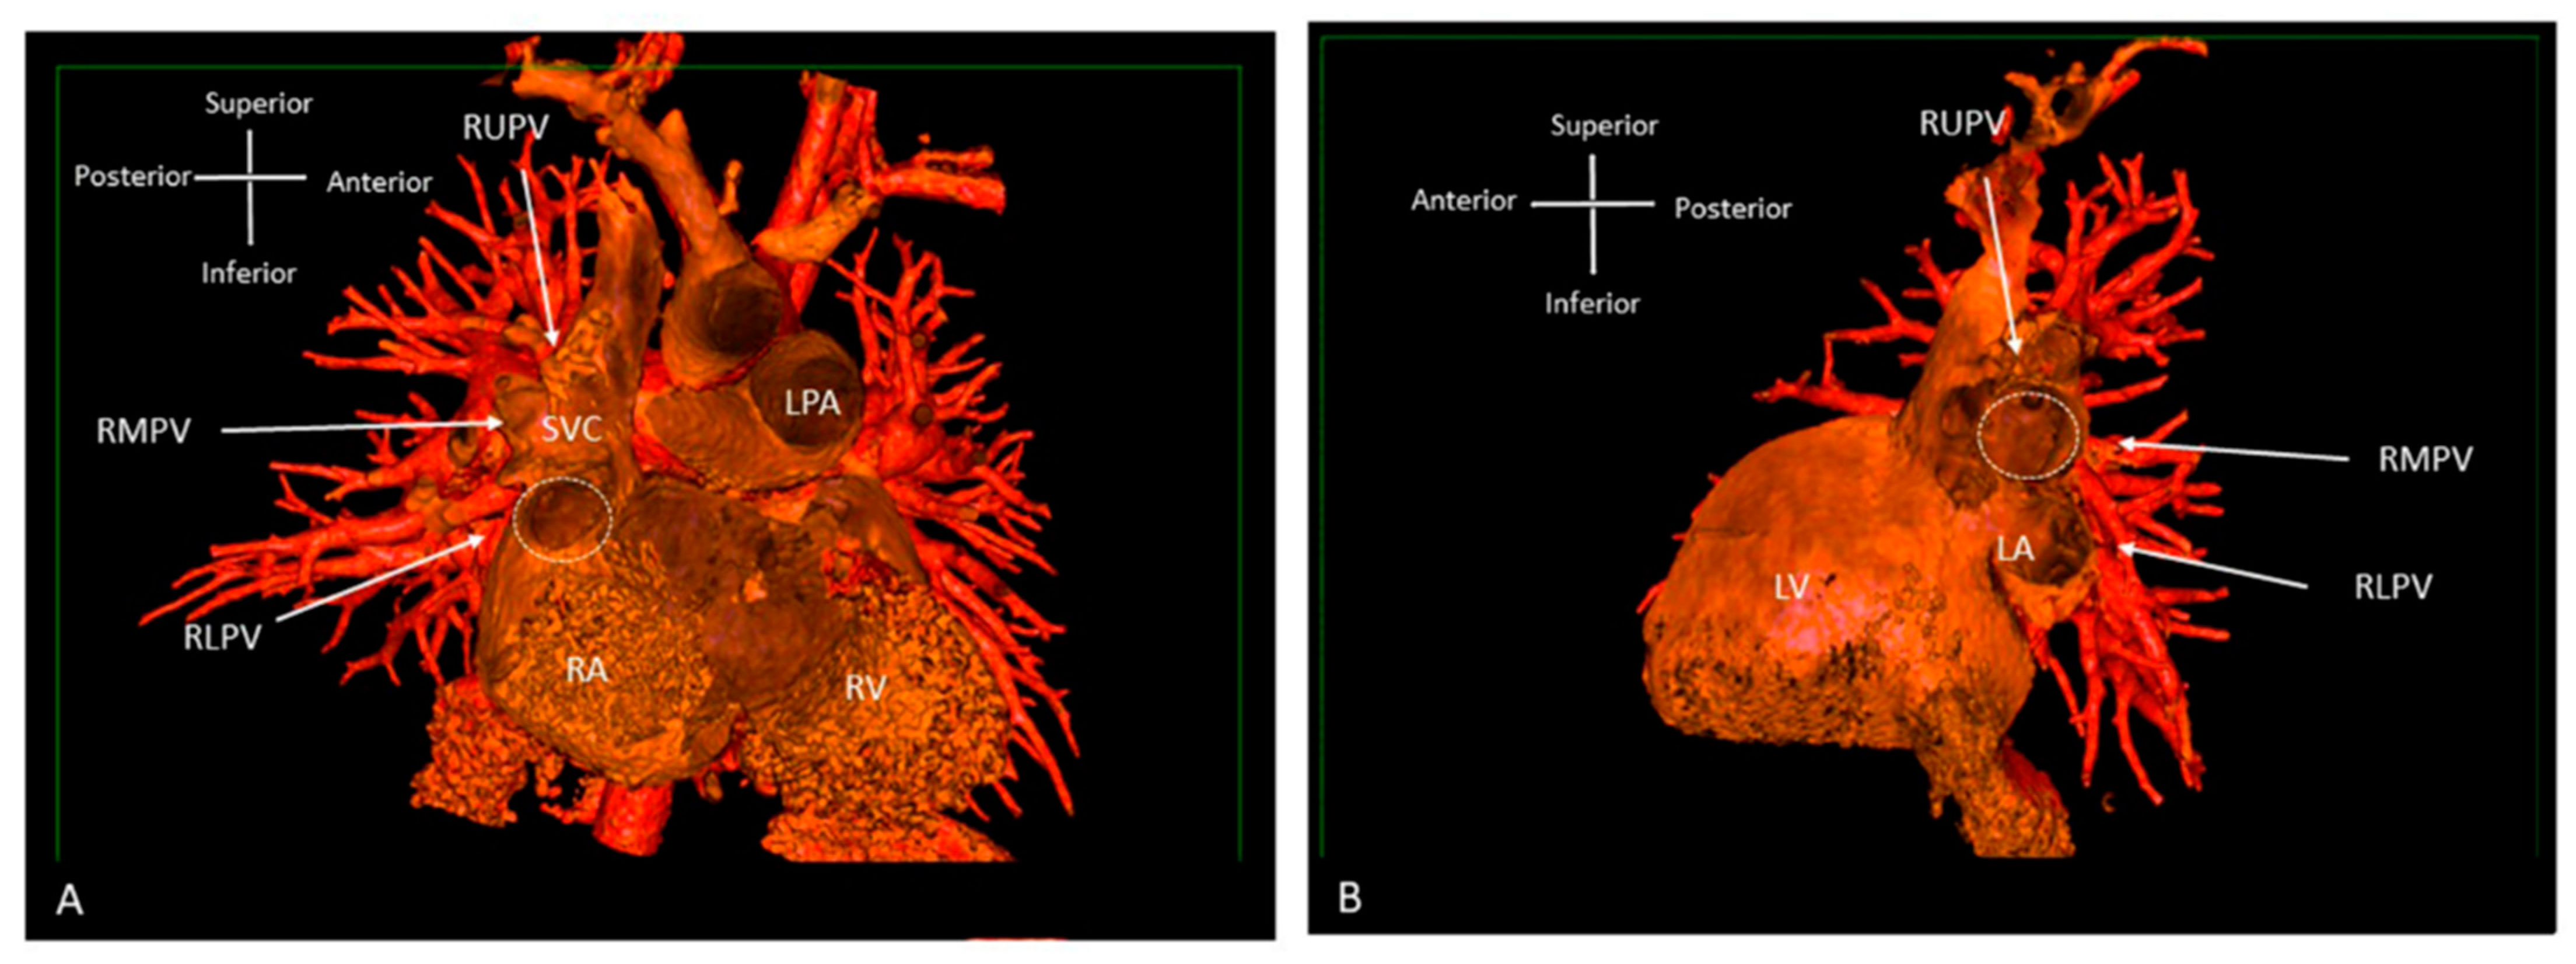
Figure 8. Three-dimensional rendered images from CT, demonstrating the appearance of Superior Sinus Venosus ASD. (A) Demonstrates a superior sinus venosus ASD as outlined by the dashed line—seen from the right atrial aspect. RUPV and RMPV drain anomalously to the SVC. RLPV can be seen draining to LA. (B) Depicts a superior sinus venosus ASD from the left atrial aspect, allows imaging of the anomalous drainage of the RUPV and RMPV to the SVC. RLPV illustrated draining into the LA. LA: Left atrium; LPA: Left pulmonary artery; LV: Left ventricle; RA: Right atrium; RV: Right ventricle; SVC: Superior vena cava; RLPV: Right lower pulmonary vein; RMPV: Right middle pulmonary vein; RUPV: Right upper pulmonary vein.
4. MRI
3D MRI acquired data can produce whole heart imaging and visualise the extracardiac vasculature and relationships to adjacent structures while remaining free of radiation. Contrast-enhanced angiography and non-contrast enhanced 3D whole heart imaging can be used as required to interrogate cardiac anatomy on a multiplanar reformat platform [20]. A new offline 3D planning method has been compared to conventional 2D MRI imaging [25]. The anatomical coverage was of equal imaging quality, using both methods. However, the 3D offline tool was more time efficient, which is particularly relevant in patients under general anaesthesia or sedation. The recent development of 4D flow MRI includes a phase contrast MRI study with flow encoding in all three spatial directions relative to all three dimensions of space and to the dimension of time throughout the cardiac cycle [26] (Figure 9). This allows for volume flow quantification with the added advantage of enabling the retrospective calculation of blood flow through any plane of interest within the 3D volume acquired.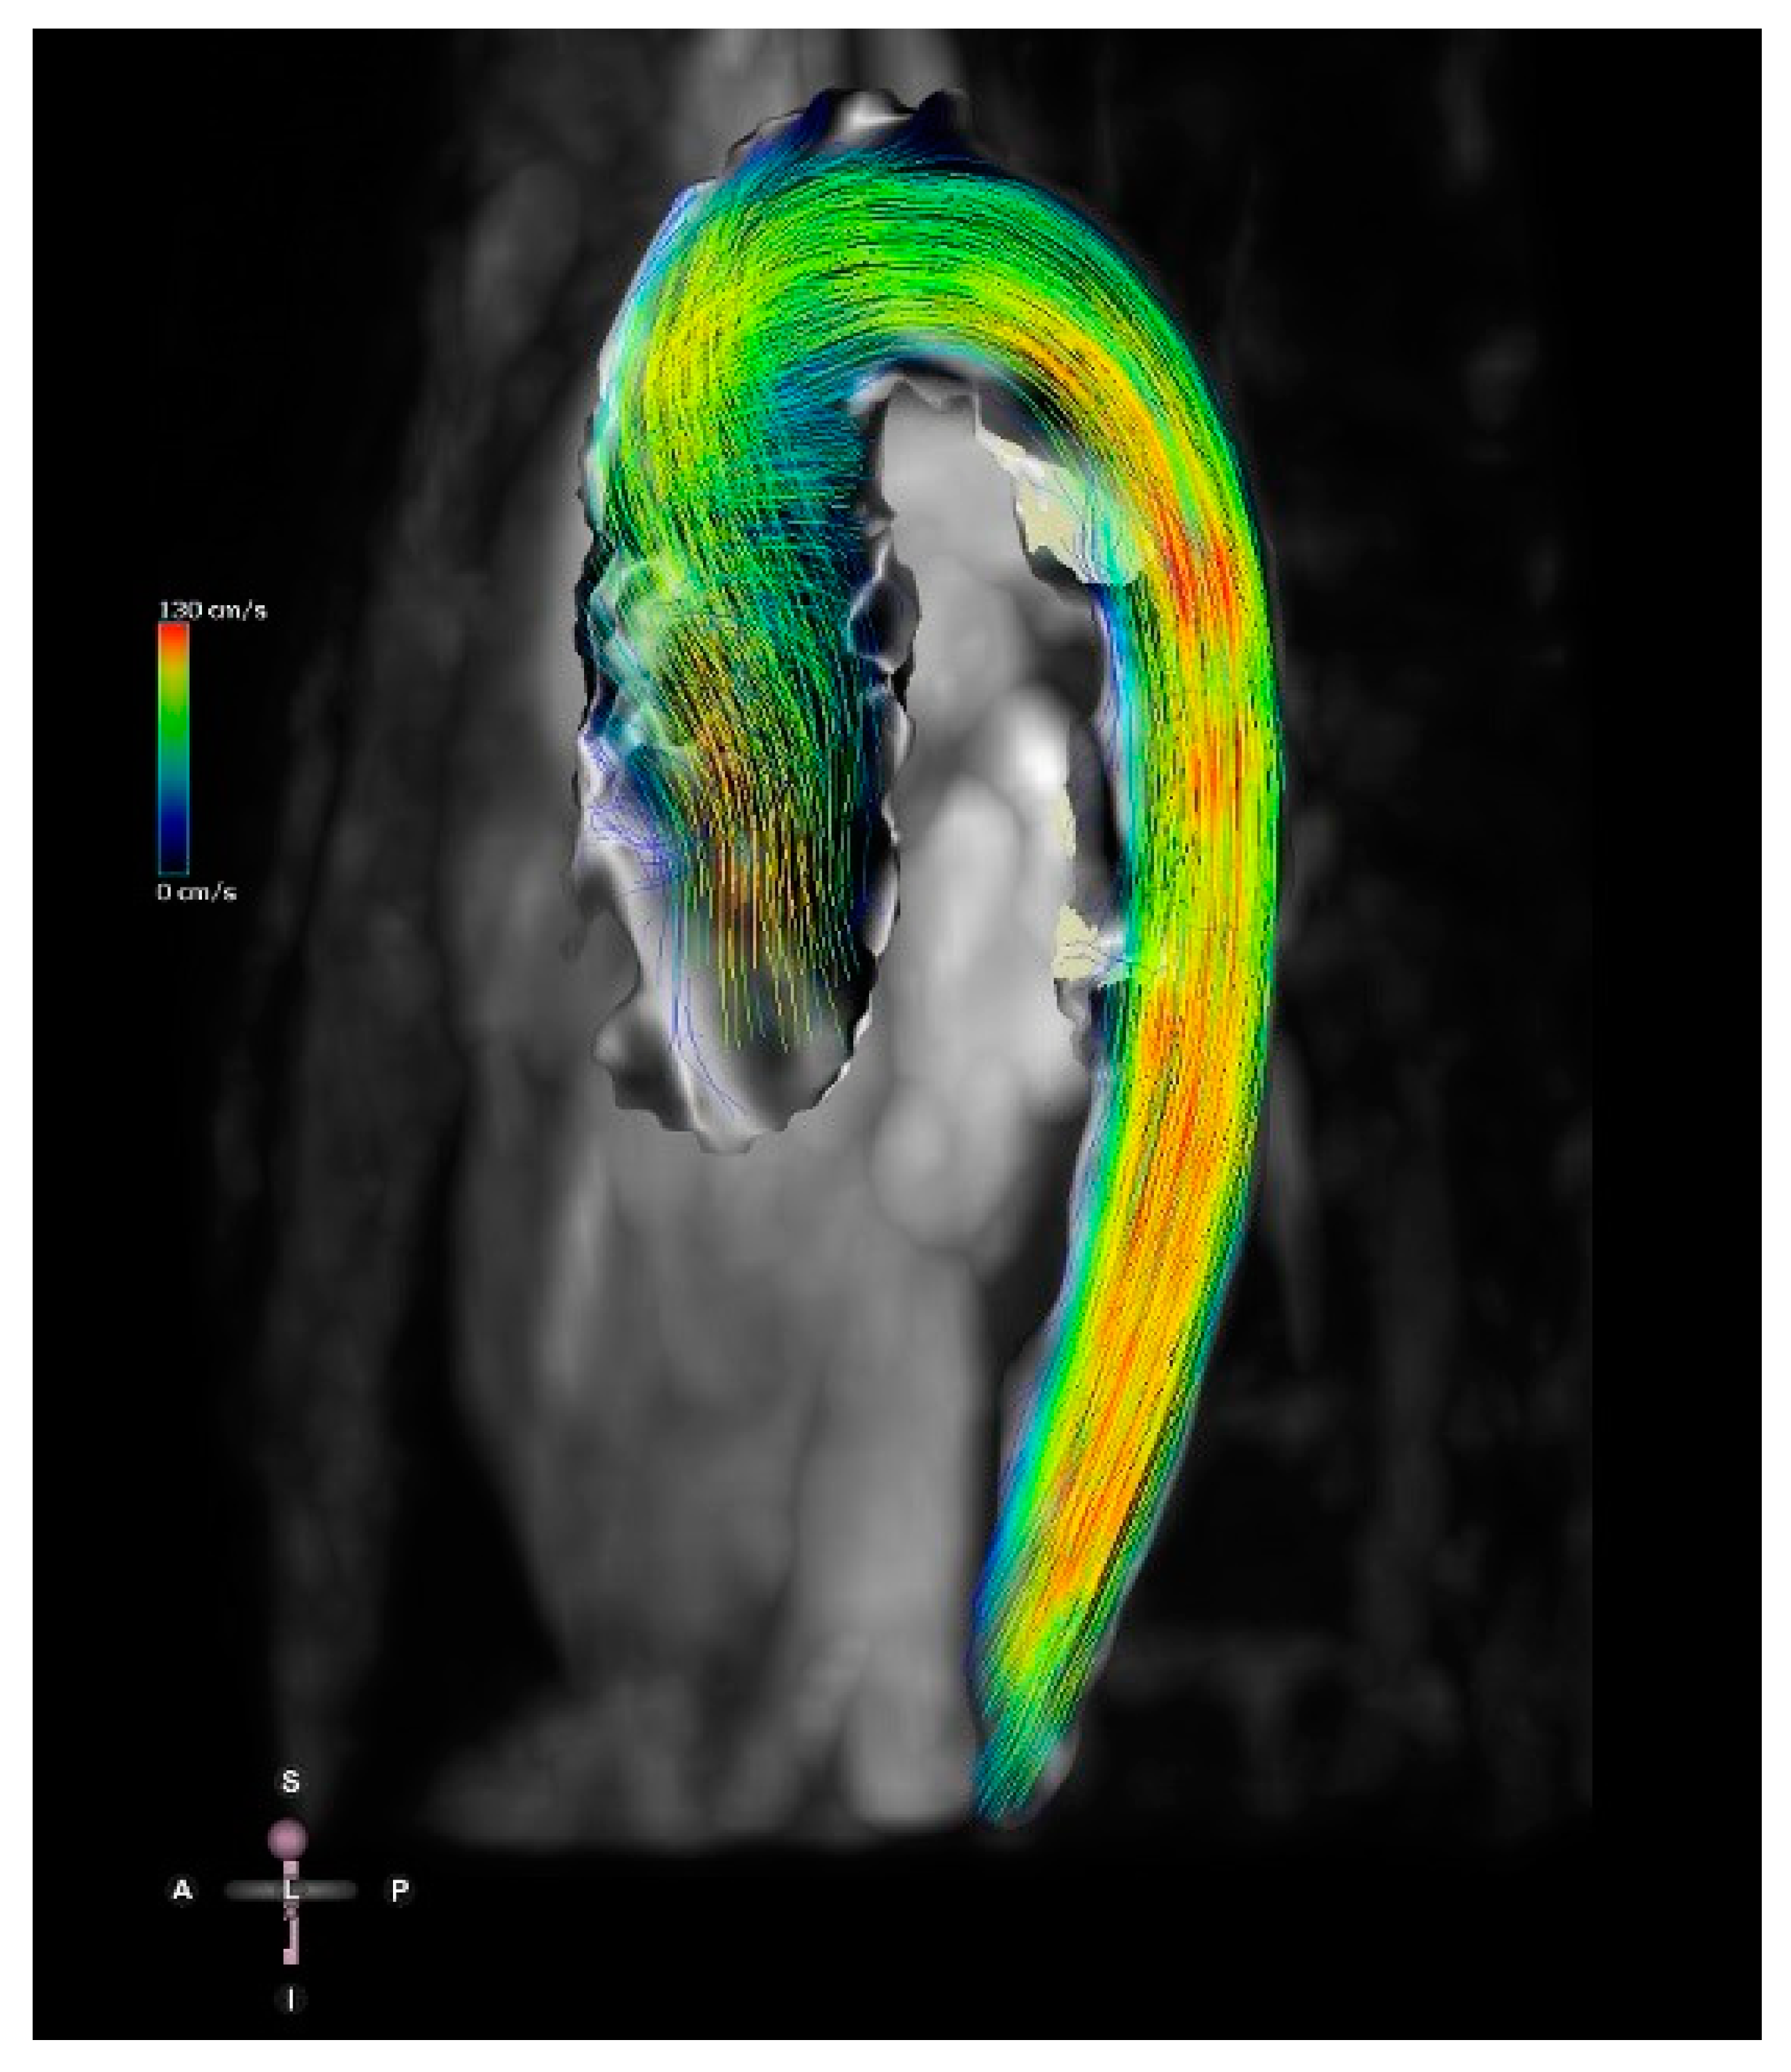
Figure 9. Four-dimensional flow image of a patient with a bicuspid aortic valve and dilation of the ascending aorta. Streamlines show the 4D flow dataset in mid-systole. Streamlines represent the direction of the flow and are colour-coded for velocity.
References
- Fratz, S.; Chung, T.; Greil, G.F.; Samyn, M.M.; Taylor, A.M.; Buechel, E.R.V.; Yoo, S.-J.; Powell, A.J. Guidelines and protocols for cardiovascular magnetic resonance in children and adults with congenital heart disease: SCMR expert consensus group on congenital heart disease. J. Cardiovasc. Magn. Reson. 2013, 15, 51.
- Dillman, J.R.; Hernandez, R.J. Role of CT in the Evaluation of Congenital Cardiovascular Disease in Children. Am. J. Roentgenol. 2009, 192, 1219–1231.
- Sachdeva, R.; Valente, A.M.; Armstrong, A.K.; Cook, S.C.; Han, B.K.; Lopez, L.; Lui, G.K.; Pickard, S.S.; Powell, A.J.; Bhave, N.M.; et al. ACC/AHA/ASE/HRS/ISACHD/SCAI/SCCT/SCMR/SOPE 2020 Appropriate Use Criteria for Multimodality Imaging During the Follow-Up Care of Patients With Congenital Heart Disease. J. Am. Coll. Cardiol. 2020, 75, 657–703.
- Simpson, J.; Lopez, L.; Acar, P.; Friedberg, M.; Khoo, N.; Ko, H.; Marek, J.; Marx, G.; McGhie, J.; Meijboom, F.; et al. Three-dimensional echocardiography in congenital heart disease: An expert consensus document from the European Association of Cardiovascular Imaging and the American Society of Echocardiography. Eur. Heart J. Cardiovasc. Imaging 2016, 17, 1071–1097.
- de Castro, S.; Caselli, S.; Papetti, F.; Ventriglia, F.; Giardina, A.; Cavarretta, E.; Angelantonio, E.D.; Marcantonio, A.; Perez, F.D.I.; Pandian, N.G.; et al. Feasibility and Clinical Impact of Live Three-Dimensional Echocardiography in the Management of Congenital Heart Disease; Blackwell Publishing, Inc.: Hoboken, NJ, USA, 2006.
- Jone, P. Applications of three-dimensional transesophageal echocardiography in congenital heart disease. Echocardiography 2020, 37, 1665–1672.
- Arbic, N.; Dragulescu, A.; Mertens, L.; Villemain, O. The Use of 3D Echocardiography in Surgical Planning of the Mitral Valve in Pediatric Cardiology. J. Vis. Exp. 2021, 3, e62574.
- Shiota, T. Clinical Application of 3-Dimensional Echocardiography in the USA. Circ. J. 2015, 79, 2287–2298.
- Charakida, M.; Pushparajah, K.; Simpson, J. 3D echocardiography in congenital heart disease: A valuable tool for the surgeon. Futur. Cardiol. 2014, 10, 497–509.
- Valverde, I.; Rawlins, D.; Austin, C.; Simpson, J.M. Three-dimensional echocardiography in the management of parachute mitral valve. Eur. Heart J. Cardiovasc. Imaging 2011, 13, 446.
- Colen, T.; Smallhorn, J.F. Three-Dimensional Echocardiography for the Assessment of Atrioventricular Valves in Congenital Heart Disease: Past, Present and Future. Semin. Thorac. Cardiovasc. Surgery: Pediatr. Card. Surg. Annu. 2015, 18, 62–71.
- Pushparajah, K.; Barlow, A.; Tran, V.-H.; Miller, O.I.; Zidere, V.; Vaidyanathan, B.; Simpson, J.M. A Systematic Three-Dimensional Echocardiographic Approach to Assist Surgical Planning in Double Outlet Right Ventricle. Echocardiography 2012, 30, 234–238.
- Savis, A.; Simpson, J. Echocardiographic approach to catheter closure of atrial septal defects: Patient selection, procedural guidance and post-procedural checks. Echo Res. Pract. 2018, 5, R49–R64.
- Jone, P.-N.; Zablah, J.; Burkett, D.A.; Schäfer, M.; Wilson, N.; Morgan, G.J.; Ross, M. Three-Dimensional Echocardiographic Guidance of Right Heart Catheterization Decreases Radiation Exposure in Atrial Septal Defect Closures. J. Am. Soc. Echocardiogr. 2018, 31, 1044–1049.
- Charakida, M.; Qureshi, S.; Simpson, J.M. 3D Echocardiography for Planning and Guidance of Interventional Closure of VSD. JACC Cardiovasc. Imaging 2013, 6, 120–123.
- Hansen, J.H.; Duong, P.; Jivanji, S.G.; Jones, M.; Kabir, S.; Butera, G.; Qureshi, S.A.; Rosenthal, E. Transcatheter Correction of Superior Sinus Venosus Atrial Septal Defects as an Alternative to Surgical Treatment. J. Am. Coll. Cardiol. 2020, 75, 1266–1278.
- Kabir, S.R.; Simpson, J.M.; Jones, M.I.; Butera, G.; Qureshi, S.A.; Rosenthal, E. TEE Guidance During Transcatheter Treatment of Superior SVASDs With PAPVD. JACC Cardiovasc. Imaging 2021, 15, 160–167.
- Gherardi, G.G.; Iball, G.R.; Darby, M.J.; Thomson, J.D. Cardiac computed tomography and conventional angiography in the diagnosis of congenital cardiac disease in children: Recent trends and radiation doses. Cardiol. Young 2011, 21, 616–622.
- Hoffmann, A.; Engelfriet, P.; Mulder, B. Radiation exposure during follow-up of adults with congenital heart disease. Int. J. Cardiol. 2007, 118, 151–153.
- Pushparajah, K.; Duong, P.; Mathur, S.; Babu-Narayan, S.V. Cardiovascular MRI and CT in congenital heart disease. Echo Res. Pract. 2019, 6, R121–R138.
- Precht, H.; Thygesen, J.; Gerke, O.; Egstrup, K.; Waaler, D.; Lambrechtsen, J. Influence of adaptive statistical iterative reconstruction algorithm on image quality in coronary computed tomography angiography. Acta Radiol. Open 2016, 5, 205846011668488.
- Son, S.S.; Choo, K.S.; Jeon, U.B.; Jeon, G.R.; Nam, K.J.; Kim, T.U.; Yeom, J.A.; Hwang, J.Y.; Jeong, D.W.; Lim, S.J. Image quality of CT angiography with model-based iterative reconstruction in young children with congenital heart disease: Comparison with filtered back projection and adaptive statistical iterative reconstruction. Int. J. Cardiovasc. Imaging 2014, 31, 31–38.
- Forte, E.; Monti, S.; Parente, C.A.; Beyer, L.P.; De Rosa, R.; Infante, T.; Cavaliere, C.; Cademartiri, F.; Salvatore, M.; Stroszczynski, C.; et al. Image Quality and Dose Reduction by Dual Source Computed Tomography Coronary Angiography: Protocol Comparison. Dose Response 2018, 16, 1559325818805838.
- Vigneswaran, T.V.; Kapravelou, E.; Bell, A.J.; Nyman, A.; Pushparajah, K.; Simpson, J.M.; Durward, A.; Zidere, V. Correlation of Symptoms with Bronchoscopic Findings in Children with a Prenatal Diagnosis of a Right Aortic Arch and Left Arterial Duct. Pediatr. Cardiol. 2018, 39, 665–673.
- Valverde, I.; Tangcharoen, T.; Hussain, T.; De Bliek, H.; Penney, G.; Breeuwer, M.; Schaeffter, T.; Razavi, R.; Greil, G. Magnetic resonance imaging planning in children with complex congenital heart disease—A new approach. JRSM Cardiovasc. Dis. 2017, 6, 2048004017701870.
- Dyverfeldt, P.; Bissell, M.; Barker, A.J.; Bolger, A.F.; Carlhäll, C.-J.; Ebbers, T.; Francios, C.J.; Frydrychowicz, A.; Geiger, J.; Giese, D.; et al. 4D flow cardiovascular magnetic resonance consensus statement. J. Cardiovasc. Magn. Reson. 2015, 17, 72.
- Frieberg, P.; Aristokleous, N.; Sjöberg, P.; Töger, J.; Liuba, P.; Carlsson, M. Computational Fluid Dynamics Support for Fontan Planning in Minutes, Not Hours: The Next Step in Clinical Pre-Interventional Simulations. J. Cardiovasc. Transl. Res. 2021.
More