As the supply of commodities forms essential lifelines for modern society, commodity price
fluctuations can significantly impact the operation and sustainable development of macroeconomics,
production activities, and people’s security and well-being. The commodity trading market also plays
a pivotal role in the competition of the international industrial chain and the sustainable development
of the industry. The method of bibliometrics was used in this study to trace the development of
research on commodf the ity prices, and statistical and co-citation analyses were conducted on selected
liteustrature samples. It was found that the research hotspots in this field are concentrated on four
aspects: factors influencing commodity prices, the impact of price fluctuations on the macroeconomy,
forecasts of commodity prices, and the financialization of commodities. A current commodity price
research network centered on oil prices has formed. Future directions in this field, which developed
out of oil shock research 40 years ago, can further investigate the impact of factors and the responses
that can be made to emergencies on commodity prices, as well as continuing to develop better
methods of commodity price forecasting
- commodity prices
- bibliometrics
- co-citation
- cluster analysis
- Introduction
1. Introduction
Compared with traditional qualitative literature reviews, bibliometric analysis, using statistical methods, can evaluate and review research progress in a more comprehensive and objective way, and is visualized. Therefore, this paper uses the Citespace software to sort out the development of the field of “commodity prices”, grasp the overall growth trend of the number of documents and citations in this field, figure out the top scientific research institutions, countries and core authors, as well as their cooperation relationships. At the same time, through co-citation analysis, we can understand current research hotspots and dynamic evolution to clarify future research trends.
- Methods and Data
Bibliometric analysis is powerful for tracing the development path and grasping the research hotspots of a specified research field. Because it integrates mathematics, statistics, and philology to help researchers conduct quantitative analysis and visual research on literature, it can quickly identify the coupling relationship between published articles and the cooperation relationship between authors. The most common analysis methods include core author analysis, co-citation analysis, and co-word analysis [15–17].
For this study, research papers on commodity prices were searched for and collected from the “Web of Science Core Collection” database. We first searched the database using keywords, including “commodity price”, “price of commodity”, “food price”, and “oil price”, and limited the searched-for literature types to “Article” and “Review”. We then collected a list that contains 2962 articles from 1900 to 2020 (downloaded on 14 September 2021). Next, based on the title, keywords, and abstract, we excluded papers that are not closely related to the research topic, such as wholesale price of goods in a certain year, and product sales strategies. Finally, 1671 papers remained.
- Statistical Analysis of Commodity Prices
This section may be divided into subheadings. It should provide a concise and precise description of the experimental results, their interpretation, as well as the experimental conclusions that can be drawn.
3.1. Research on the Overall Growth Trend
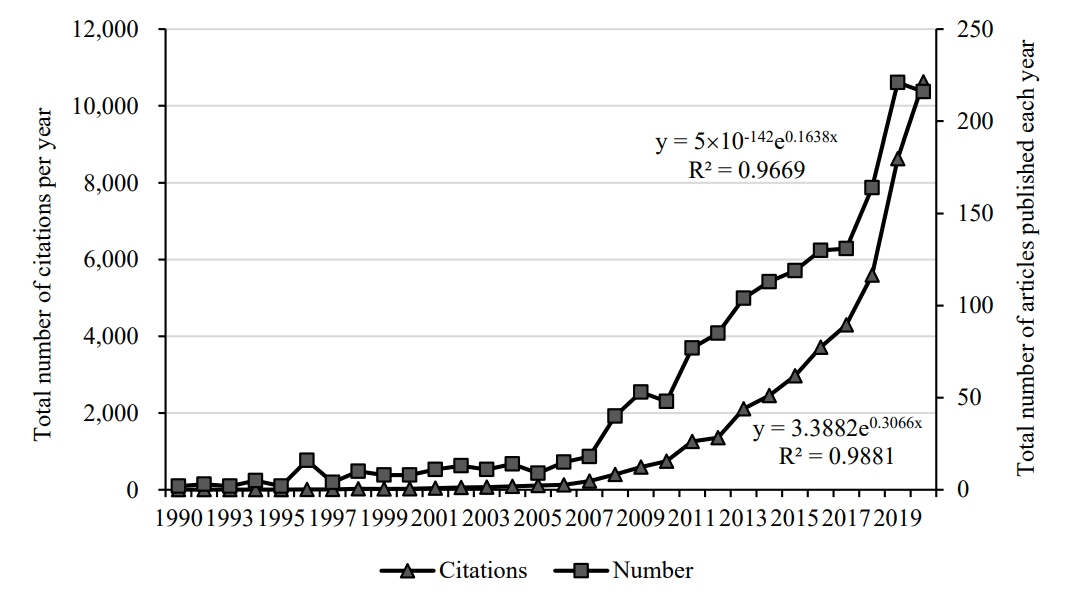
The degree of academic attention to a certain field can be reflected in the number of publications and citations. It can be seen from Figure 1 that the literature on commodity prices has gradually increased since 2000, and has shown an explosive growth trend after 2008, reaching 221 in 2019. From 1990 to 2019, the number of documents has doubled a hundredfold in 30 years. This is in line with the actual situation. The 2008 financial crisis caused violent fluctuations in commodity prices and severely impacted economic operations. Since then, more scholars have devoted themselves to research in this field.
2. Statistical Analysis of Commodity Prices
2.1. Research on the Overall Growth Trend
The degree of academic attention to a certain field can be reflected in the number of publications and citations. It can be seen from Figure 1 that the literature on commodity prices has gradually increased since 2000, and has shown an explosive growth trend after 2008, reaching 221 in 2019. From 1990 to 2019, the number of documents has doubled a hundredfold in 30 years. This is in line with the actual situation. The 2008 financial crisis caused violent fluctuations in commodity prices and severely impacted economic operations. Since then, more scholars have devoted themselves to research in this field.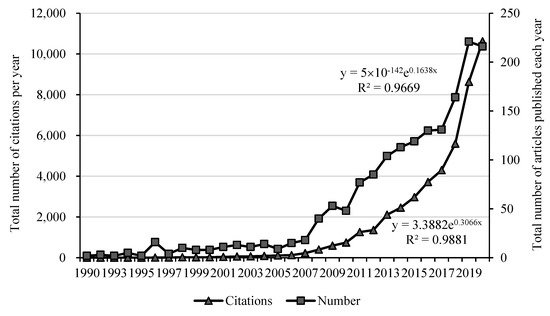
Figure 1.
The number of published documents in each year (1990–2020).
Figure 1 also reflects the changing trend of the number of citations in the field of commodity prices in the past 30 years. The number of citations grew from 5 in 1990 to 10,624 in 2020. The most cited article is Kilian’s article published on AER in 2009. This groundbreaking research decomposed the actual price of crude oil into three parts: crude oil supply shocks, shocks to the global industrial commodity demand, and demand shocks specific to the crude oil market; it discussed the reasons for major oil price shocks since 1975. As of 2020, this article has been cited 1,409 times, becoming a foundational work in the field of commodity prices.
For the quantitative work, our method was: apply exponential fitting to the number of articles published each year and the number of citations. The R-squares of the curves are 0.967 and 0.988, respectively, indicating that the number of research documents and citations in the field of commodity prices has exponentially increased; this reflects the high degree of concern of the academic community on commodity prices in recent years.
3.2. Publication Sources
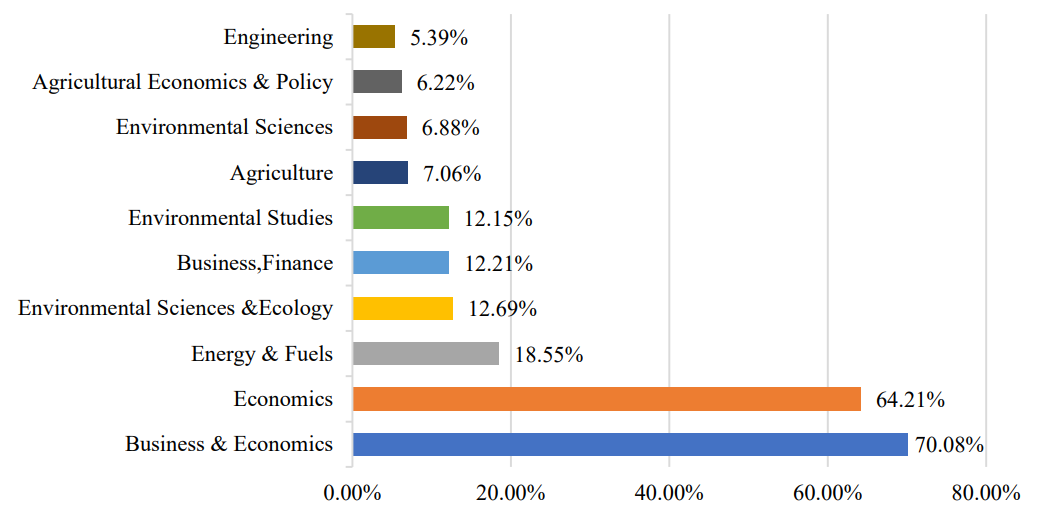
Figure 2 shows the main research areas of commodity prices and their proportions. The research direction is given by the Web of Science database. Since the research content of a document may involve multiple fields, the proportions of each field add up to more than 100%. It can be seen that the research is mainly concentrated on economics and energy, with a small proportion of research focusing on finance.
2.2. Publication Sources
Figure 2 shows the main research areas of commodity prices and their proportions. The research direction is given by the Web of Science database. Since the research content of a document may involve multiple fields, the proportions of each field add up to more than 100%. It can be seen that the research is mainly concentrated on economics and energy, with a small proportion of research focusing on finance.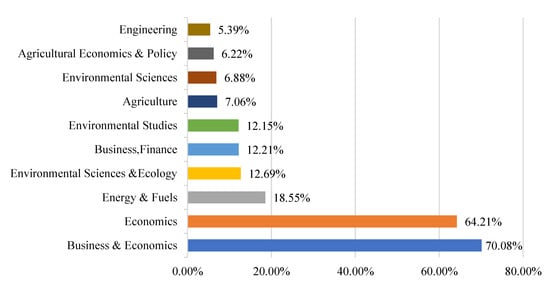
Figure 2.
Main research areas and proportions.
Paying attention to publications of frequently cited literature can clarify the degree of academic attention to the field of commodity prices. Table 1 shows some highly cited journals and their impact factors in the past five years. Among them, Energy Economics, Journal of Econometrics, Econometrica, and American Economic Review are highly cited. They are the top publications in the fields of energy, econometrics, and economics. It shows that in addition to relevant professional knowledge, research on commodity prices also involves using a large number of econometric models. From the perspective of the volume of publications, the literature in this field is mostly concentrated on Energy Economics, Energy Policy, and Energy, and the impact factors of these journals are all above 6; this indicates that there has been a batch of high-quality articles affecting economic operation and resource management in the field of commodity price research.
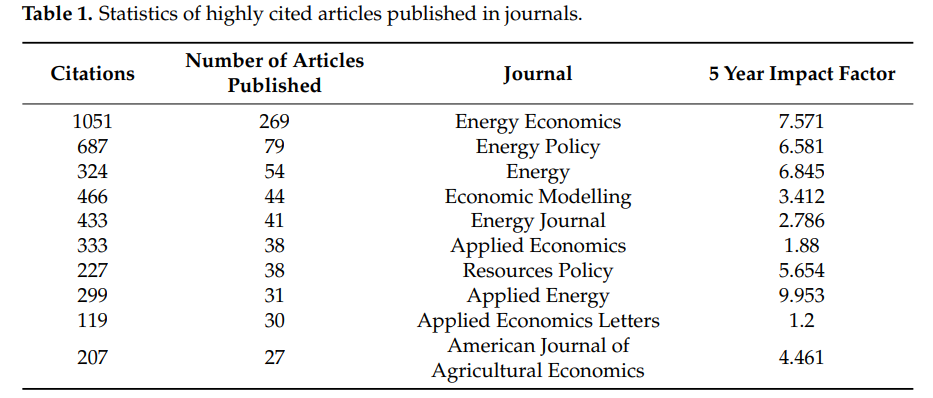
| Citations | Number of Articles Published | Journal | 5 Year Impact Factor |
|---|---|---|---|
| 1051 | 269 | Energy Economics | 7.571 |
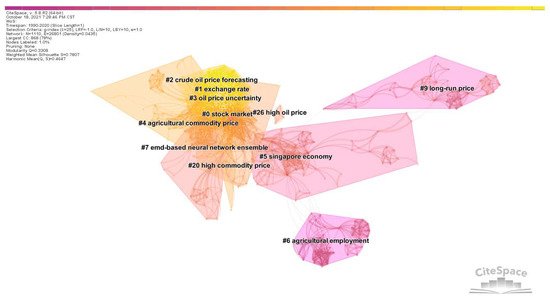
| Cluster ID | Cluster Label | Cluster Size | Silhouette | Year (Average) | ||||
|---|---|---|---|---|---|---|---|---|
| #0 | stock market | 209 | 0.656 | 2006 | 687 | 79 | Energy Policy | 6.581 |
| #1 | exchange rate | 141 | 0.698 | 324 | 54 | Energy | 6.845 | |
| 466 | 44 | Economic Modelling | 3.412 | |||||
| 2013 | ||||||||
| #2 | crude oil price forecasting | 126 | 0.729 | 2012 | ||||
| #3 | oil price uncertainty | 103 | 0.749 | 2014 | 433 | 41 | Energy Journal | 2.786 |
| #4 | agricultural commodity price | 76 | 0.854 | 2009 | 333 | 38 | Applied Economics | 1.88 |
| #5 | Singapore economy | 70 | 0.954 | 1996227 | 38 | Resources Policy | 5.654 | |
| 299 | 31 | Applied Energy | 9.953 | |||||
| 119 | 30 | Applied Economics Letters | 1.2 | |||||
| 207 | 27 | American Journal of Agricultural Economics | 4.461 |
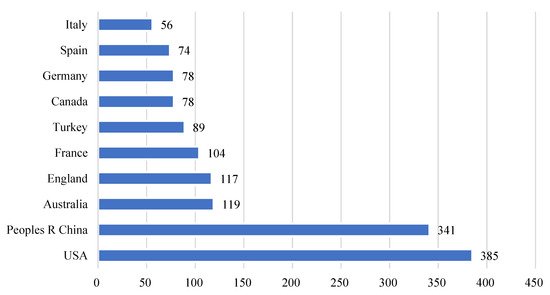
2.3. Research Countries
Figure 3 shows the cooperation network in the country where the first author of the article is located. According to Figure 3, the United States, China, Australia, and France are at the center of the network, forming a relatively close cooperative relationship, and each has cooperation with many other countries. Judging from the average year of publication, the United States, Canada, and other countries started research in this area earlier. While China started late, Chinese authors quickly occupied the sub-center position of this network. Figure 4 summarizes the number of publications in the country of the first author. The United States (385) and China (341) have the largest number of publications. The sum of the number of articles from the two countries accounts for more than one-third of the total publications, followed by Australia (119), England (117), and France (104). The total number of articles by researchers in these five countries accounts for more than one-half of the total.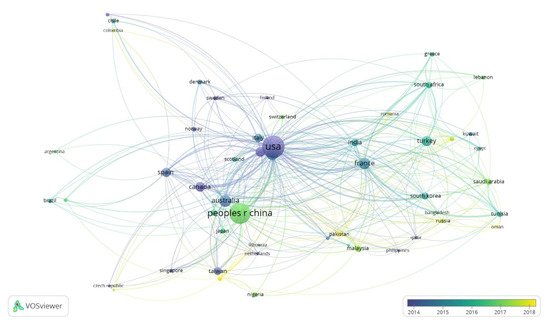
3. Co-Citation Analysis of Commodity Prices
3.1. Cluster Analysis of Co-Cited Articles
| #6 | ||||
| agricultural employment | ||||
| 47 | ||||
| 0.995 | 1991 | |||
| #7 | EMD-based neural network ensemble | 47 | 0.969 | 2001 |
| #9 | long-run price | 38 | 1 | 1993 |
| #20 | high commodity price | 7 | 0.996 | 2008 |
| #26 | high oil price | 4 | 0.996 | 2003 |
- (1)
-
Influencing factors of commodity prices (Cluster #1, #9, #20, #26)The influencing factors of commodity price fluctuations have been widely focused on by many scholars. The contradiction between supply–demand and inventory change are generally considered the basic factors affecting international commodity price fluctuations. Since the operation of the global economy is fundamental to commodity supply and demand, but financial markets can have a spillover effect into the commodity market, the coordinated change of commodity prices becomes a goalpost for planners. Speculative factors have pushed up the prices of major commodities in the past, making the strong demand from emerging economies another reason for the overall rise in commodity prices. Factors including natural disasters, cyclical changes in production, and policy adjustments also considerably impact commodity prices. Differences in national economic systems also lead to differences in commodity prices between countries. The economic system affects the speed and strength of the transmission of international commodity prices to domestic commodity prices, and ultimately reflects in domestic prices.A substantial increase or decrease in commodity prices frequently results from a combination of multiple factors. Hamilton [20] studied some factors leading to changes in crude oil prices, including supply and demand, commodity speculation, monopolistic oligarchs, and resource depletion. Mueller et al. [21], analyzing the reasons why food prices doubled in the world from March 2007 to March 2008, found multiple factors, including greater energy and fertilizer costs, increased financial speculation in commodity markets, export restrictions, dollar depreciation, biofuel production increase, poor harvests, reduced world food reserves, increased foreign exchange reserves, and the continuing increase in world population and expectations of affluence.Academic circles have continuously analyzed the factors affecting commodity price fluctuations. Ranging from the basics of supply and demand to the impact of financial speculation and analysis of interruptive events, and from linear to nonlinear, the research in these directions continues to deepen comprehensively [22,23,24,25,26,27,28,29].
- (2)
-
The impact of commodity price fluctuations on macro economy (Cluster #3, #4, #5, #6)The impact of commodity price fluctuations on the macroeconomy is another noteworthy research direction that has developed to a great extent.Building on the foundational work of Hamilton [30] four decades ago, scholars have segued to study the oil price–economic growth relationship [31,32,33,34] or taken up nonlinear perspective considerations [35,36,37]. Important in international trade, the relationship between commodity prices and exchange rates has also received key attention. Chen [38] used monthly panel data from G7 countries to study the long-term relationship between oil prices and real exchange rates, and found that a co-integration relationship between them and oil prices can better predict exchange rate trends. Other literature uses models such as the vector autoregressive model (VAR) and generalized autoregressive conditional heteroskedasticity model (GARCH) to select different countries as research objects to explore the relationship between commodity prices and exchange rates [39,40,41,42,43,44,45,46].The unemployment rate and consumer price (CPI) are also variables of concern. Papapetrou [47] used the VAR model to explore the relationship between oil prices and several macroeconomic variables in Greece, and found that changes in oil prices affect actual economic activities and employment. Ewing and Thompson [48] used Hodrick–Prescott and Baxter–King filters, and a full-sample asymmetric Christiano–Fitzgerald band-pass filter, to study the cyclical linkage between crude oil prices and production, consumer prices, unemployment, and stock prices. Guerrero-Escobar et al. [49] used 17 highly heterogeneous countries as samples to study responses of industrial activity, inflation, interest rates, and exchange rates to oil price shocks.The impact of commodity prices on sustainable development has received increasing attention in recent years, mainly energy prices. Borzuei et al. [8] used a threshold model to study the impact of energy prices on Iran’s sustainable development under different economic growth regimes, which is mainly achieved by promoting the use of renewable energy. Similarly, Li and Leung [50], Mukhtarov et al. [51], Karacan et al. [52], and Mukhtarov et al. [53] confirmed the role of energy prices on renewable energy consumption, and further affects the achievement of sustainable development goals. Umar et al. [54] found that effective energy price policies can reduce carbon emissions and achieve SDGs; Ma et al. [55], Sha et al. [56], Lee and Chong [57], Guo et al. [58], Malik et al. [59], and Ike et al. [60] also confirmed the same point.
- (3)
-
Commodity price forecast (Cluster #2, #7)The drastic fluctuations in commodity prices have attracted many scholars to study commodity price forecasting. When the prices of commodities are relatively stable, forecasting pays more attention to the general trend of prices and the overall price range, that is, the first-order moment of prices. But when commodity prices fluctuate wildly, forecasting needs to focus on the degree of price volatility, that is, the second-order moment of prices.At present, there are mainly three methods to forecast commodity prices: (1) traditional econometric models, such as the autoregressive moving average model (ARMA), autoregressive integrated moving average model (ARIMA), and generalized autoregressive conditional heteroskedasticity model (GARCH); (2) machine learning methods, such as support vector machines (SVM), artificial neural networks (ANN), and Random Forest (RF); and (3) hybrid models combining the above two methods [61]. Traditional econometric models are based on strict linear assumptions and cannot introduce too many independent variables. Machine learning methods, because they can effectively distinguish random factors and capture hidden nonlinear characteristics that traditional econometric models fail to do, can introduce more independent variables to maximize the control of influencing factors.For the traditional econometric models, some scholars have proposed improved models for commodity price prediction. Herrera et al. [62] used high-frequency intra-day realized volatility data to evaluate the relative prediction performance of various models, including risk measurement models, the GARCH model, asymmetric GARCH model, split-integral GARCH model, and Markov transformed GARCH model. Gupta and Wohar [63] used a qualitative vector autoregressive to predict monthly returns of oil and stocks. Based on the GARCH-X model, Gavriilidis et al. [64] used oil shocks of unknown sources as exogenous variables to study their impact on the accuracy of spot price predictions.For machine learning methods, scholars have attempted to decompose the sequence through singular spectrum analysis (SSA) or empirical mode decomposition (EMD), predict the decomposed sequence, and finally synthesize the prediction of the original sequence. Yu and Wang [65] proposed a neural network ensemble learning paradigm based on EMD for the forecast of world crude oil spot prices. Wang and Li [66] proposed SSA-NN, a neural network prediction method based on SSA smoothing, and used four criteria to compare the performance of this model with the basic neural network model. Their results show that the SSA-NN model is superior to the basic neural network model in terms of performance and accuracy to capture trend changes.More scholars have focused on innovating on basic machine learning methods to improve prediction accuracy. For example, Huang and Wu [61] used deep multi-core learning (DMKL) to predict oil prices, verified that the model was superior to the traditional model through real data, and significantly reduced prediction errors. Zhang and Na [67] proposed an agricultural product price prediction model that combines fuzzy information granulation, a mind evolutionary algorithm (MEA), and a support vector machine (SVM). Their experiments proved that the model has a higher prediction accuracy and faster calculation speed.In the hybrid model, many models combine the advantages of measurement models and machine learning to improve prediction accuracy. Zhang et al. [68] proposed the EEMD–PSO–LSSVM–GARCH hybrid model to predict oil prices. Kristjanpoller and Minutolo [69] used the ANN-GARCH model to predict oil spot and future prices, and successfully improved that prediction model in terms of volatility and spot prices.
- (4)
-
Financialization of commodities (Cluster #0)As a foundational study on the relationship between commodity prices and financial markets, Sadorsky [70] adopted the VAR model that incorporated monthly data from January 1947 to April 1996 in the United States. It was found that the shocks of oil prices would significantly affect the actual returns of stocks, and this effect was more pronounced in 1986. Afterward, scholars have chosen various research objects and different time periods to analyze the impact of commodity price changes on stock price changes or stock returns [47,71,72,73,74,75,76,77].The 2006–2008 food crisis and the 2008 global financial crisis caused violent fluctuations in commodity prices. This led the academic community to conclude that basic supply and demand factors alone could not explain drastic changes in prices in a short period of time, sensing some of the change could be attributed to financial factors, such as the financialization of commodities, that is, significant index investment flows into commodity markets. Morana [78] found that since 2000, financial shocks have played an important role in boosting oil prices, and this effect has become more pronounced after 2008. Tilton [79] studied the impact of investor demand on commodity spot prices and predicted that, if the futures market is strong, a surge in investor demand will increase the price of the futures market and directly affect spot market price. However, when the futures market is relatively weak, investor behavior would have little impact on spot prices. The financialization of commodity markets has also resulted in excessive linkages between commodity prices [80].