Your browser does not fully support modern features. Please upgrade for a smoother experience.
Please note this is a comparison between Version 1 by Decao Yin and Version 3 by Amina Yu.
The ‘Green Shift’ from fossil energy (coal, oil and natural gas) to renewable energy (sunlight, wind, waves and tide) is now a global trend. DNV forecasts that by 2050, the installed floating global wind capacity will have grown from today’s 100 megawatts (MW) to over 264 gigawatts (GW), so that 2% of the world’s electricity demand can be supplied by cost-efficient and dependable floating offshore wind. Floating offshore wind is considered to be a viable solution at water depths exceeding 50 to 60 m with abundant wind resources. As a fast-evolving technology, it has the potential for less foundation material, shortened installation cycle and decommissioning, and additional wind power generation.
- vortex-induced motions (VIM)
- vortex-induced vibrations (VIV)
- floating offshore wind turbine (FOWT)
1. Engineering Practice in Relation to Vortex-Induced Motions (VIM)
Spar platforms have relatively large aspect ratios (draft over diameter). They are permanently anchored to the seabed vertically by a spread moored system. There exist several variations of spar platforms [1][55]. The Classic Spar is a cylindrical deep draft floater. A Truss Spar has a buoyant cylindrical upper section (hard tank), which provides buoyancy, and a lower section composed of a space frame truss. The Cell Spar consists of several smaller diameter tubes joined together in contrast to a single large diameter tube forming the hull.
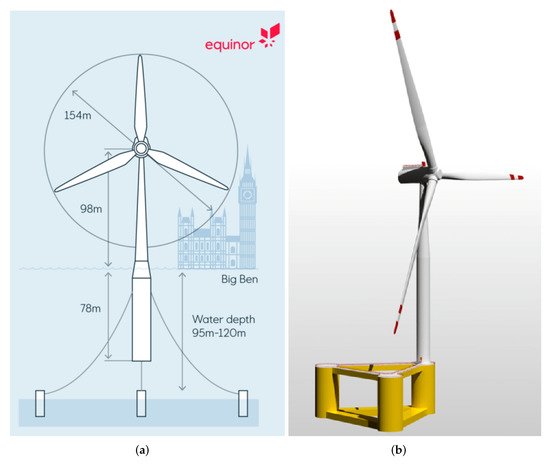
Spar-type floaters have been deployed by offshore floating wind turbines, such as Hywind Scotland; see Figure 18a. It should be noted that the dimensions are much smaller than a typical spar platform in the oil and gas industry.
Semi-submersibles (semi) are floating structures with multi-legs and a large deck. These legs are interconnected at the bottom underwater with horizontal pontoons, which provide buoyancy force [2][56]. Some of the earlier semis resemble the ship form with twin pontoons having a bow and a stern. This configuration was considered desirable for relocating the unit from drilling one well to another either under its own power or being towed by tugs. Early semis also included significant diagonal cross bracing to resist the prying and racking loads induced by waves. The introduction of heavy transport vessels that permit the dry tow of mobile offshore drilling units (MODUs), the need for much larger units to operate in deep water, and the need to have permanently stationed units to produce from an oil and a gas field resulted in the further development of the semi concept. The next generation semis typically appear to be a square with four columns and the box- or cylinder-shaped pontoons connecting the columns. The box-shaped pontoons are often streamlined, eliminating sharp corners for better station keeping. Diagonal bracing is often eliminated to simplify construction.
Semi is also one type of floater for floFOWT, ating offshore wind turbines illustrated in (FOWT)Figure 2. A design of an FOWT with a semi-submersible floater is shown in Figure 18b.
There is no well-established, concrete analytical method for VIM responses of FOWTs. Since vortex-induced vibrations (VIV)/VIM is a strongly non-linear phenomenon, model testing has often been used to determine the hull VIM responses and calibrate the numerical simulations. It is clear that the industry needs widely accepted and consistent practices for addressing spar VIM in order to ensure the integrity of existing and future floater designs, following up the transition from the oil and gas industry to the renewable energy industry. However, the industry has not yet had the opportunity to share and review the collective data/knowledge on VIM in order to establish a common understanding of the problem and an industry consensus on how to deal with VIM in design. In the standard of the International Organization for Standardization ISO19901-7 [4][58], for instance, ‘a concrete method of assessing VIM displacement is not represented in the standard document, though the requirement on the VIM demands for an assessment on the basis of a proper way’ [5][59]. In this section, following the standards and regulations, the recommended practices are discussed. The existing regulations and recommended practice accounting for VIM are fragmentary [4][6][7][8][9][10][11][12][7,8,11,58,60,61,62,63]:
The VIM on floating structures is often treated by design curves. A typical VIM design curve gives the design amplitude ratio as a function of reduced velocity. Figure 29 shows an example of a VIM design curve of a typical spar of FOWTs.
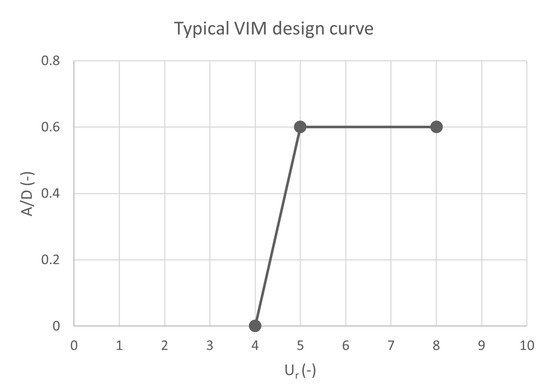
Figure 29. A typical VIM design curve: normalized VIM design amplitude versus reduced velocity, reproduced Figure 3 of [13].
A typical VIM design curve: normalized VIM design amplitude versus reduced velocity, reproduced Figure 10 of [64].
For semi-submersibles, the current heading and draft are important parameters [14][15][65,66]. A design guidance of a Deep Draft Semi-submersible® considering VIM responses from model tests was derived [14][65]. This guidance was found to lead to very conservative estimates of VIM [16][67], which was mainly due to Reynolds number effects.
API Recommended Practice 2SK: Design and Analysis of Stationkeeping Systems for Floating Structures [7][8] identified the following gaps with regard to VIM:
-
The duration for peak current and resulting VIM can be much longer than the peak storm duration.
-
The calibration of factor of safety (FoS) for mooring design does not include the spar VIM condition and the uncertainties associated with spar VIM. Consequently, sensitivity checks may be warranted.
Both experimental and numerical research activities have been carried out to investigate the VIM responses during the past decades; however, the understanding of VIM and engineering practice still need further improvements.
2. VIM Model Tests
Because there is no established analytical method for determining FOWT motion responses undergoing VIM, model testing is recommended to determine VIM amplitude, response frequency and drag coefficient in design. There are two recommended practices for model tests: at either super-critical or sub-critical Reynolds numbers in a towing tank. Extensive VIM model tests were carried out for the oil and gas industry as well as recently the renewable energy industry. The target test specimens include circular cylinders [17][18][19][20][21][19,21,22,23,68], spars [5][22][23][24][25][26][30,59,69,70,71,72] and semi-submersibles [14][16][65,67]. The models were either submerged in water in a horizontal position or fully submerged/floating, surface piercing vertically.
This section reviews selected influential VIM model tests, outlining the state-of-the-art experimental techniques on VIM. The main dimension parameters of typical floaters of FOWTs are shown in Figure 310.
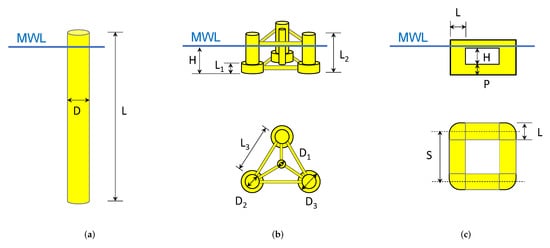
Figure 310. Main dimension parameters of typical floaters of FOWTs. (a) Spar, sketch inspired of [8]Figure 7a of [11]. (b) Three-column semi-submersible, sketch inspired of Figure 2 of [27][73]. (c) Four-column semi-submersible, sketch inspired of Figure 29 of [8][11].
3. Review of Numerical Studies of VIM
Comparing with experimental work, numerical studies on VIM are very limited. This section reviews selected numerical simulation work including computational fluid mechanics (CFD) work related to FOWT and VIM.
3.1. Numerical Simulation of FOWT
To study the VIM of spar and mono-column type floating production storage and offloading, a wake oscillator model was proposed by [28][77], and results were compared with experiments from [29][30][75,76].
There exist some notable general numerical studies on spar-type FOWTs [13][31][32][33][34][35][4,64,105,106,107,108].
A linearized aero-hydro-servo-elastic floating wind turbine model was presented and used to perform integrated design optimization of the platform, tower, mooring system, and blade-pitch controller for a 10 MW spar floating wind turbine [33][34][106,107].
The influence of vortex-induced loads on a spar-type FOWT was investigated in [32][105] using a coupled aero-hydro-vortex-mooring numerical model, and the vortex-induced loads are simulated by a CFD approach. It was concluded that the sway and roll motions were dominated by the lift force induced by the vortex shedding. The coupling of different responses and non-linearities of the stiffness was also observed. Ref. [31][4] investigated the effect of wave–current–structure interaction on a moored 6MW spar-type FOWT. Regular waves and uniform current were considered, while wind loads were not considered.
Mooring lines are one of the key elements of FOWTs. Digital twins were developed to detect the long-term drift and near-future axial tension of mooring lines to predict the extreme loads and fatigue [35][108]. The dynamic response of a fully non-linear model of a DeepCWind FOWT was investigated [36][109] after one of its three-catenary mooring systems was broken. It was suggested that the tension change was closely related to the drift motion, necessitating an increase in the minimum breaking load (MBL) of the mooring line components.
A spar-type FOWT with a conventional three-line mooring system in catenary configuration was studied by [37][110] using RIFLEX [38][111], and it included the non-linear restoring force–offset relationship (restoring stiffness). Such non-linear stiffness has been further confirmed in the data analysis of Hywind Scotland field measurements [39][17], resulting in a large variation of natural frequency ratio between IL and CF, which needs to be considered in the VIM analysis.
Along with the collaboration between Equinor and SINTEF on the topic ‘Large floating wind turbines’, SINTEF Ocean carried out relevant numerical studies on the VIM of a FOWT. A case study of a spar-type FOWT using three different analysis methods was carried out [13][64]:
-
Non-linear time domain simulation with a harmonic load applied perpendicular to the current direction.
Load coefficients established for the VIV of slender structures have been used in the analyses. The focus was on the qualitative characteristics of the predicted response and on what is included in the different types of analyses values. The time domain VIV load model has advantages of handling non-linearities and time-varying flow, it is therefore a promising analysis method for VIM predictions. The hydrodynamic coefficients may be influenced by the high Reynolds numbers and small aspect ratios of FOWTs, which need further investigation.
3.2. Application of CFD on VIM Study
CFD has been used as an important tool for studying the vortex-induced motion of offshore floating structures since the early 2000s, with a major focus on the spar concept. Early studies also investigated the VIM of straked cylinders given the similarities between straked cylinder and spar platforms [41][112]. Later on, there have been a good number of publications that used CFD to simulate the VIM of spar, to name a few [42][43][44][45][113,114,115,116]. Most of these works have focused on exploring the capabilities of CFD to predict VIM and validate against model tests. A variety of CFD methods have been considered, including Reynolds averaged Navier–Stokes (RANS) equations and Detached Eddy Simulations (DES).
Overall speaking, due to the limitations of computational power, the above-mentioned work could not achieve very high grid resolution. Seeing from today’s standard, one may question the mesh resolution in these studies. However, in most of these papers, a mesh convergence study was presented, giving additional confidence in the results presented therein. Regardless, these early studies already demonstrated that CFD can predict the vortex-induced motion of a spar with satisfactory agreement with model tests. In addition, there are several important conclusions that can be instructive even for CFD studies today:
-
Details of the structure matter. It is practical to ignore some details simply because they may introduce unnecessarily additional work without bringing in equivalent gain, but this must be undertaken with caution. This has been discussed in the above-mentioned papers, and it turned out that by including or excluding some appurtenances on a spar installation, predictions can deviate a lot, and this is confirmed by several model tests [22][46][47][30,50,95]. Yet, choices must be made due to the compromises between cost and accuracy.
-
Flow direction matters. This is straightforward, because when a spar is fully appended with strakes, chains, and pipes, the current from different directions will induce different levels of VIM.
In 2013, a CFD guideline for spar VIM was proposed by [48][117], in which different CFD approaches have been reviewed, and some were tested. Numerical details have been discussed in this paper, including choice of turbulence model, grid resolution, time step size and method for handling dynamic motion. This guideline places a solid common practice to increase the reliability of CFD results on spar VIM.
When it comes to more recent research, there is a clear tendency that more work starts to investigate semi-submersibles [49][50][51][52][118,119,120,121]. In [52][121], the authors made a quite comprehensive review on this topic, so the work mentioned therein is not repeated here.
Compared to spar, semi-submersibles raise different challenges, amongst which the most critical one is that as the structure becomes more complex, wake interactions among different columns play a more important role. This means that the wake has to be properly resolved in addition to the boundary layers and near-structure flow regions. In other words, the application of CFD on semi-submersibles is more expensive. On the other hand, there are more design parameters for a semi-submersible than for a spar platform, where CFD can contribute to the early design stage where the number, size, shape and arrangement of columns together may easily result in a massive parameter matrix. Multiple promising designs may need predictions from CFD rather than theoretical estimations, and the above-mentioned CFD studies demonstrated CFD’s strength in comparing the VIM performances of semi-submersibles under different column arrangements.
The Reproducible Offshore CFD JIP was initiated for developing and verifying a CFD modeling practice for several typical offshore applications [53][54][55][122,123,124], and SINTEF Ocean joined some work packages. One work package was about semi-submersible VIM [54][123]. Model tests on squared column semi-submersible were used for benchmarking the CFD models. Generally, the comparison between CFD simulations and model tests was good; however, the yaw responses were over-predicted at higher reduced velocities.
CFD simulation of a multi-mono-column platform FOWT (OC4) was carried out by using OpenFOAM [56][125]. A range of reduced velocities was investigated. By comparing the results from current only and collinear wave and current cases, it was observed that the given incident waves (collinear as current) mitigate VIM responses for a wide range of reduced velocities. This finding is useful, and it is of interest to investigate the interaction of incident waves and currents on VIM.
Summary of Application of CFD on VIM Study
-
Using CFD for VIM has been shown to be a promising approach both for spars and semi-submersibles. The comparisons presented above give confidence to the further application of CFD in the design phase, especially when the screening of preliminary designs is finished, and some promising candidates stand out. In this stage, running CFD simulations of these candidates will give more reliable force and VIM predictions than more simplified numerical tools, while also being a lot cheaper/faster compared to model tests.
-
High-quality model test measurements form a solid basis to validate CFD modeling, providing the possibility to make a very detailed comparison and quality control.
-
CFD provides flexibility to extract detailed forces/loads on segments, separated columns, and even some small structural details. This can be important for optimizations. Emphasis can also be put to access the pressure and wall shear stress plots on the structure, so instructive information is more easily extracted from CFD simulations for designers to identify where improvements can potentially be made.
-
Detailed flow visualizations, especially in the wake, are accessible in CFD. This may be especially interesting for semi-submersibles. With the intuitive and detailed flow visualizations, physical insight in the fluid/vortex dynamics could be improved.
4. Review of Field Measurements of FOWTs
High-quality, high-resolution field measurements are essential to either check the ‘scaling effects’ of laboratory tests or validate numerical simulations. For FOWTs, the following measurements are usually made.
The VIM of a prototype Deep Draft Semi-submersible® (SBM Atlanta) with four square columns was reported and compared with model tests in [16][67]. GPS measurements provided the motion of the prototype Semi under current conditions. The measured mean radial offset ranges from 0.2D to 0.6D, and the lock-in region is centered around 0.35D, while the maximum measured Y-direction amplitude was around 0.2D. There was no sea-state information available based on platform measurements. It was assumed that the sea state was less than 6 ft for the presented data time frame based on observations at nearby oceanographic buoys. A key observation from the comparison indicated that the VIM motion from model tests was significantly less than from the field measurements.
‘The Hywind Demo is a demonstration system that was installed and commissioned in Norway in 2009; it was the world’s first full-scale floating offshore wind turbine. The installed capacity of the demo system is 2.3 MW. The demo unit is located 10 km west of the island of Karmøy off the Norwegian west coast. The water depth is 220 m’
In [58][126], numerical simulations by use of the SIMA analysis tool were carried out and compared to field measurements. Comparative dynamic simulations were carried out with the estimated wave elevation time series as input together with measured and further refined statistical parameters of the wind field. VIM was not considered in the study. Overall, good agreement was seen between the measured and simulated responses, which built confidence to further develop the proposed analysis tool.
In [57][127], a FAST model developed by NREL was validated against the field measurement of ‘Hywind Demo’. Measured wind speeds and wave spectra were used to develop the wind and wave conditions used in the model. The overall system performance and behavior were validated for eight sets of field measurements that span a wide range of operating conditions.
The Hywind Scotland wind park is located about 25 km east of Peterhead in Scotland at water depths in the range of 95–120 m, as illustrated in Figure 412A. The wind farm consists of five floating units, each equipped with a 6 MW wind turbine. The turbines are installed in two rows with a distance between each neighboring turbine of 9 rotor diameters (RDs), as shown in Figure 412B [59][128].
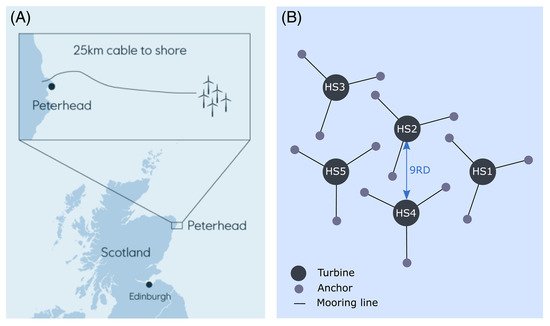
Figure 412. (A) The Hywind Scotland wind park is located 25 km east of Peterhead in Scotland. (B) Layout of the wind park consisting of five turbines labeled HS1 to HS5. A blue arrow marks the distance of 9 rotor diameters (RDs) between the turbines [59][128].
Measurements of floater responses from the Hywind Scotland wind farm both for turbines in free wind and in wake and for different atmospheric stability conditions were presented in [59][128]. Generally, the floater motions were small for all wind speeds, showing that the design performs satisfactorily in both free wind and wake conditions.
The VIM of Hywind Scotland FOWT was investigated in [39][17]. The field measurement data were analyzed and compared with time domain VIV analysis, focusing on the floating unit HS4. Data analysis of field measurements on HS4 was carried out, focusing on the VIM responses and mooring line tension. Key response characteristics such as amplitude and frequency under various environmental loads were investigated and presented. Non-linear time-domain simulation was carried out by using VIVANA-TD. Furthermore, the predicted VIM responses and mooring line tension force were compared with field measurements.