Molecular Weight Distributions in Bituminous Binders: Comparison
Please note this is a comparison between Version 1 by Sara Filippi and Version 2 by Dean Liu.

Molecular weight distributions are widely used to evaluate the effects of aging or modifiers in bituminous binders. As with polymers, the most common techniques to obtain the distributions can be subdivided into two main groups, depending on whether or not they use a solvent.

  • bitumen
  • apparent molecular weight distribution
  • gel permeation chromatography

1. Introduction

The molecular weight distribution (MWD) influences the rheological and mechanical properties of viscoelastic materials, such as bitumen. For this reason, there is an increasing use of the MWD in the scientific literature related to asphalt paving, where it is correlated with the composition, performance, aging susceptibility and compatibility with additives and polymers [1]. The MWD can be determined by several experimental techniques, such as size-exclusion chromatography (SEC), field-flow fractionation and mass spectrometry [2]. Of these, the most popular in terms of bitumen is SEC, also known as gel permeation chromatography (GPC) [3][4][3,4]. In GPC, the data are collected in a diluted state, where the interactions among molecules are eliminated or at least strongly inhibited by the solvent. This therefore provides a distribution that corresponds to a disaggregate state and contributes little to the open debate on the complex structure of binders [5].
It would thus be helpful to obtain the distribution directly in bulk, as in the “inverse mechanical” approach, which uses rheological data, which are typically collected in the linear viscoelastic region. The idea is that the viscoelastic functions contain the complete spectrum of relaxation times, which can thus be deconvoluted into an MWD [6][7][8][6,7,8]. The procedure uses different viscoelastic functions and requires a correlation between the operating variable (i.e., reduced frequency, shear rate, time) and the molecular weight (MW).
One of the criteria adopted to derive such a correlation is to obtain a similar MWD from the GPC and inverse mechanical method. In other words, the calibration curves in the inverse mechanical approach are tuned in order to unify the results obtained with the two techniques [9][10][9,10]. This is somewhat questionable because molecules that tend to aggregate can be interpreted as a single entity in bulk and as multiple components in solution.

2. Applications

GPC has been used in several studies on bituminous binders, and the arecent review by Ma et al. provides a thorough overview of the available literature [1]. Here, rwesearchers briefly analyze a few examples to show the differences and characteristics of the solution and bulk distributions.

2.1. Aging

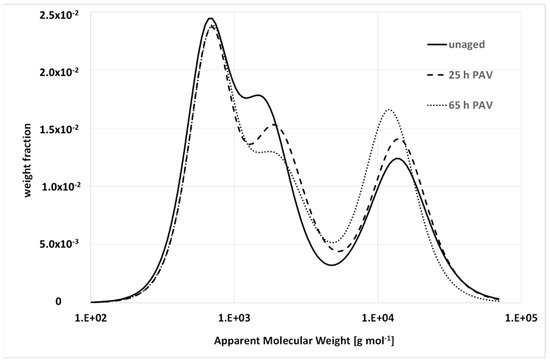
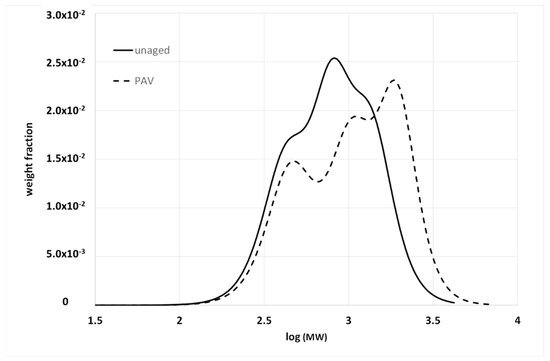
Oxidative aging is one of the main causes of long-term pavement deterioration, and there is a vast amount of literature on this topic in the field of asphalt [11][12][13][34,35,36]. From the AMWD perspective, the difference between bulk and solution characterization is of paramount importance. Partial oxidation of bituminous molecules determines the formation of new functional groups, and, above all, carbonyl (C=O) and sulfoxides (S=O) [12][35]. These functional groups alter the polarity of the molecules, and thus their contribution to the cohesive energy of the material, as well as their degree of association with the surrounding molecules. In fact, oxidative aging is often characterized by a sort of shifting to a fraction with a higher polarity (for example, an increase in resins and asphaltenes with a decrease in the aromatic content with saturates, which tend to remain stable). This has a significant effect on the bulk properties that macroscopically show the hardening of the materials, with a consequent reduction in their strain tolerance. In contrast, the new functional groups have a modest effect on the molecular weight of the molecules. Therefore, the BMWD is expected to be more sensitive to aging than the SMWD. This is highlighted in Figure 16 and Figure 27, which show the effects of artificial aging on the SMWD and BMWD for the same unmodified base bitumen.
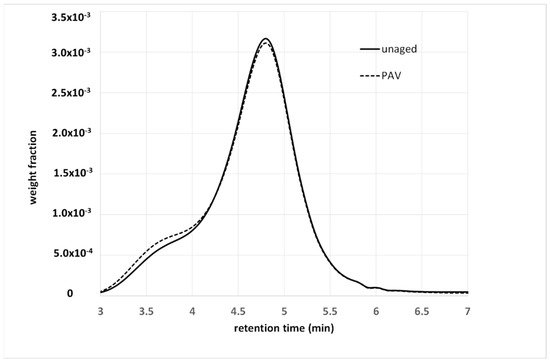
Figure 16. SMWD for a 35/50 Pen-grade base bitumen, before and after being subjected to a pressure-aging vessel (PAV).
Figure 27. BMWD for a 35/50 Pen-grade base bitumen before and after PAV. All details are given in [14][33].
In Figure 16, the SMWDs before and after aging are almost superimposable, and especially on the right-hand side, where they correspond to low-MW fractions. In contrast, aging stretches the BMWD toward high molecular weights, with a simultaneous variation in the relative intensity of the peaks (the meaning of which has been discussed in a previous work) [14][33]. Both distributions confirm that oxidation does not involve the less polar low-MW molecules, but mainly affects the aromatics, resins and asphaltenes. The asphaltenes undergo an increase in polarity and mutual interactions, which decrease their mobility and thus increase the apparent molecular weight. What is barely appreciable in solution becomes a well-visible effect in bulk. Consequently, several aging indexes have been proposed based on the evolution of the BMWD [15][16][13,32].

2.2. Additives or Modifiers

Many types of additives may be used to improve or restore the physical properties of bituminous binders, and, again, the SMWD and BMWD provide different information. Let reusearchers consider the case of rejuvenators, for example, which are vegetable oil added to an aged binder. Figure 38 shows the GPC spectra of a PAV-aged 50/70 penetration-grade binder, before and after the addition of a rejuvenating vegetable oil, as well as that of the oil.
Figure 38. Weight fraction as a function of retention time of PAV-aged and rejuvenated binder, and of the rejuvenating oil. Details are given in [17][18].
 Weight fraction as a function of retention time of PAV-aged and rejuvenated binder, and of the rejuvenating oil. Details are given in [16,17].
The oil causes the appearance of a small shoulder (between approximately four and five minutes), as the interactions with the binder are hidden by the solvent. In this case, the GPC confirms, at least qualitatively, the presence of the additive, as the latter gives a signal at a specific elution time. In some cases (for example, isolated or well-visible peaks), a quantitative determination of the additive can also be obtained from the spectrum. The BMWDs of the same two binders are given in Figure 49, together with that of the original unaged binder.
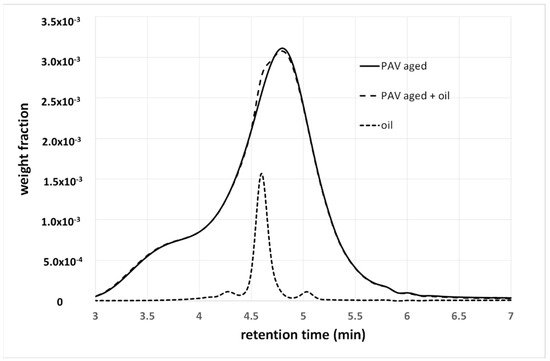
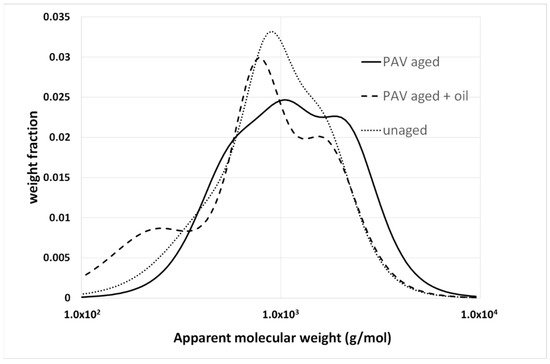
Figure 49. BMWDs of original PAV-aged and rejuvenated 50/70 binder.
As expected, the oil affects the whole bulk distribution because it replaces the lost light fractions in order to restore the original degree of aggregation in the binder. Therefore, the main advantage of a bulk distribution is that it provides useful information. In Figure 49, a comparison between the original and rejuvenated binder shows that this goal is partially achieved, with the two distributions being similar, and overlapping in the high-MW region.

2.3. Polymer-Modified Bitumen (PMB)

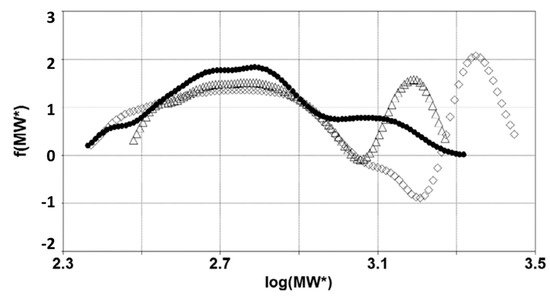
The use of polymers to modify bitumen is well known. The polymer-modified bitumen (PMB) obtained is a blend of two constituents with very different average molecular weights, and, thus, in theory, they are easy to identify in the MWD. This is why GPC can assess the presence of polymers when there is a rapid elution peak that corresponds to the polymer, which is clearly distinguishable from the signal associated with the bitumen molecules [19][20][37,38]. The weight fraction of the polymer corresponds to the relative area of the peak in the spectrum, but this calculation can be quite difficult due to the small amount of loaded polymer. Moreover, due to both the presence of short chains in the polymer and interactions with the stationary phase, the polymer and bitumen signals cannot be completely separated. This can happen, for example, in the case of HS-SEC, which confirms that the appropriate operating conditions are necessary, depending on the aims of the analysis. A moderate flow rate and a highly diluted solution favor the separation of the peaks and are preferable when polymer content is required. The role of GPC in PMB is thus similar to the above-described example of low-molecular-weight additives. In Figure 510, the signal corresponding to the SBS copolymer is observable between 10 and 12 minutes of retention time.
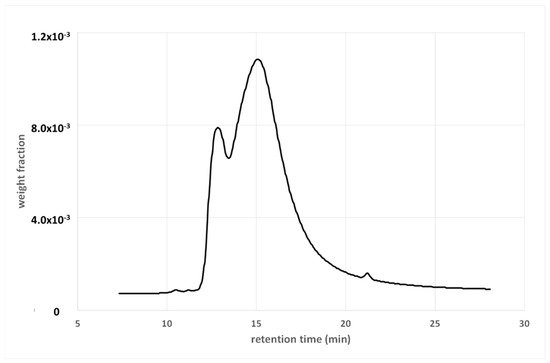
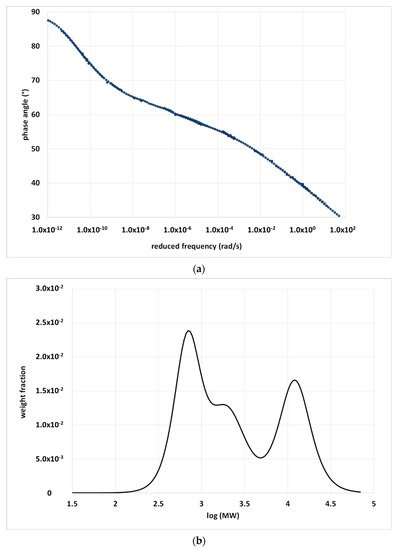
Figure 510. Weight fraction as a function of retention time of a PMB containing 6% SBS. Details on the materials and procedures are given in [21][39].
Another potential cause of uncertainty in SBS-based PMBs derives from the common practice of adding sulfur to improve their storage stability and morphology [22][40]. Sulfur induces a chemical crosslinking of the polymer and the formation of covalent bonds between polymer and bitumen molecules [23][41]. This alters the length of the polymer chains and causes the inclusion of bitumen molecules in the signal attributed to the polymer. Moreover, the crosslinking may lead to insoluble polymer clusters that remain in the prefilter instead of being fed to the GPC column. In contrast, the BMWD of a PMB provides useful information on the binder structure; however, the interpretation of the distribution may not be simple. If the polymer confers its elastomeric properties to the whole material, then it has a large effect on the relaxation time of the bitumen molecules. In the phase-angle master curves of PMBs, the elastic behavior induced by the polymer is manifested as a plateau in the intermediate viscoelastic zone. Before the plateau, at lower frequencies (higher temperatures), the material has a liquid-like behavior. At higher frequencies (lower temperatures), the rigid bituminous matrix tends to prevail in determining the overall mechanical properties, and the behavior shifts to solid-like. The extension of the time–temperature intervals in which these behaviors occur depends on the type of polymer, concentration and use of crosslinker. Because the plateau zone corresponds to low values of the first derivative of the phase angle in the frequency axis, it becomes the separation zone of a bimodal distribution in the molecular weight axis. The longer the plateau zone, the better the separation between the two modes of distribution. Figure 611a,b shows a master curve and the corresponding BMWD. The polymer is revealed by the high-molecular-weight peak, as in the GPC spectra; however, the relative area under this peak is much higher than the polymer content. This is because the polymeric network is swollen and includes bitumen molecules, the mobility of which is reduced, as in a gel [23][41]. The area of the peaks gives a quantification of the effect of the polymer on the overall distribution of the relaxation times and depends on the degree of the interactions between the polymer and bitumen.
Figure 611.
 (
a
) Phase-angle master curve of a PMB containing 5% SBS. (
b
) BMWD obtained from the master curve reported in (
a). Details are given in [16].
). Details are given in [32].
The effect of the bitumen–polymer interactions on the relaxation times is clearly shown when comparing the BMWD distribution of a base bitumen and those of the corresponding PMBs obtained with and without the use of sulfur (Figure 712).
Figure 712. Apparent BMWD for a base bitumen before (●) and after modification with SBS (Δ), or SBS and Sulfur (◊). Image from [24][30].
Without sulfur, the distribution of the PMB has the same range of molecular weights that correspond to the base bitumen, but the shape is very different. The presence of the polymer determines the abovementioned sharp separation between high- and low-molecular-weight zones, as the number of bituminous molecules involved in the network is proportional to the relative area of the second peak. When sulfur is added, the BMWD changes again: the second peak becomes larger and shifts significantly toward higher molecular weights, and the distributions show negative values between the low- and high-MW peaks. A larger area corresponds to a wider portion of the bitumen molecules involved in the polymeric network, which is the compatibilizing effect of sulfur. As a general observation, the more the peak is separated from the remaining part of the distribution, the higher the level of interactions and compatibility between the bitumen and polymer. The shift to the right is probably associated with the phase inversion, which is when the network assumes a sort of continuity and dominates the mechanical behavior. The whole material assumes an elastomeric character with higher relaxation times that reflect the behavior of the polymer. The negative peaks derive from the local minimum in the δ master curve. Although not acceptable from a mathematical perspective, the existence of negative weight fractions underlines a well-defined boundary between the prevalence of bitumen or polymer in determining the macroscopic behavior. Therefore, the negative values should be considered as important information on the material structure, instead of as a simple mathematical artefact. Figure 813 shows the evolution of the BMWD in the PMB subjected to different levels of artificial aging. Again, there is a significant difference between the bulk and solution. The effect of aging on the distributions is different than that observed for the unmodified binder. There is almost no horizontal stretching, and the three peaks behave differently. The first one, which corresponds to a small MW, seems invariant; the second one, the intermediate MW, decreases; the third one, polymer-bond molecules, increases. Although the thermal degradation of the polymer causes chain breaking and weakens the network, the latter is still present, and the oxidative aging increases the number of molecules with reduced mobility.
Figure 813. BMWD of a PMB with 5% SBS before and after prolonged artificial aging (25 and 65 hours of PAV, respectively). All details are given in [16][32].
ScholarVision Creations