Your browser does not fully support modern features. Please upgrade for a smoother experience.
Please note this is a comparison between Version 1 by Muhammad Usman Hadi and Version 3 by Camila Xu.
Non-intrusive load monitoring (NILM), also known as energy disaggregation, tries to decompose aggregated energy consumption data and estimate each appliance’s contribution.
- NILM
- energy disaggregation
- ENSML model
1. Introduction
Artificial Intelligence (AI) is the greatest option for handling big data flows and storage in Internet of Things (IoT) networks [1]. Energy Efficiencies (EE) can provide a slew of benefits to energy customers and providers as a result of IoT demand. In 2011, homes utilised 21.54 percent of total energy consumption in the United States [2]. This solution is meant to minimise energy usage by utilising powerful optimisation algorithms to establish a better resource management system and flatten consumption peaks for each home.
Energy management systems to regulate peak energy demand [3] are examples of new technologies that have been developed to enhance EE. With a population of 67.22 million (2020), increasing the overall efficiency of the electricity grid by boosting EE in residential areas may be crucial [3]. Furthermore, giving precise information on the energy use of consumer appliances will enhance the EE. When considering the disaggregation of load consumption and the increased energy awareness of particular equipment, users can change their consumption behaviour, replace equipment, or install energy management systems to save energy or money [3][4][3,4].
The development of new buildings in cities throughout the world has transformed dwelling arrangements and boosted the demand for end-use appliances with energy conservation and control [5]. Furthermore, the move was accompanied by Smart Meter (SM), which enabled the computation of individual appliance power usage based on the building’s aggregate measurements. The placement of current and voltage sensors at the SM is used to monitor energy usage and identify loads in a load disaggregation system [6]. This framework is far more proficient than the old intensive monitoring systems because it can reduce installation costs. By analysing the energy usage of each major appliance, inefficiencies in energy consumption of large appliances may be identified and eliminated [7]. These apps will provide useful information on the appliances that are being utilised. Figure 1 shows a categorical hierarchy of load disaggregation classes.
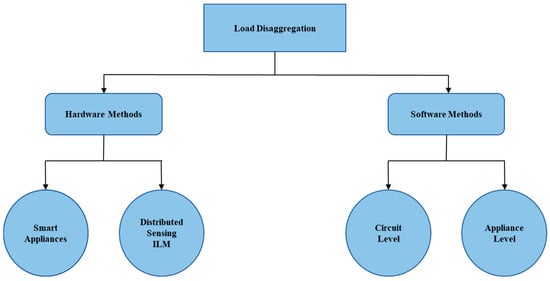

Figure 1. Load disaggregation hierarchy.
Load disaggregation hierarchy.
Load disaggregation is divided into two categories: hardware techniques and software approaches. Hardware-based techniques are simple to create, but they are limited by a number of factors, including implementation cost, reliability, and scalability. As a result, because it uses non-intrusive load monitoring, the software-based solution is preferred. Using a single primary metering point to aggregate load usage and dissect it into individual appliance use has grown common in recent years [8]. The benefits of adopting SM include (i) accurate billing; (ii) detecting defective appliances; and (iii) receiving detailed information on current appliance consumption.
Housing arrangements across the world have changed as a result of increased urbanisation, necessitating the development of high-rise buildings. Changes in dwelling patterns have also resulted in a system for breaking down the building’s aggregate energy use at the appliance level. It is now feasible to estimate an appliance’s energy use based on a building’s overall energy data using smart meters [5].
Hart established a system in the 1950s that disaggregated electrical measurements such that the power consumption of each device could be discovered sequentially by reviewing load data gathered over time [9]. The suggested approach was deemed non-intrusive because no equipment had to be put on the customer’s premises. The aggregated energy usage statistics may be gathered from the building or residence’s main electrical panel. The separation of the total home construction data into its key energy components is a broad objective of this approach. Appliance monitoring may be conducted in two ways: intrusive appliance monitoring (ILM) or non-intrusive appliance monitoring (NIAM). NIAM, also known as Non-Intrusive Load Monitoring (NILM), is a technique for calculating energy disaggregation that may calculate device-specific energy disaggregation based on aggregate measurements gathered at a single site [5]. ILM necessitates the installation of hardware on each appliance, such as sensors and processors, in order to monitor each item independently. Meanwhile, NILM works on software algorithms that examine the resident’s interior appliance functioning state using power data from the service panel.
Non-intrusive load monitoring is a technique for identifying and estimating the energy usage of each electrical item in a facility. It allows a homeowner to break down their home’s energy use into specific appliances, allowing them to be recognised and conserved [10]. The operation of NILM is depicted in Figure 2.
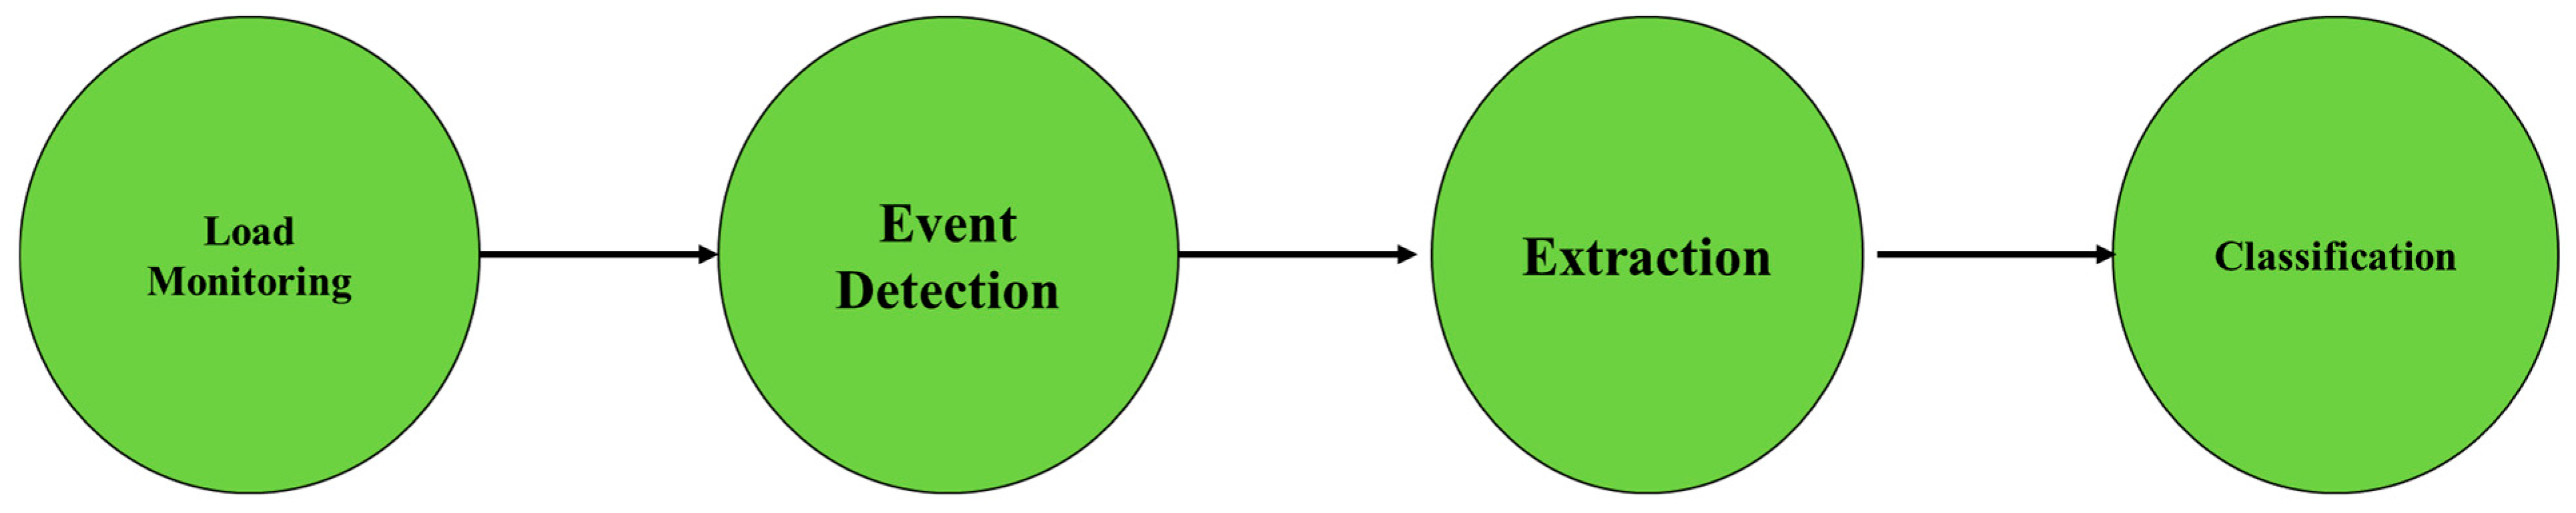
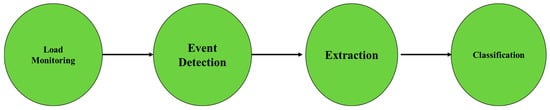
Figure 2. How NILM works.
How NILM works.
Measurement kinds, sample rates, and sensing types are all key aspects to consider while designing NILM algorithm steps. The power on the line(s) of interest is measured first by NILM algorithms. While it is critical to keep an eye on the load on a home’s main bus, it is also crucial to determine whether an incident has happened. Finding an event is difficult since a home’s main bus is made up of several sorts of equipment. The NILM algorithm gathers data from several power signal monitoring systems to evaluate whether an incident has happened. When the proper characteristics are retrieved and matched to the labelled data, the classification process will be able to accurately identify appliances that have generated events.
Because SM is so commonly utilised, the NILM algorithm will be more beneficial to the customer. NILM is a device that analyses variations in the voltage and current entering a home. This approach may be used to detect appliances that are not performing well. The purpose of NILM is to minimise energy use by increasing user awareness. When one sensor is installed in an SM, it reads all of the appliances’ energy use and sends it to the cloud. This installation differs from Intrusive Load Monitoring (ILM), in which each device requires its own sensor. The difference in installation between ILM and NILM is seen in Figure 3.
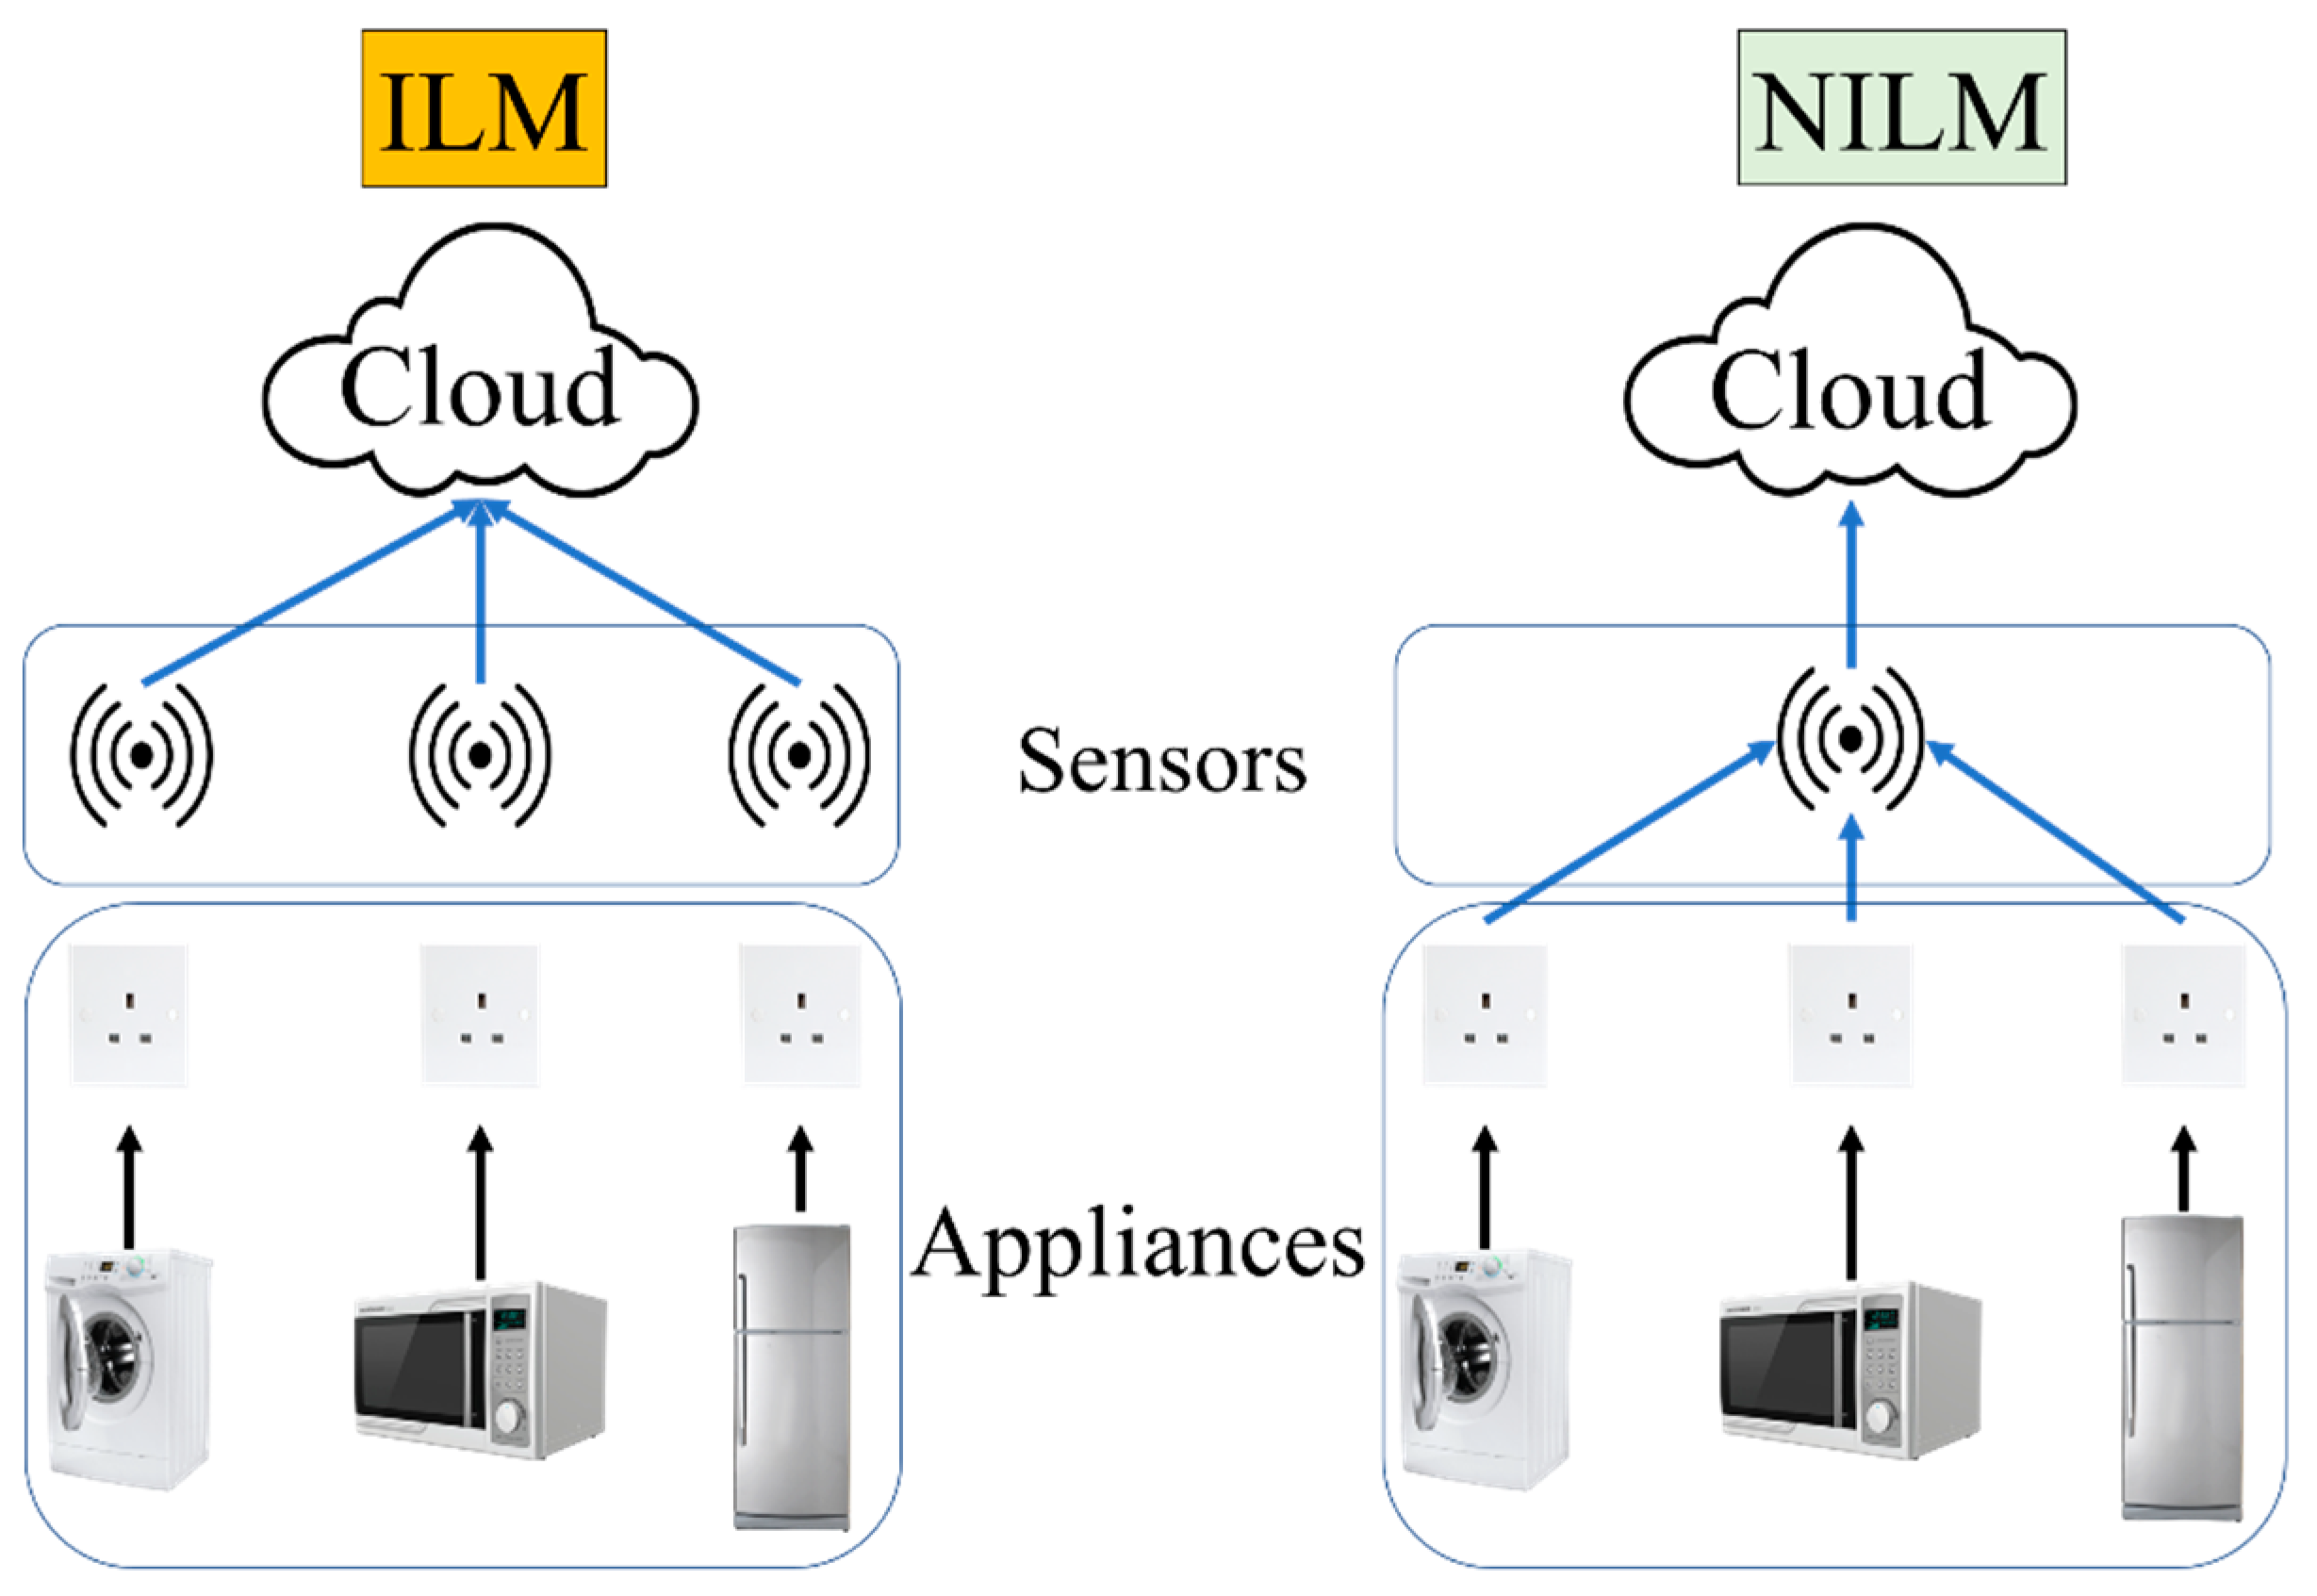
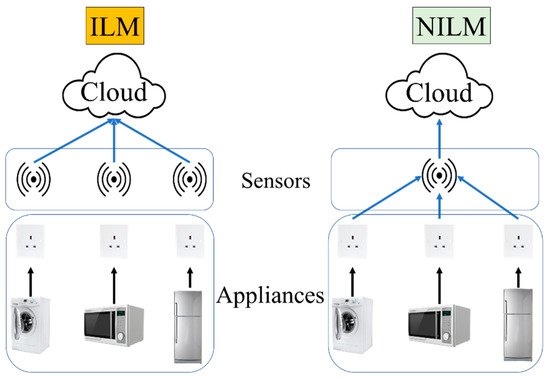
Figure 3. Installation of sensor(s) between ILM and NILM.
Installation of sensor(s) between ILM and NILM.
2. Literature Review of Efficient Supervised Machine Learning Network for Non-Intrusive Load Monitoring
Deep learning in non-intrusive appliance monitoring learning techniques is now classified into three categories: supervised, unsupervised, and semi-supervised learning. Supervised algorithms can either learn from training data or build a model and then guess a new instance based on it. It offers the advantages of being simple to use, quick to calculate, compact to store, and yielding accurate analytical findings. There are, however, some issues. The performance of logistic regression is bad when the geographical features are considerable, for example. There are certain drawbacks, such as under- or over-fitting, and a lack of self-learning capacity.
The unsupervised algorithm is a data-processing approach that classifies samples without using category information by analysing data from multiple samples of the study item. It has a great ability to self-learn, and fresh data may be immediately added to the data set without retraining, but it also has the drawback of low analytical result accuracy. Semi-supervised learning is the most promising learning algorithm branch because it employs a huge quantity of unlabelled data while also using labelled data for pattern recognition. However, there is a scarcity of research on semi-supervised regression issues.
To identify variations in the electrical consumption signal owing to appliance on/off events, early NILM approaches analysed the electricity mains measurement and applied statistical techniques. The active and reactive power signatures were then matched to the right appliance using a best likelihood method, and similar “steady-state” elements of the power signal were grouped together. Certain two-state (on/off) appliances have been identified with good accuracy using such clustering approaches [10][11][10,11]. These methods, on the other hand, have major trouble detecting more complicated appliances with numerous states (e.g., washing machines) and have a tendency to fail in situations when multiple appliances are operating and switching at the same time [12]. Clustering approaches have also been used to uncover household features and trends in electricity use data [13][14][13,14].
Graph signal processing is another contemporary technique to NILM in the literature. Refs. [15][16][15,16] present a low-complexity unsupervised NILM technique based on entropy index limitations competitive agglomeration, a fuzzy clustering algorithm. This approach yielded encouraging results for NILM implementation in practice.
Ref. [17] described a spectrum-smoothing-based load disaggregation strategy for dealing well with many appliances turning on and off at the same time. There have also been proposals for NILM algorithms based on integer programming [18] and mixed-integer linear programming [19].
Since it may provide a considerably less intrusive and lower-cost solution than sub-metering, NILM has been included in a substantial number of mass-market home energy management products and services. Sense [20] employs NILM to discover trends in home energy usage in order to provide users advice on how to make their homes more energy efficient. Smappee [21] focuses on how to use NILM to provide precise feedback and advice on reducing energy and carbon footprints. A NILM device for commercial buildings has been developed by SmartB [22]. A variety of mass-market NILM gadgets are used to identify possible safety hazards when home appliances, such as the oven or iron, are left switched on and/or unattended [23]. Several commercial vendors claim to incorporate machine learning or artificial intelligence in their algorithms in their goods and services [24][25][24,25]. Bidgely et al. [24] has a number of patents in the field of machine learning-based NILM methods. Verv et al. [25] is a home energy management solution that uses high-resolution mains electricity measurements and artificial intelligence methodologies to perform NILM, with the output from the NILM classifier being used to offer advice and suggestions to consumers.
The use of deep learning techniques from other domains, such as image processing, to solve the NILM problem was presented in ref. [12], where preliminary findings revealed that deep learning approaches outperformed other approaches in the literature on unseen residential smart meter data sets. In several fields, such as image classification, automated speech recognition, and machine language translation, deep learning is currently the standard technique [26][27][28][29][30][31][26,27,28,29,30,31]. Deep learning approaches are expected to increase NILM performance, as one of the main challenges in NILM is selecting the most discriminative features to extract from a given household data set. Deep learning approaches can learn which characteristics to extract from a data set automatically and generalise to new and unknown data sets. This enables the creation of an unsupervised solution to the NILM issue, with the least amount of user involvement necessary to set up and train the system.
Early NILM methods relied on statistical approaches to detect variations in the energy usage caused by both on/off appliances and electrical main readings. Based on identical steady-state components of the data, an algorithm matches the real and reactive power signatures of the data with the suitable appliance. The use of such ensemble methods for identifying certain two-state appliances has been found to be extremely accurate [32][33][32,33]. However, the technique has significant problems detecting devices with more intricate state-dependent behavior and in scenarios when many appliances are operating at the same time [34].
Graph signal processing, which was described in ref. [35], is another new technique to NILM. The NILM method [36] presents a flexible and low-complexity entropy index constraint competitive agglomeration technique. The findings of this technique seemed promising for NILM application in the real world. A Cepstrum-based strategy for disaggregation load is described in ref. [37] to manage simultaneous on or off of several appliances. NILM has also been proposed using mixed-integer linear programming [38] and integer programming algorithms [39].
Hidden Markov Models (HMMs) are used to solve energy disaggregation problems [40][41][40,41]. Markovian models have hidden and visible states, with the hidden state being the appliance state. However, such approaches may be suitable for applications involving relatively continuous durations of time between states, such as speech recognition. As a result, energy disaggregation is impeded by the notion that run times might differ dramatically from one run to the next (and hence state durations). In addition, the HMM should include any appliances in the house that are either undesired or practical.
The implementation of machine learning by NILM to forecast what the SM will do based on data acquired from it is discussed in this section. Figure 4 depicts the entire operation of the system. The primary power distribution board has an acquisition circuit that gathers continuous data on current and voltage at the board (number one). The obtained data demonstrates a change in power at stage (2), when the appliance is turned on. The current and voltage behavior at the main distribution board can be used to determine this shift.
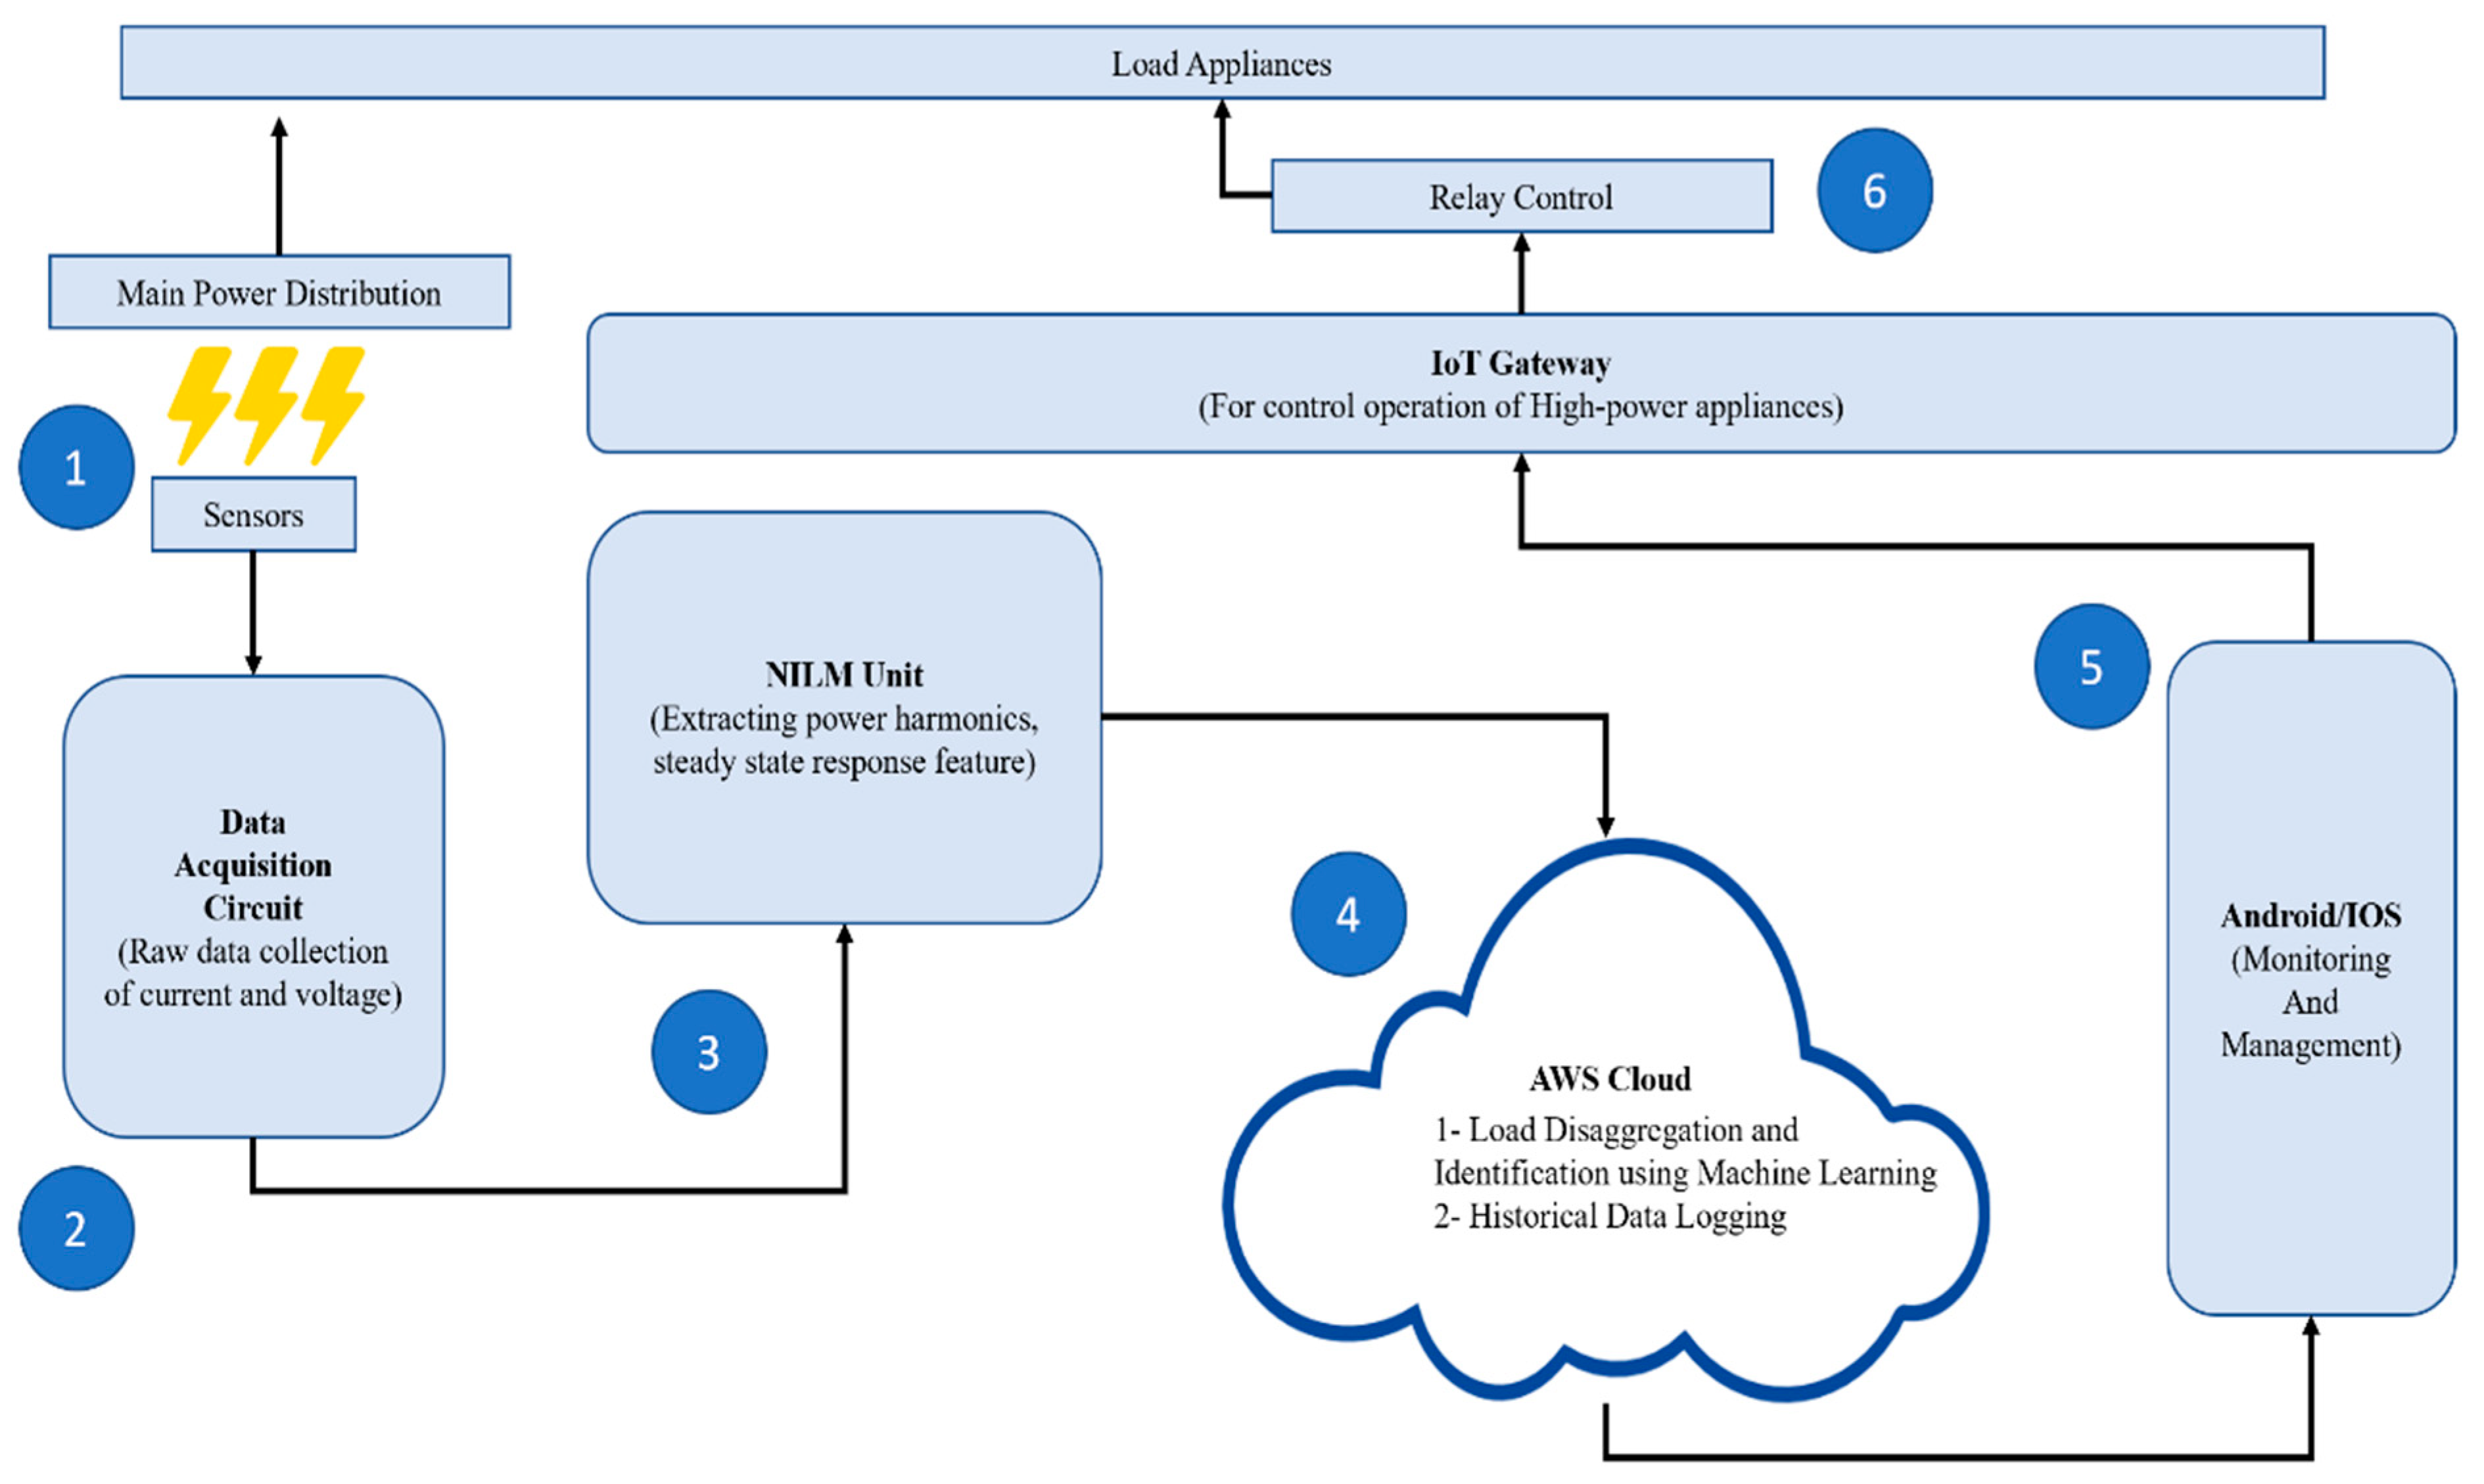
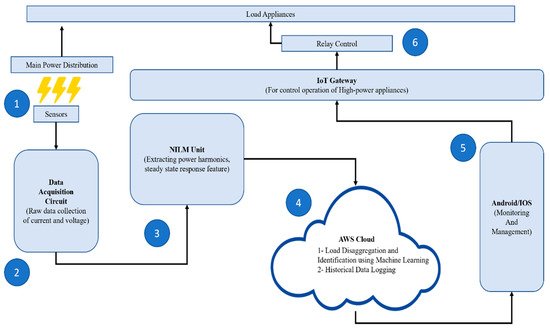
Figure 4. Overall system.
Overall system.
Aggregate data is collected whenever an appliance electrical signature is selected. Electrical signatures are the most important component of a NILM system at stage 3. Because the first form of signature requires a high sampling frequency, most home NILM systems use the steady-state type. The initial step in determining steady states is to recognise stable value sequences in the signal. This rpapesearchr describes an approach for detecting Steady-State signatures using rectangular regions formed by successive data.
This approach enables the identification of a complete steady state from start to finish. The smart energy monitor can identify all monitored equipment using data from the NILM. A time-stamped active aggregate load is provided into the disaggregation process as well as the efficient non-parametric supervised machine learning network model for the household. During the disaggregation time, this method generates a comprehensive report for each appliance or event. This project can anticipate additional houses using only the same data set as the NILM data.
Stage (4) is where all of the data are kept. This is where the appliances from the energy disaggregation are labelled. This will also provide historical data logging, allowing the user to review the appliance’s history when it is turned on or off. When the user is gone at stage (5), this is critical. This is where the appliance utilisation is monitored and managed. While the user is away from home, the user may keep an eye on what is going on at home. This is where the Internet of Things comes into play in the last stage (6). This is where all of the IoT-enabled appliances are installed. The gadgets can be used even while the user is not at home.