Your browser does not fully support modern features. Please upgrade for a smoother experience.
Please note this is a comparison between Version 3 by Catherine Yang and Version 2 by Catherine Yang.
The behaviour of plain carbon, as well as, structural steel is qualitatively different at different regimes of strain rates and temperature when they are subjected to hot-working and impact-loading conditions. Ambient temperature and carbon content are the leading factors governing the deformation behaviour and substructural evolution of these steels.
- plain carbon steel
- structural steels
- dual-phase (DP) steel
- strain rate
1. Low Carbon Steel
Low carbon steel, often termed as mild steel, is the most widely used steel among all the available grades. The pioneering works done on the strain-rate behaviour of low carbon steel are discussed in this section. The true stress–strain behaviour of low carbon ferrite-cementite (FC) steels at different strain rates varying between 3.3 × 10⁻¹ and 5.0 × 10⁻⁴ s−1 and with different ferritic grain sizes from 0.5 to 34 μm was studied by Tsuchida et al. [1]. They showed that, with an increase in the strain rate, the stress (σ), strain (ε), and work-hardening rate were found to be increased for each of the FC steels. The authors further concluded that grain refinement up to 0.8 μm increased the tensile properties and the σ-ε behaviour of the low-carbon FC steels. Figure 1 shows the variation of the σ-ε behaviour with the change in the strain rate.
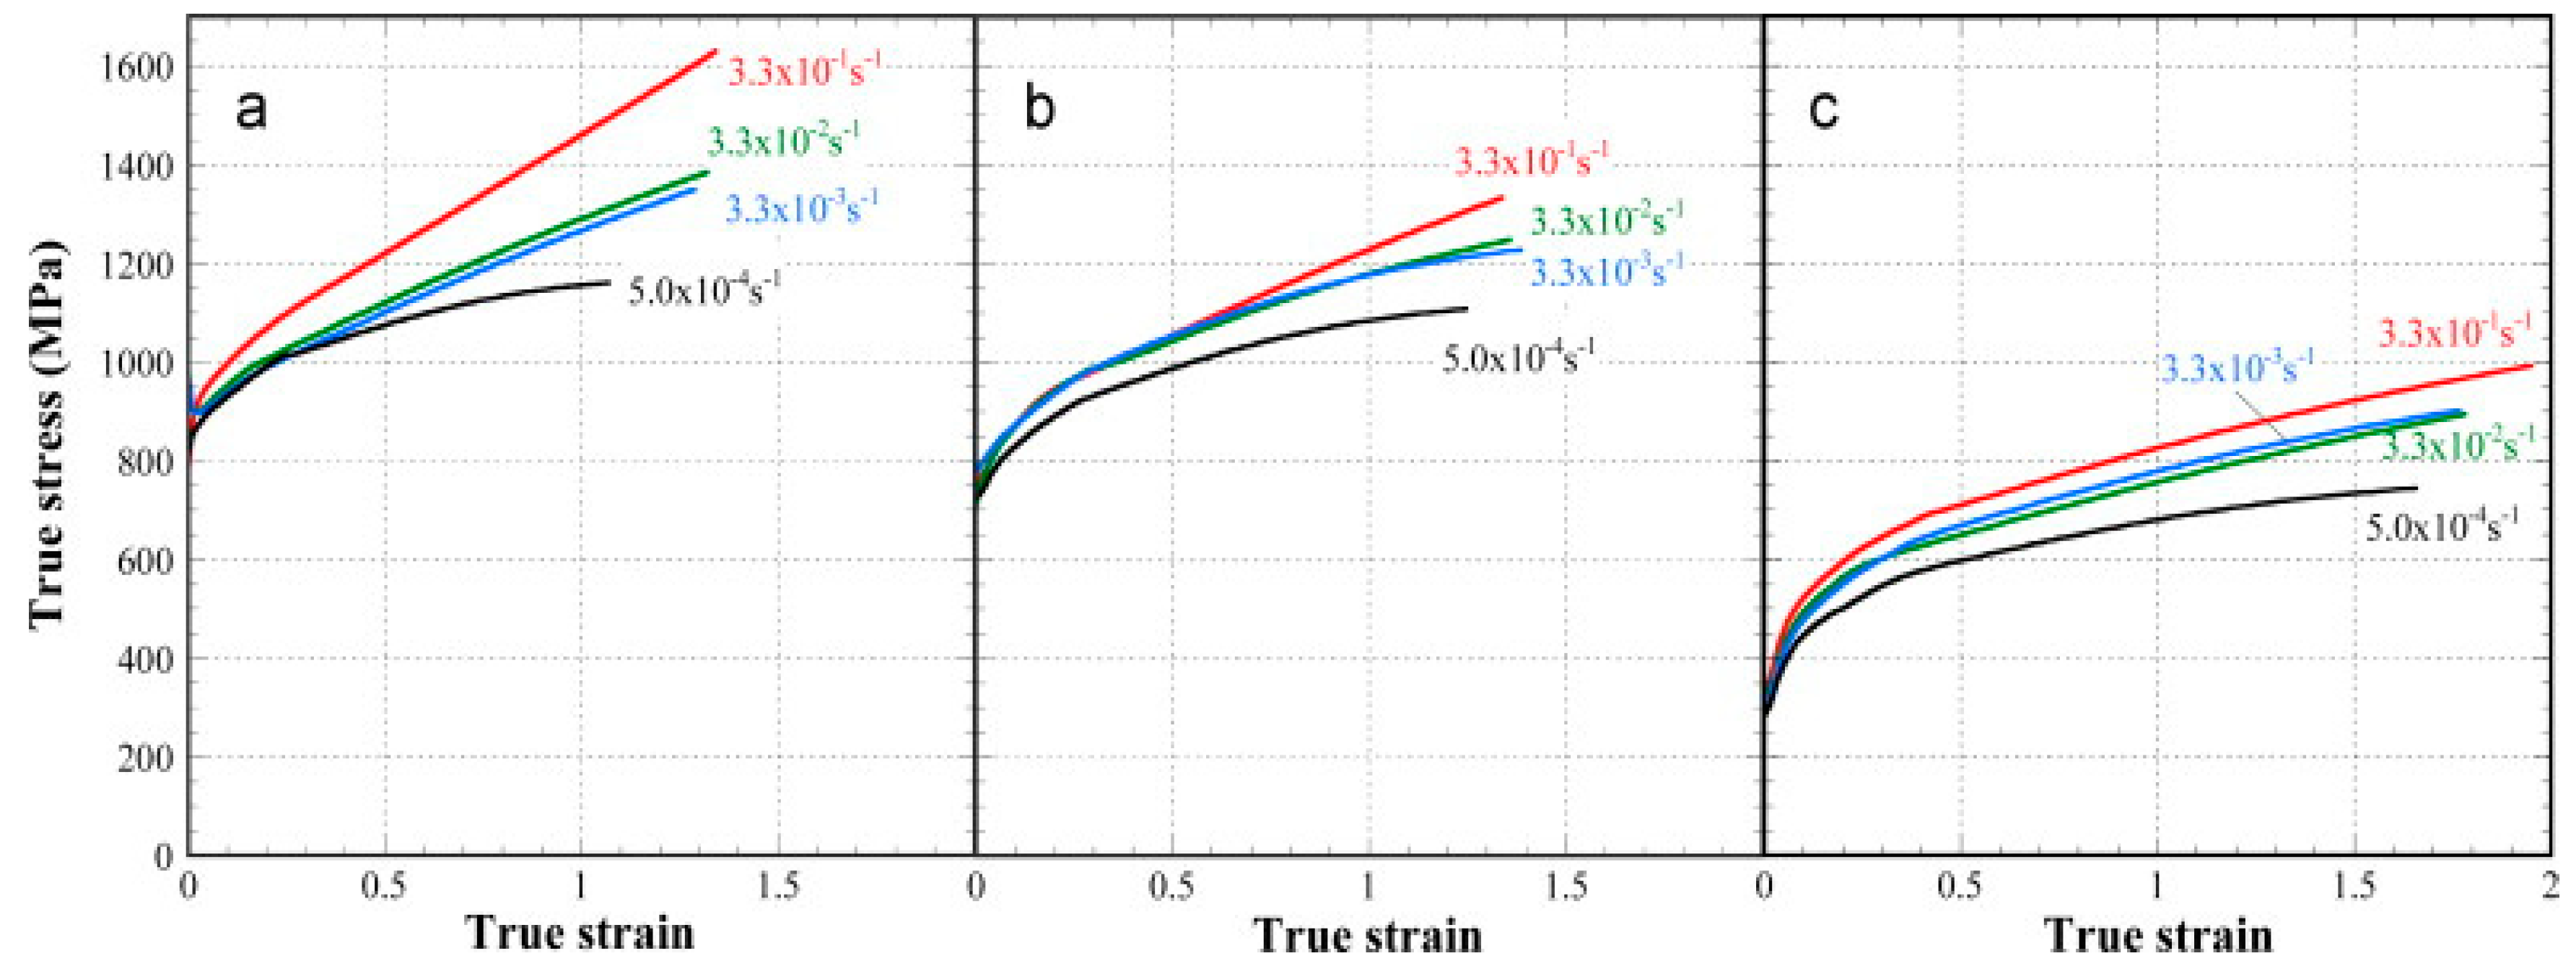
Figure 1. True stress–strain curve of the ferrite-cementite (FC) steels with (a) ferrite grain size of 0.5 μm, (b) ferrite grain size of 0.8 μm, and (c) ferrite grain size of 34 μm at different strain rates [1].
The scanning electron microscope (SEM) images of the FC steel with different grain sizes of ferrite (shown in Figure 2) demonstrated an elongation in the ferrite grains along the tensile direction, and this elongation degree was found to be the same for both the strain rates.
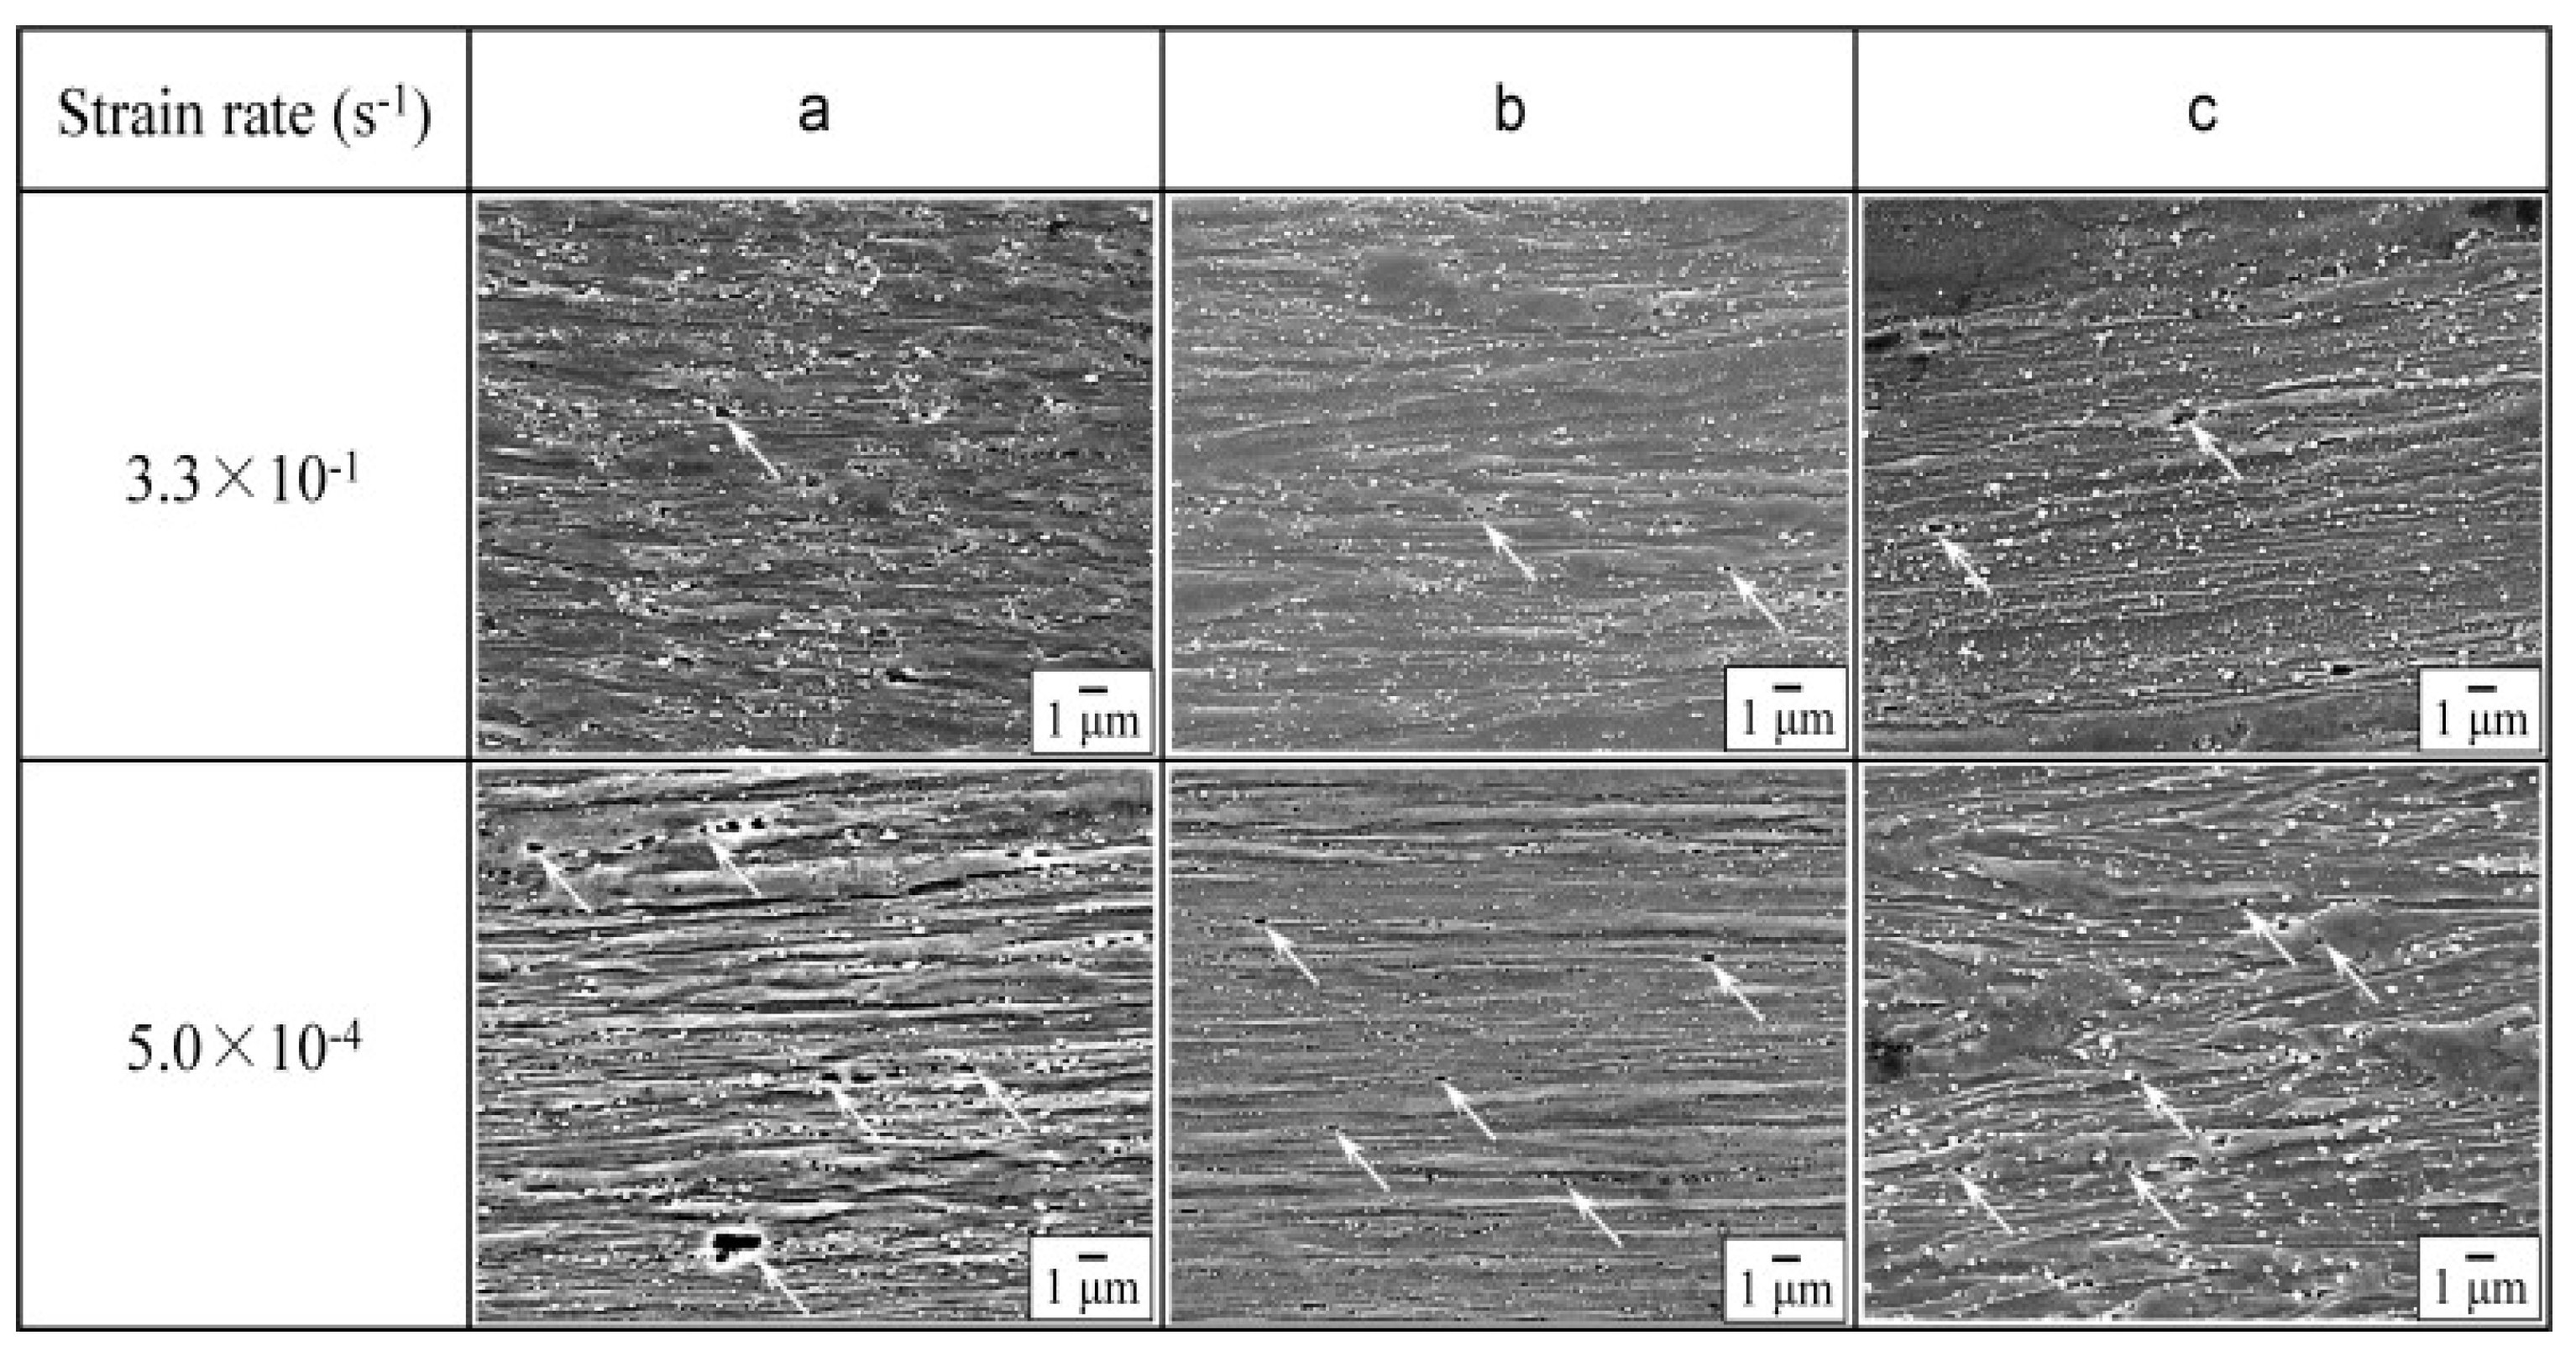
Figure 2. SEM images of the cross-sectional planes of the FC steel beneath the fracture surface at different strain rates of 3.3 × 10⁻¹/s and 5.0 × 10⁻⁴/s respectively [1].
Similar experimental studies were performed by Paul et al. [2] to predict the dynamic flow behaviour of low carbon and ultralow carbon steel at different regimes of strain rates from 0.0007–250 s−1. The authors reported an increase in the yield strength with an increase in the strain rate. However, their studies report that the strain hardening rate was observed to be decreased with an increase in the strain rate, as shown in Figure 3. The strain hardening rate depends on various factors such as the interaction between the dislocations as well as the dislocation density of the material. An overall decrease in the strain-hardening rate thus indicates the dominant role of dislocation annihilation as compared to their multiplication and interaction. The compressive flow behaviour of AISI 1018 low carbon steel at three different strain rates (10−3, 1, and 3.5 × 10³/s) was investigated by Korkolis et al. [3].
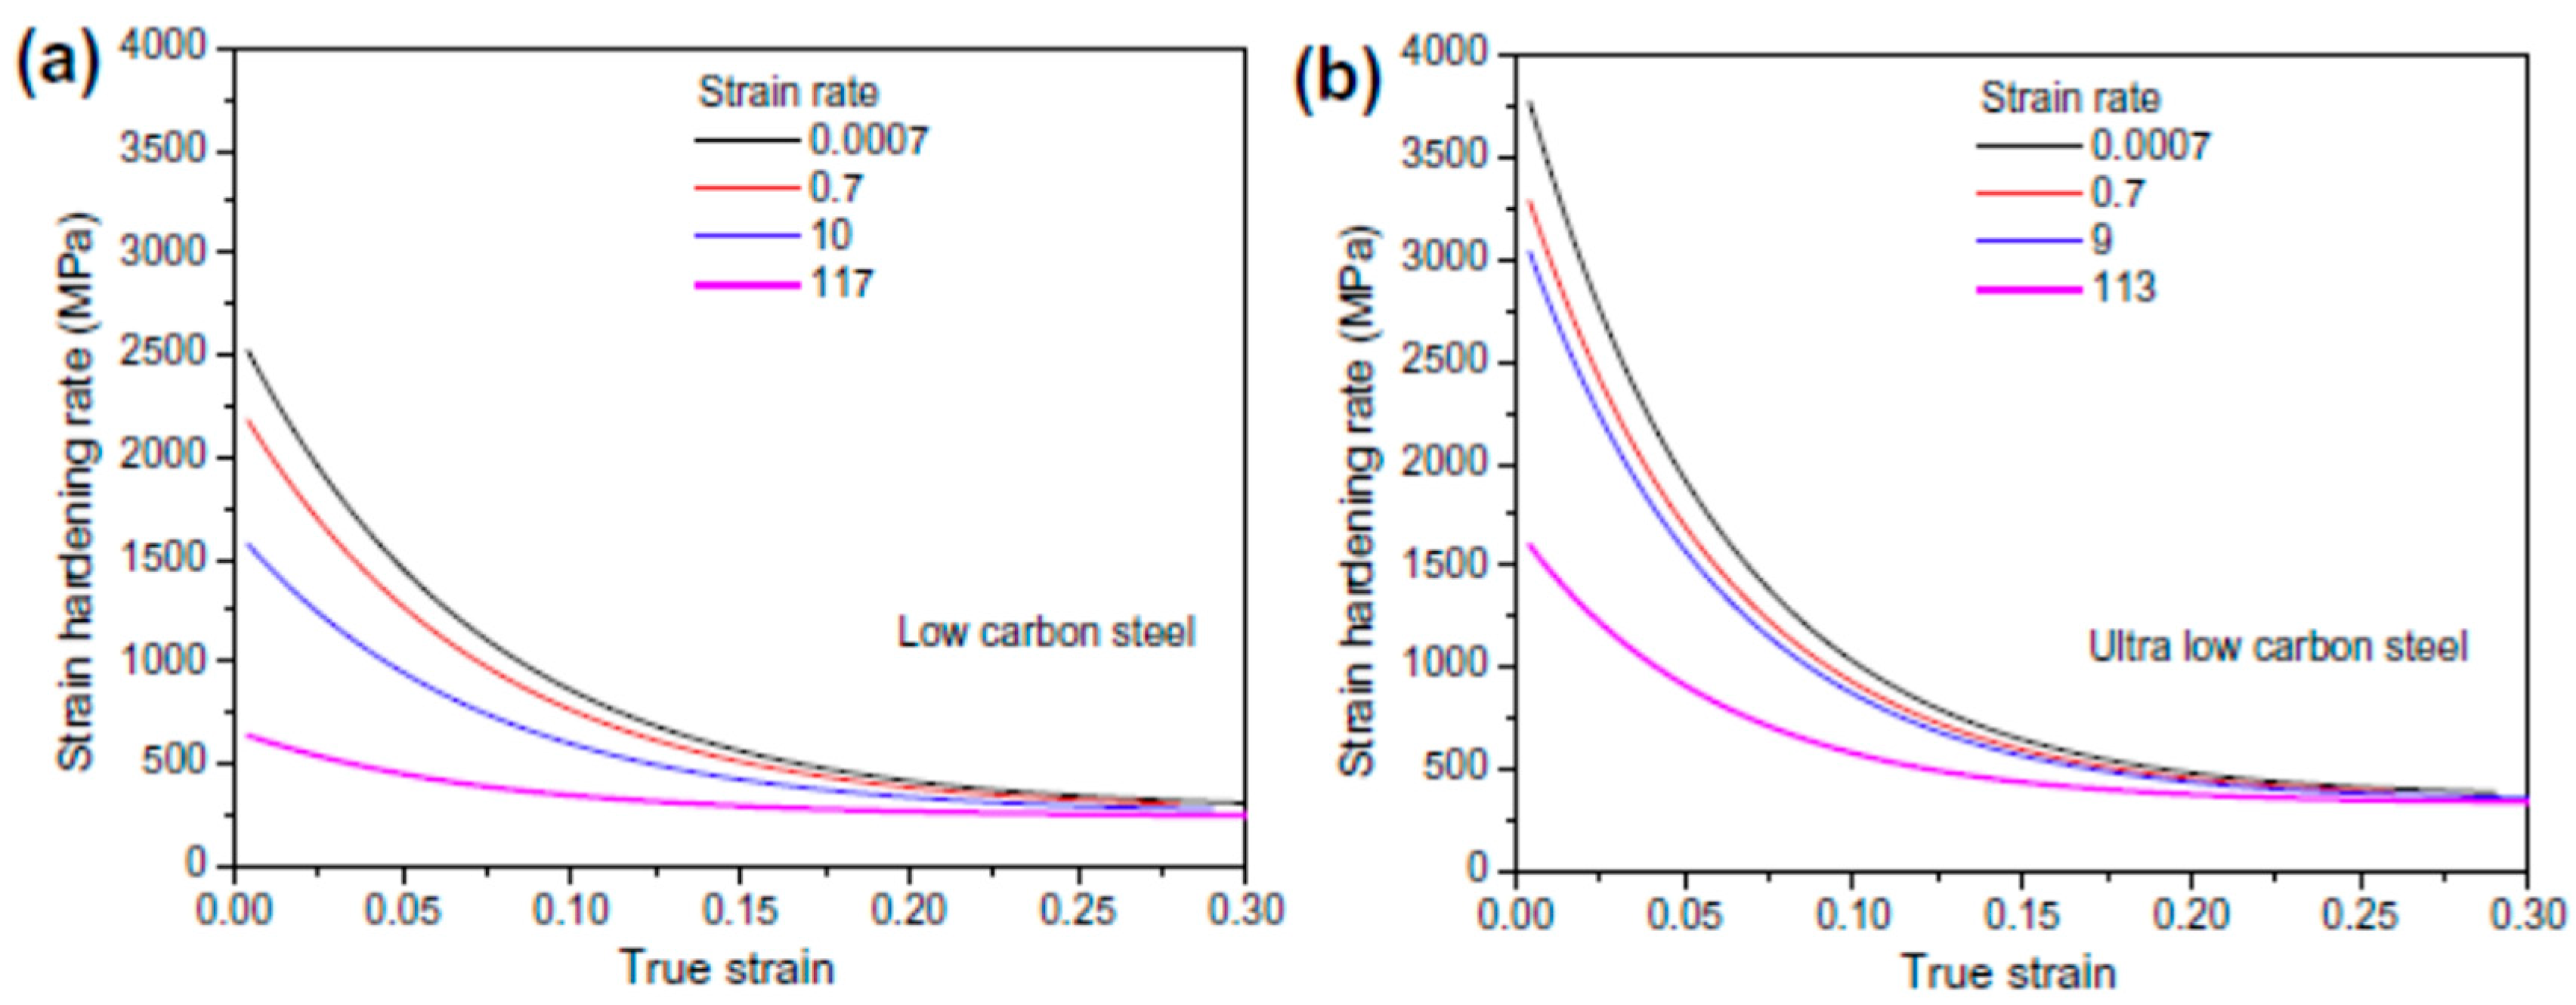
Figure 3. Strain-hardening rate at various strain rates for (a) low carbon steel and (b) ultralow carbon steel [2].
Campbell and Ferguson [4] conducted high strain-rate experiments in the double shear mode to correlate the temperature and rate sensitivity of the mild steel for different ranges of temperature (196 to 713 K) and strain rates (103 to 4 × 10⁴ s−l) and reported an increase in the flow stress with an increase in the strain rate. The authors also reported that, due to the viscous resistance to the motion of dislocation, the rate sensitivity of the steel was found to be varied as a decreasing function of temperature. Similar findings on the strain rate and flow stress relationship were also reported by Klepaczko [5].
The presence of different phases in multiphase steel also alters its dynamic flow behaviour at different regimes of strain rates. For instance, in case of austenite-martensite dual-phase (DP) steels, the deformation-induced austenite to martensitic transformation (DIMT) at different loading conditions plays a significant role in altering the mechanical strength as well as the ductility of the material. Moreover, at elevated temperatures, due to the tempering of martensite, the formation of ferrite and carbides or cementite is also possible, which further alters the flowability and the strain-hardening behaviour of the material. For austenite-ferrite DP steels, thermomechanical control processing (TMCP) is mostly carried out in order to maximize the grain boundary area of austenite per unit volume, which further leads to an increase in the nucleation site density for austenite to ferrite transformation [6][7]. Ok and Park [8] investigated the dynamic deformation behaviour of plain low carbon steel at a strain rate of 0.01 s−1. The authors found three different patterns of flow curves with the change in the temperatures. At a temperature above Ae3 (825 °C), the flow curve showed a peak behaviour, which signifies the fact that dynamic recrystallization of austenite occurred whereas, below the Ae3 temperature, the flow curve exhibited a saturated profile rather than any peaks. With the further decrease in temperature below T0 (780 °C), the flow curve exhibited an increase in the yield strength of the material. The authors further studied the structure–property correlation to understand the micromechanism leading for such changes in the flow curves. They observed that massive ferrites were formed when the deformation of low carbon steel within the 2-phase (γ + α) field took place below T0 whereas, above this temperature, the ferrites were found to be divided into a large number of subgrains by conventional strain-induced transformation. The growth of ferrite grains depending on the deformation temperature is shown in Figure 4. The ferrite in the SEM images appears to be dark. The dynamic transformation of γ → α is also referred to as deformation-induced ferrite transformation (DIFT) and is in general considered as a solid-state transformation. This process results in the formation of ultrafine ferrite grains and thus increases the strength of the material as per the Hall–Petch equation. Similar results were also reported by Chung et al. [9] for different regimes of strain rates. Rizhi et al. [10] observed two distinct processes of microstructural evolution of ferrite during compression of ferrite-austenite low carbon steel. Formation of low-angle grain boundaries was observed at low strain rates (0.0002/s) whereas, at high strain rates (0.2/s), banded substructures were formed. The authors further reported that, at high strain rates, the band structures were transformed to equiaxed grains.
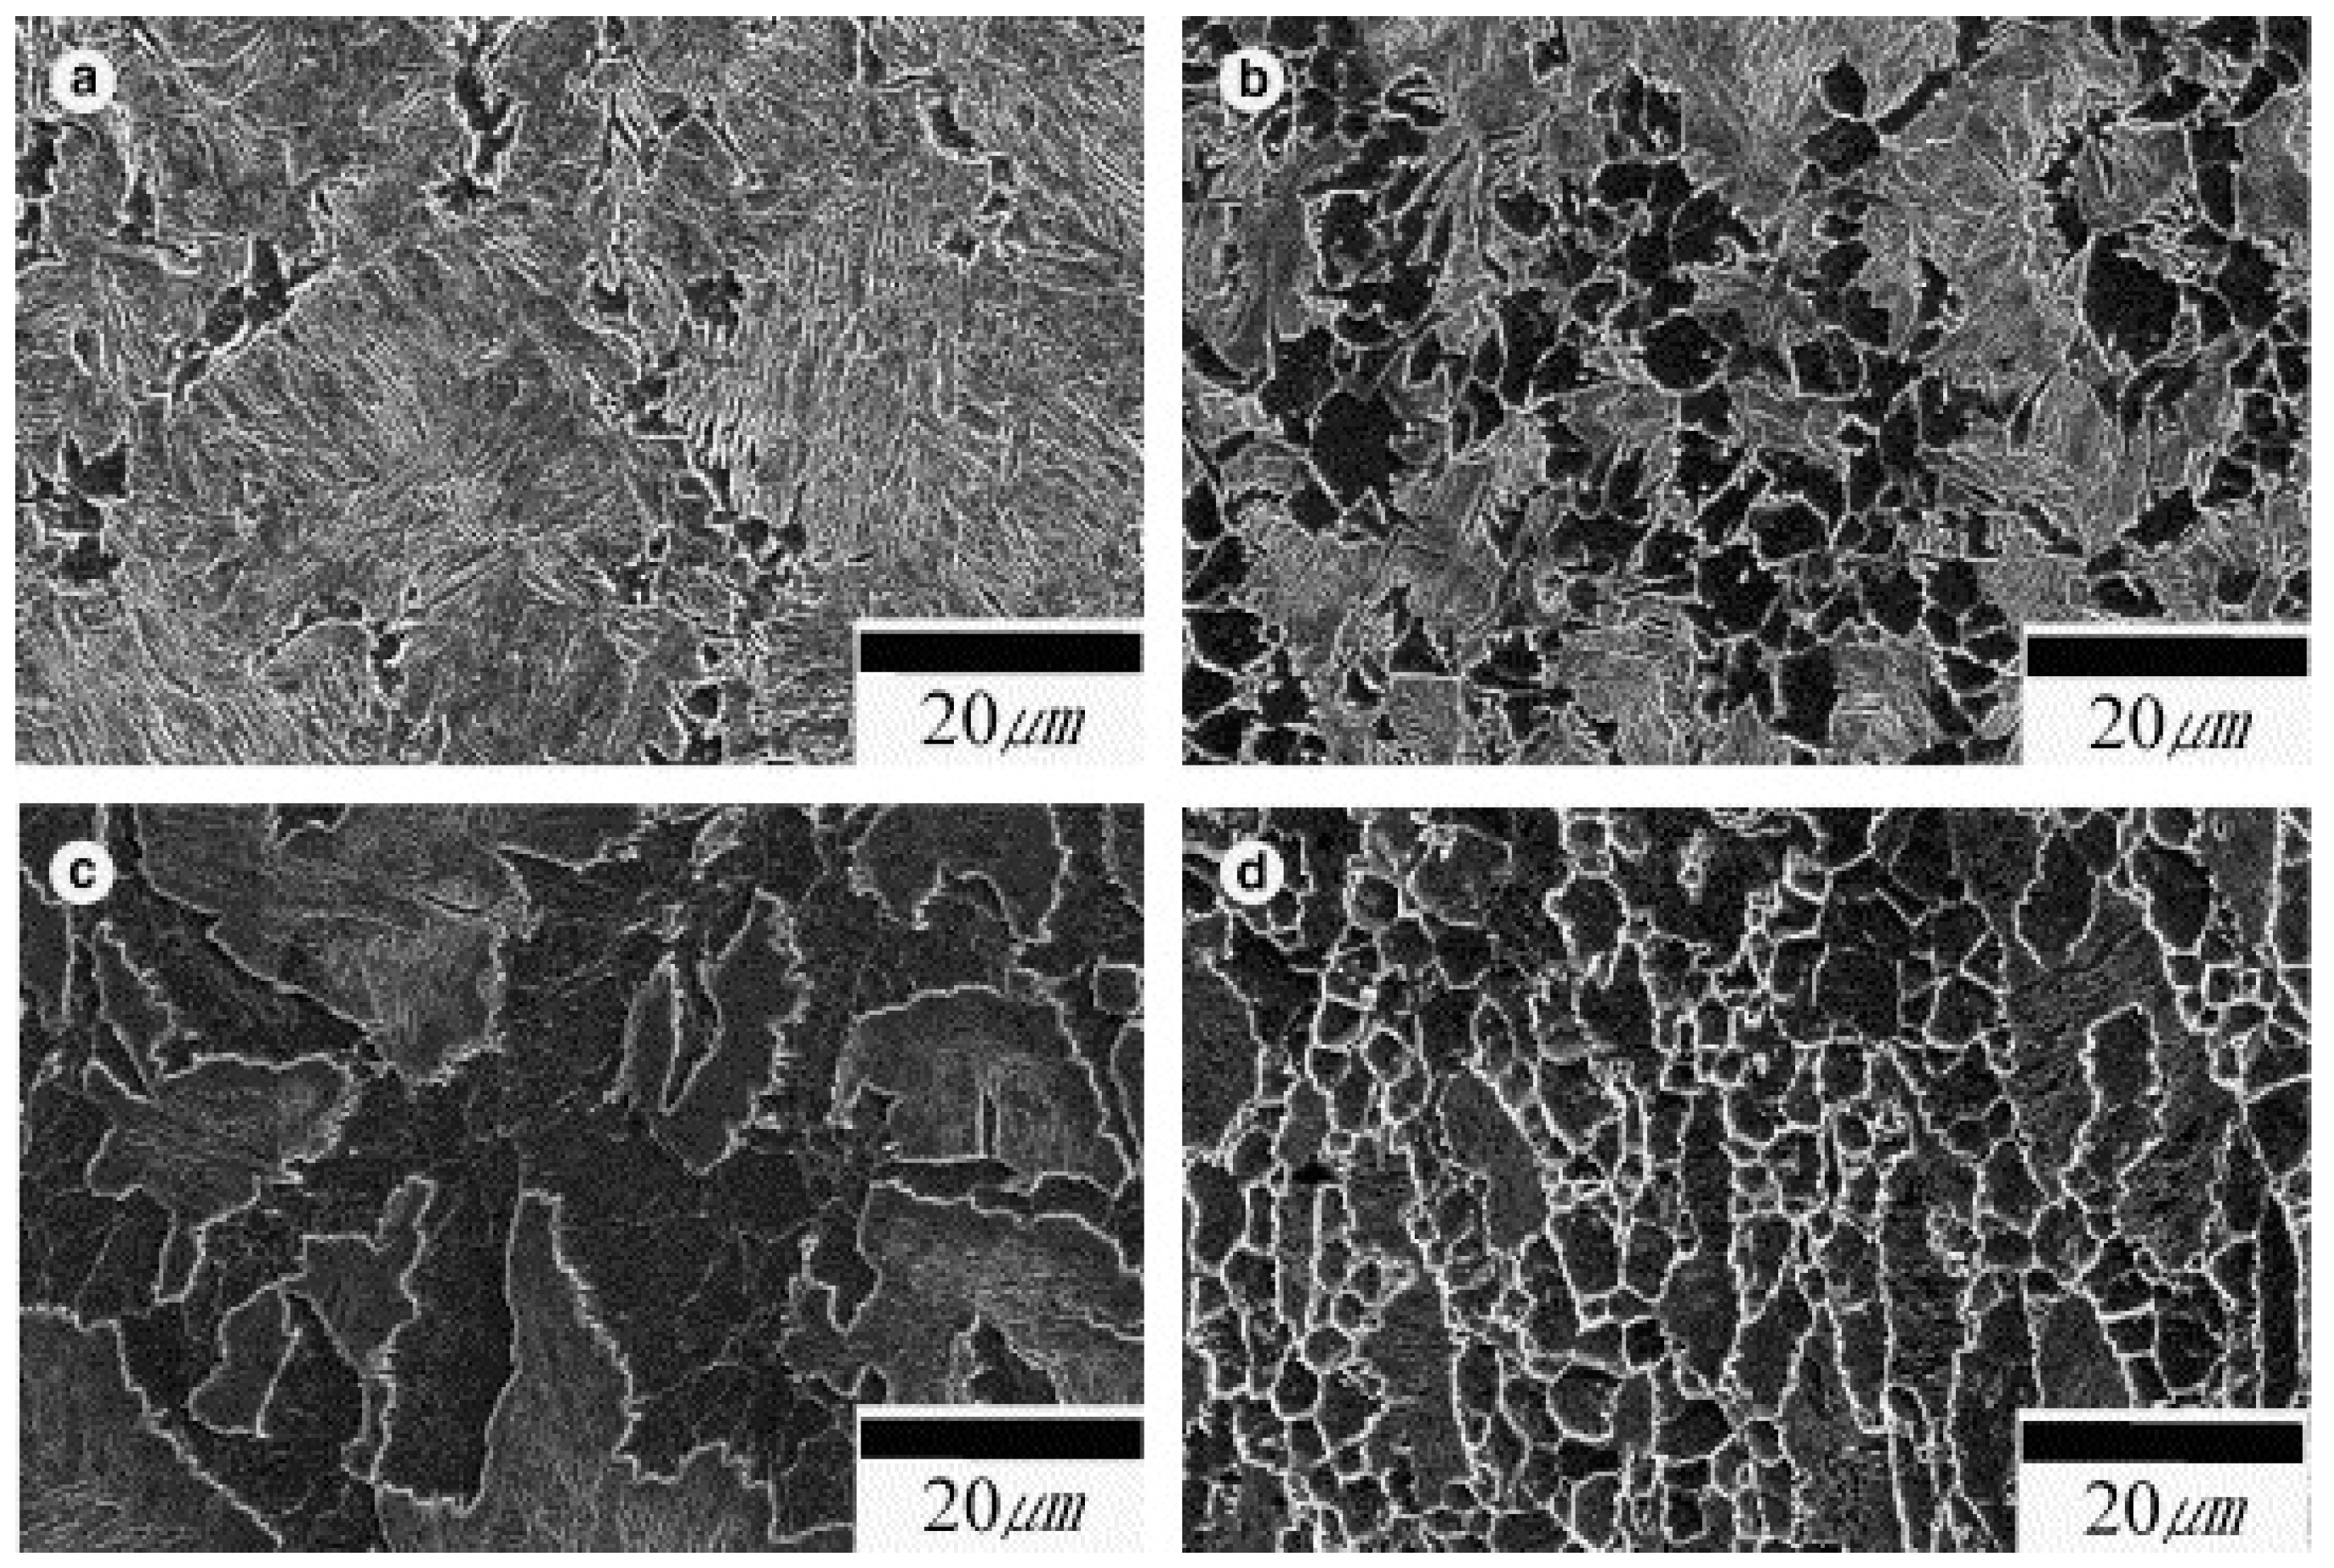
Figure 4. SEM micrographs showing the evolution of ferrite grain structure at (a) 800 °C and ε = 0.5; (b) 800 °C and ε = 0.8; (c) 750 °C and ε = 0.25; and (d) 750 °C and ε = 0.7 [8].
The grain size is considered of significant interest for predicting the deformation behaviour of the steels at different regimes of strain rate. It is fully understood that smaller grain size leads to an increase in the grain boundaries in the metal matrix. These grain boundaries, in turn, provide a restriction to the dislocation movement during plastic deformation and thus lead to an increase in the strength of the material [11][12][13][14]. The Zener Holloman parameter [15][16][17] is mostly used to predict the resulting grain size (Z = ε˙exp(Q/RT)), and the size of the recrystallized ferrite (d) is mathematically expressed in terms of the Z parameter as follows:
where ε˙ is the strain rate, Q is the deformation activation energy, T is the deformation temperature, R is the universal gas constant, and A is a constant. According to this equation, it is expected that the higher Z values would lead to the finer grains and vice versa [18]. Many researchers have shown the variation of the grain size with the Z parameter at different strain rates [19][20][21]. Murty et al. [19] studied the deformation behaviour of coarse grain ultralow carbon steel by performing experiments at nominal strain rates of 1 and 0.01 s−1 and reported that the ferrite grain size (d) and the Z parameter satisfy Equation (1) with a constant value of A being 300. Based on this correlation, the authors established the fact that diffusion along the grain boundaries was the major rate-controlling mechanism for the ferrite grain growth in such materials when processed through large strain and high Z deformation. Figure 5A shows the boundary maps, whereas Figure 5B shows the crystallographic orientation distribution of the deformed specimen for a nominal strain rate of 1 s−1 at different regimes of temperature.
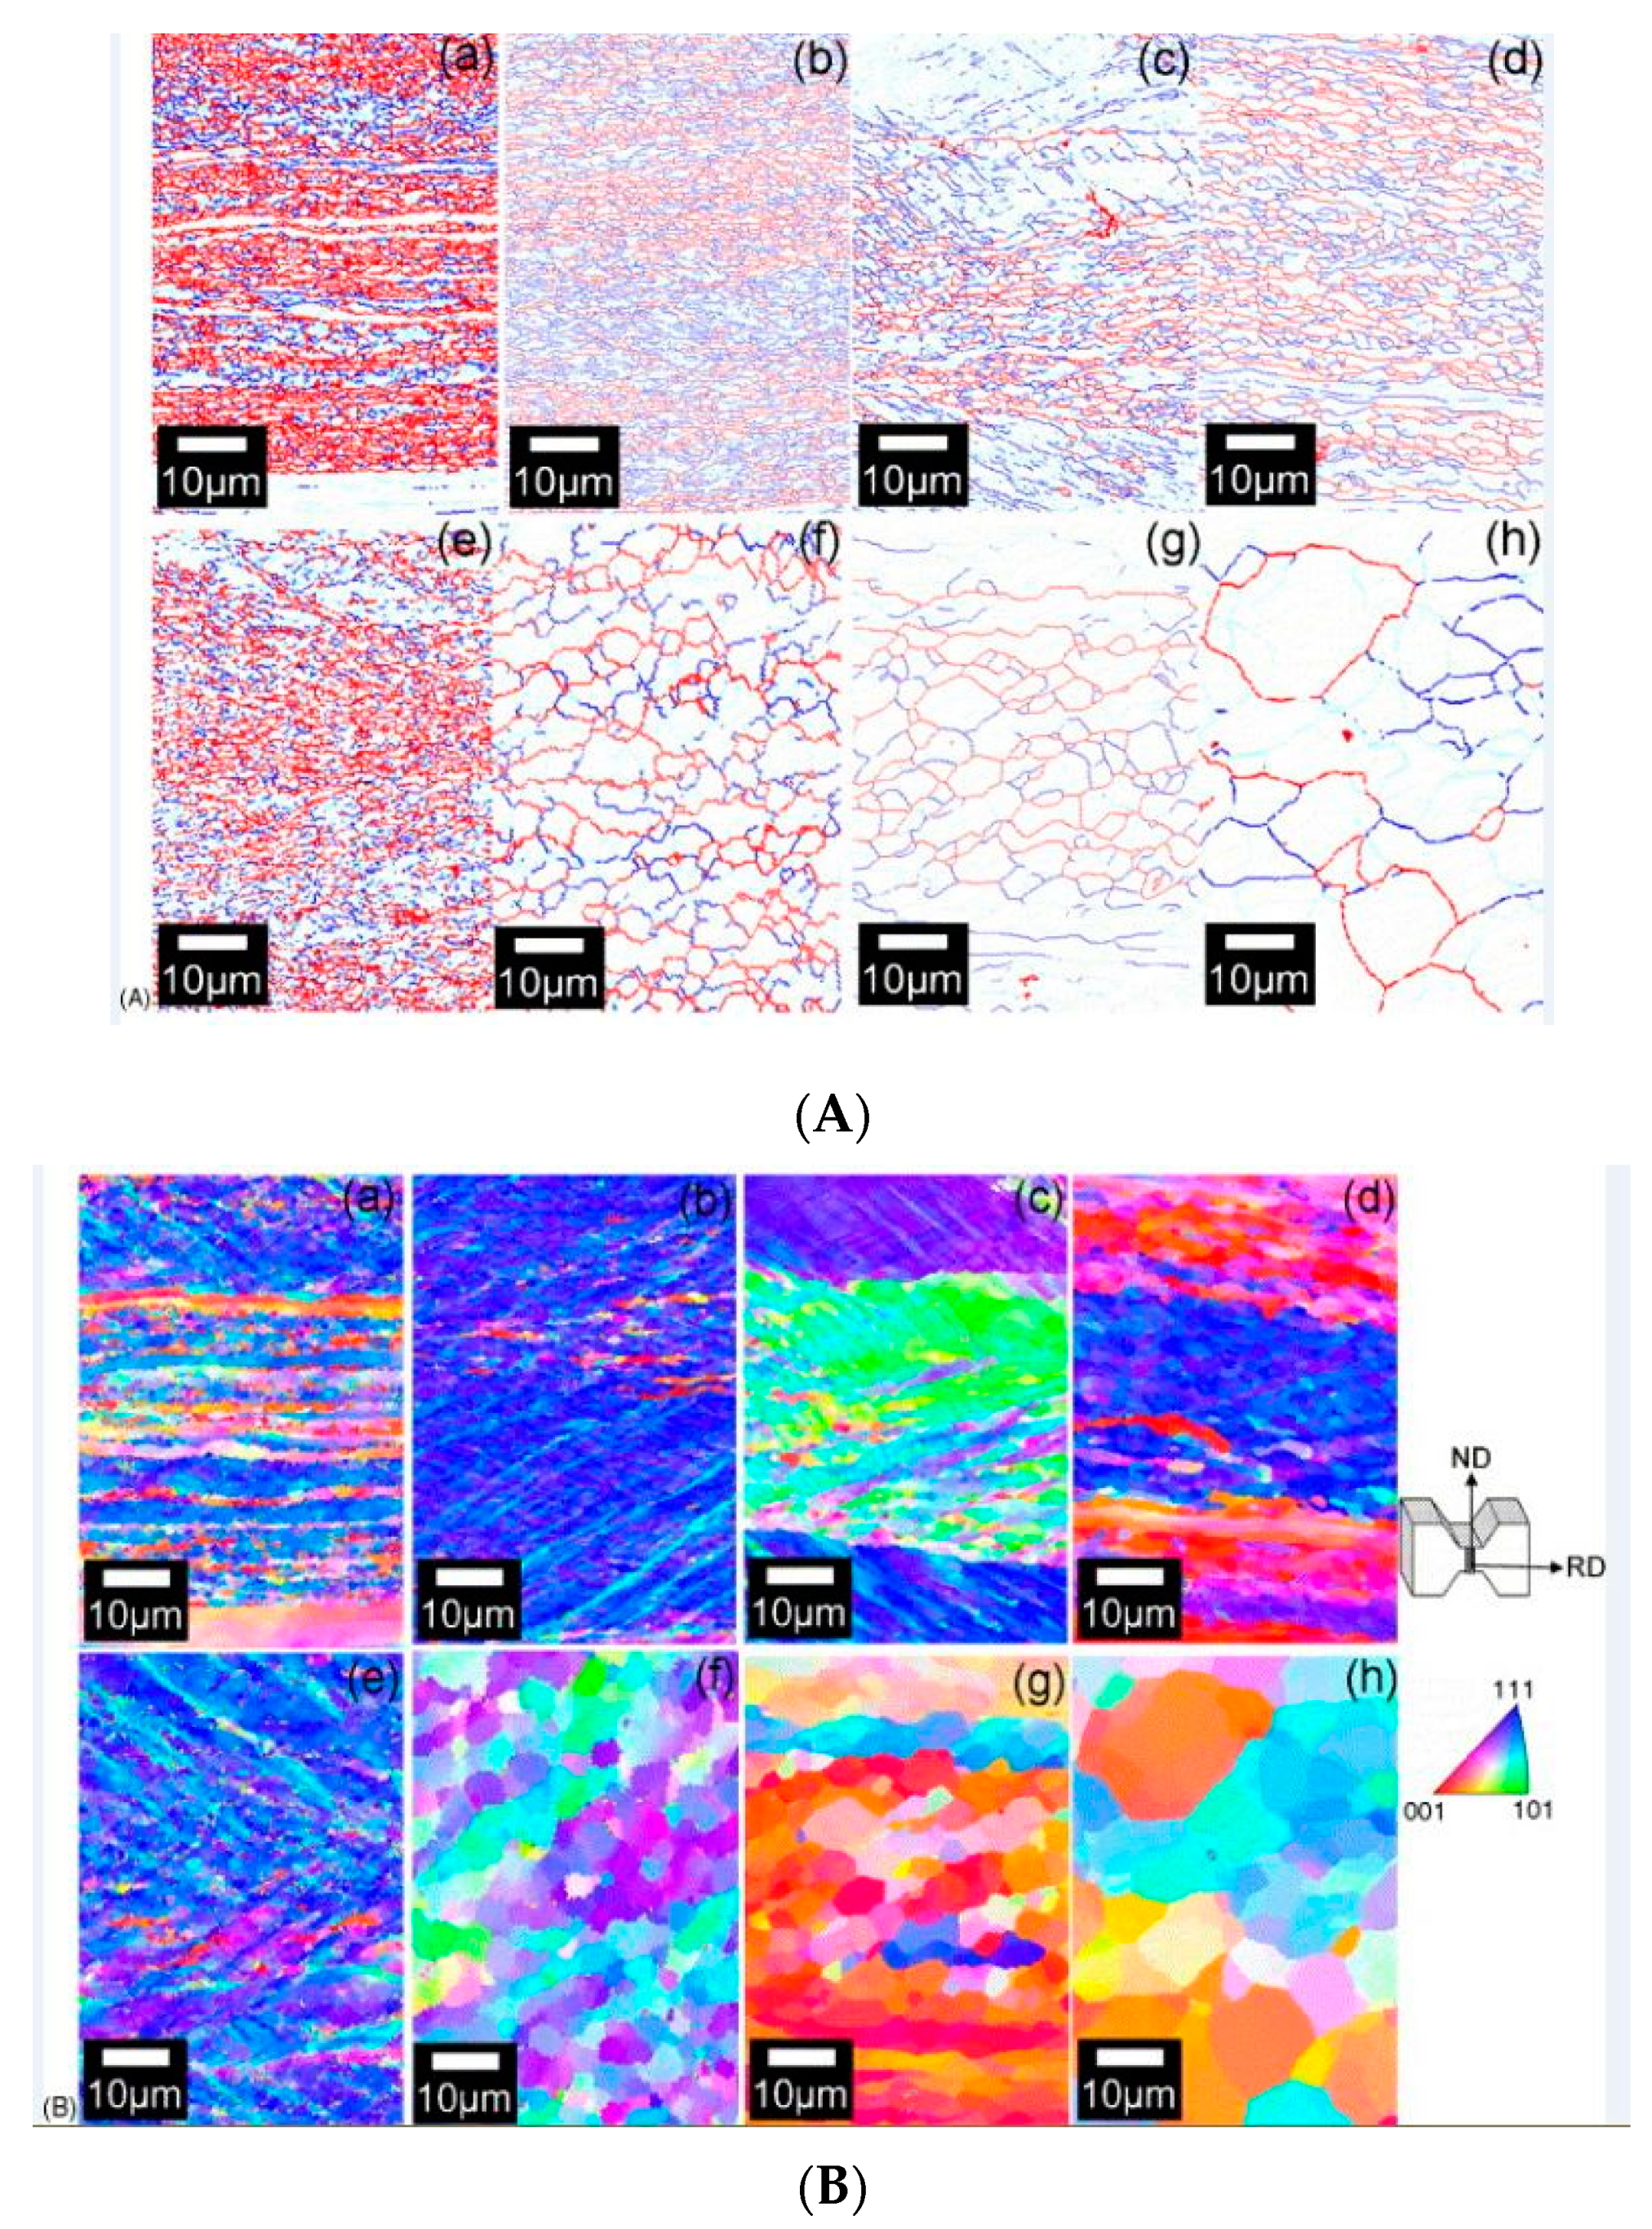
Figure 5. (A) Boundary maps of the specimens deformed at a strain rate of 1 s−1 at (a) 823 K, (b) 873 K, (c) 923 K, (d) 973 K, (e) 773 K, (f) 873 K, (g) 923 K, and (h) 1023 K observed at a strain of 4 [19]. (B) Crystallographic orientation distribution of local regions along the normal direction (ND) obtained by electron backscatter diffraction (EBSD) for specimens deformed at a strain rate of 1 s−1 (top) at (a) 823 K, (b) 873 K, (c) 923 K, (d) 973 K, (e) 773 K, (f) 873 K, (g) 923 K, and (h) 1023 K observed at a strain of 4 [19].
The orientation maps of the specimens deformed at different strain rates and the variation of grain size with the Z parameter are shown in Figure 6.
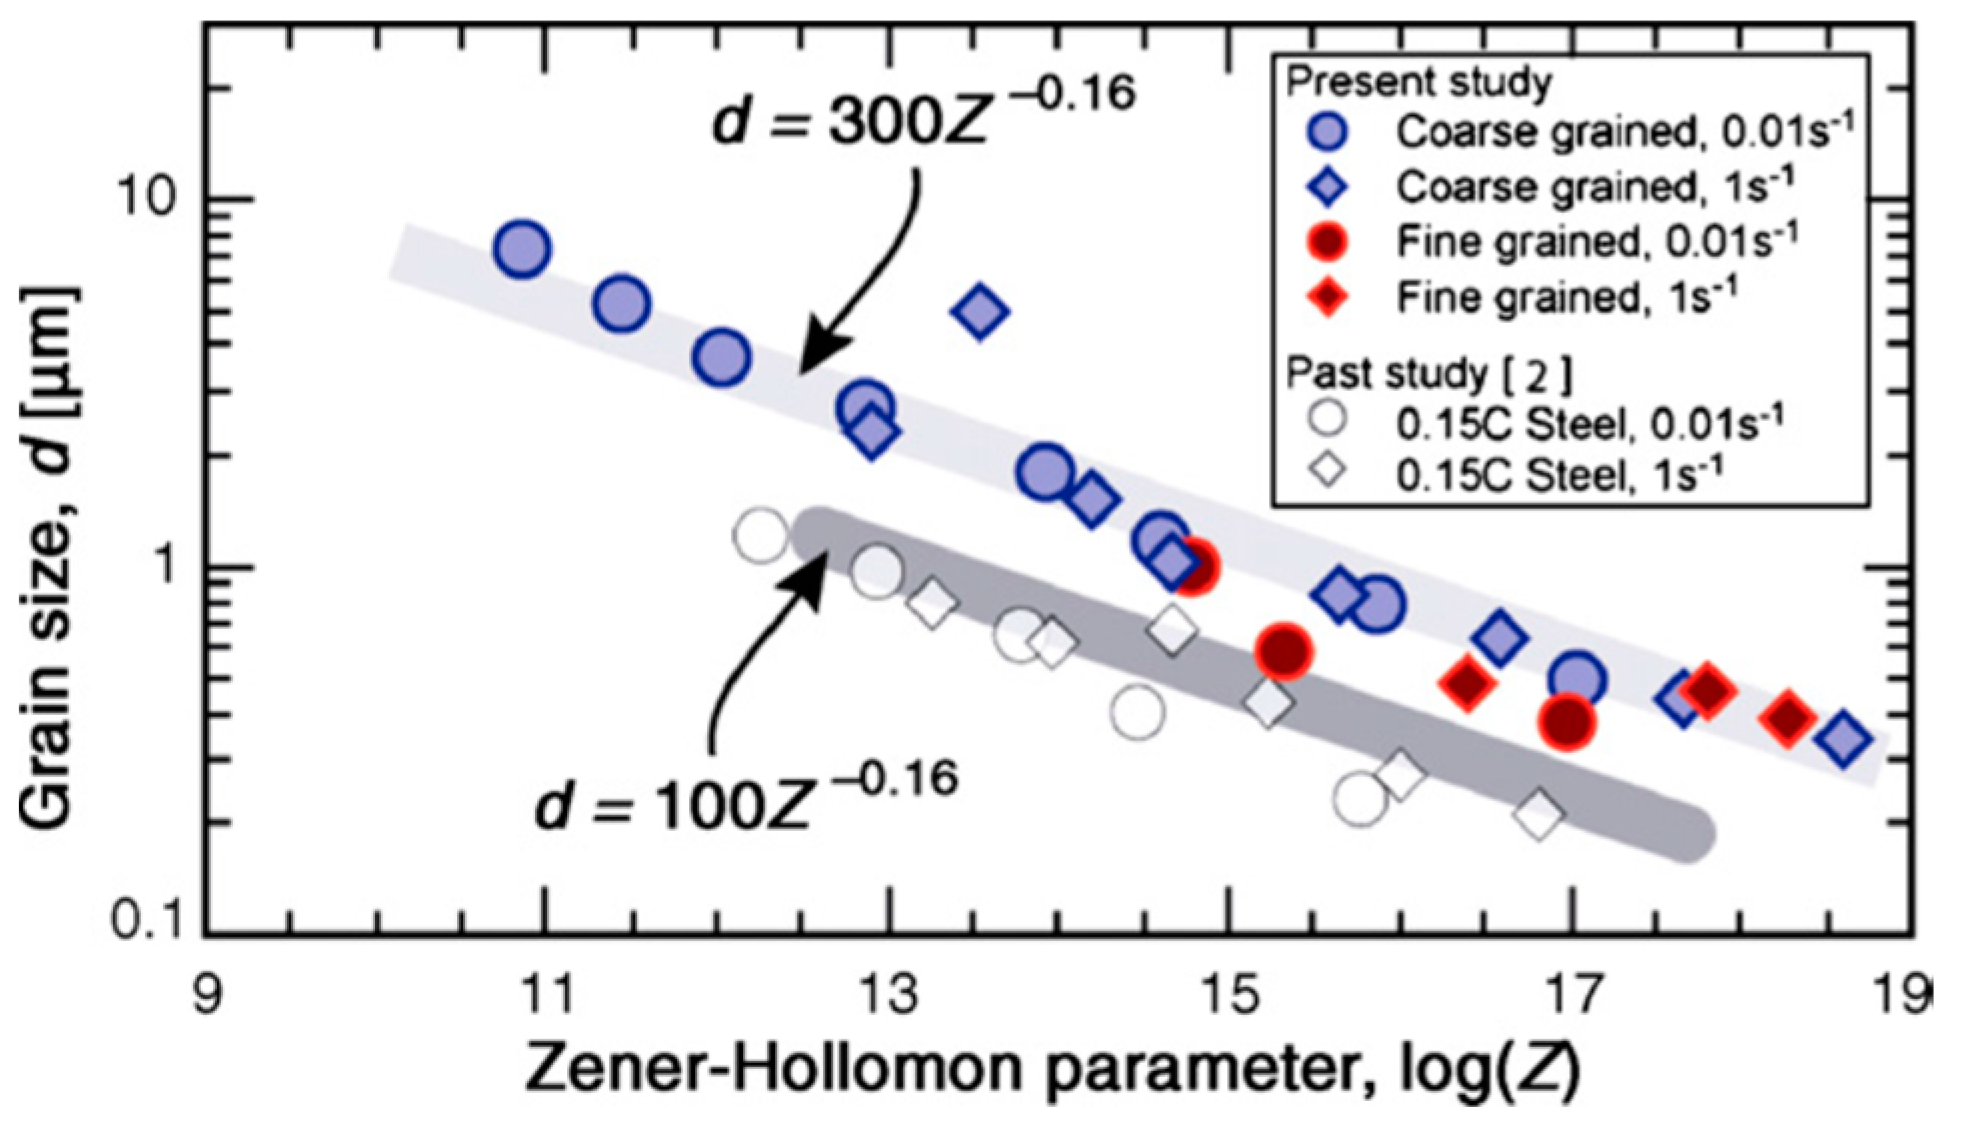
Figure 6. Variation of the grain size with Z parameter at a strain of 4 obtained from boundary maps: The grain size data of 0.15 C steel is also plotted for comparison [19].
Murthy et al. [19] performed similar studies and conducted plain strain-compression tests at different strain rates of 0.01 as well as 1 s−1 and temperature range of 773–923 K to understand the formation of ultrafine grains. They constructed a processing map and attributed grain subdivision with dynamic recovery for high Z parameter and grain subdivision with dynamic recrystallization at the low value of the Z to be the major reason for ultrafine grain formation. The thickness of the ferrite grains at a given strain rate was predicted by the following:
where THα is the thickness of the ferrite grain after deformation, dα is the initial ferrite grain size, and ε is the compressive strain applied. In another study on ultralow carbon steel [20], the authors confirmed the occurrence of dynamic recrystallization in ferritic iron deformed at different strain rates with the help of Transmission Electron Microscopy (TEM) studies. Figure 7 shows the transmission electron microscope (TEM) images of the specimen deformed at 1 and 0.01/s strain rates where CA denotes the compressive axis.
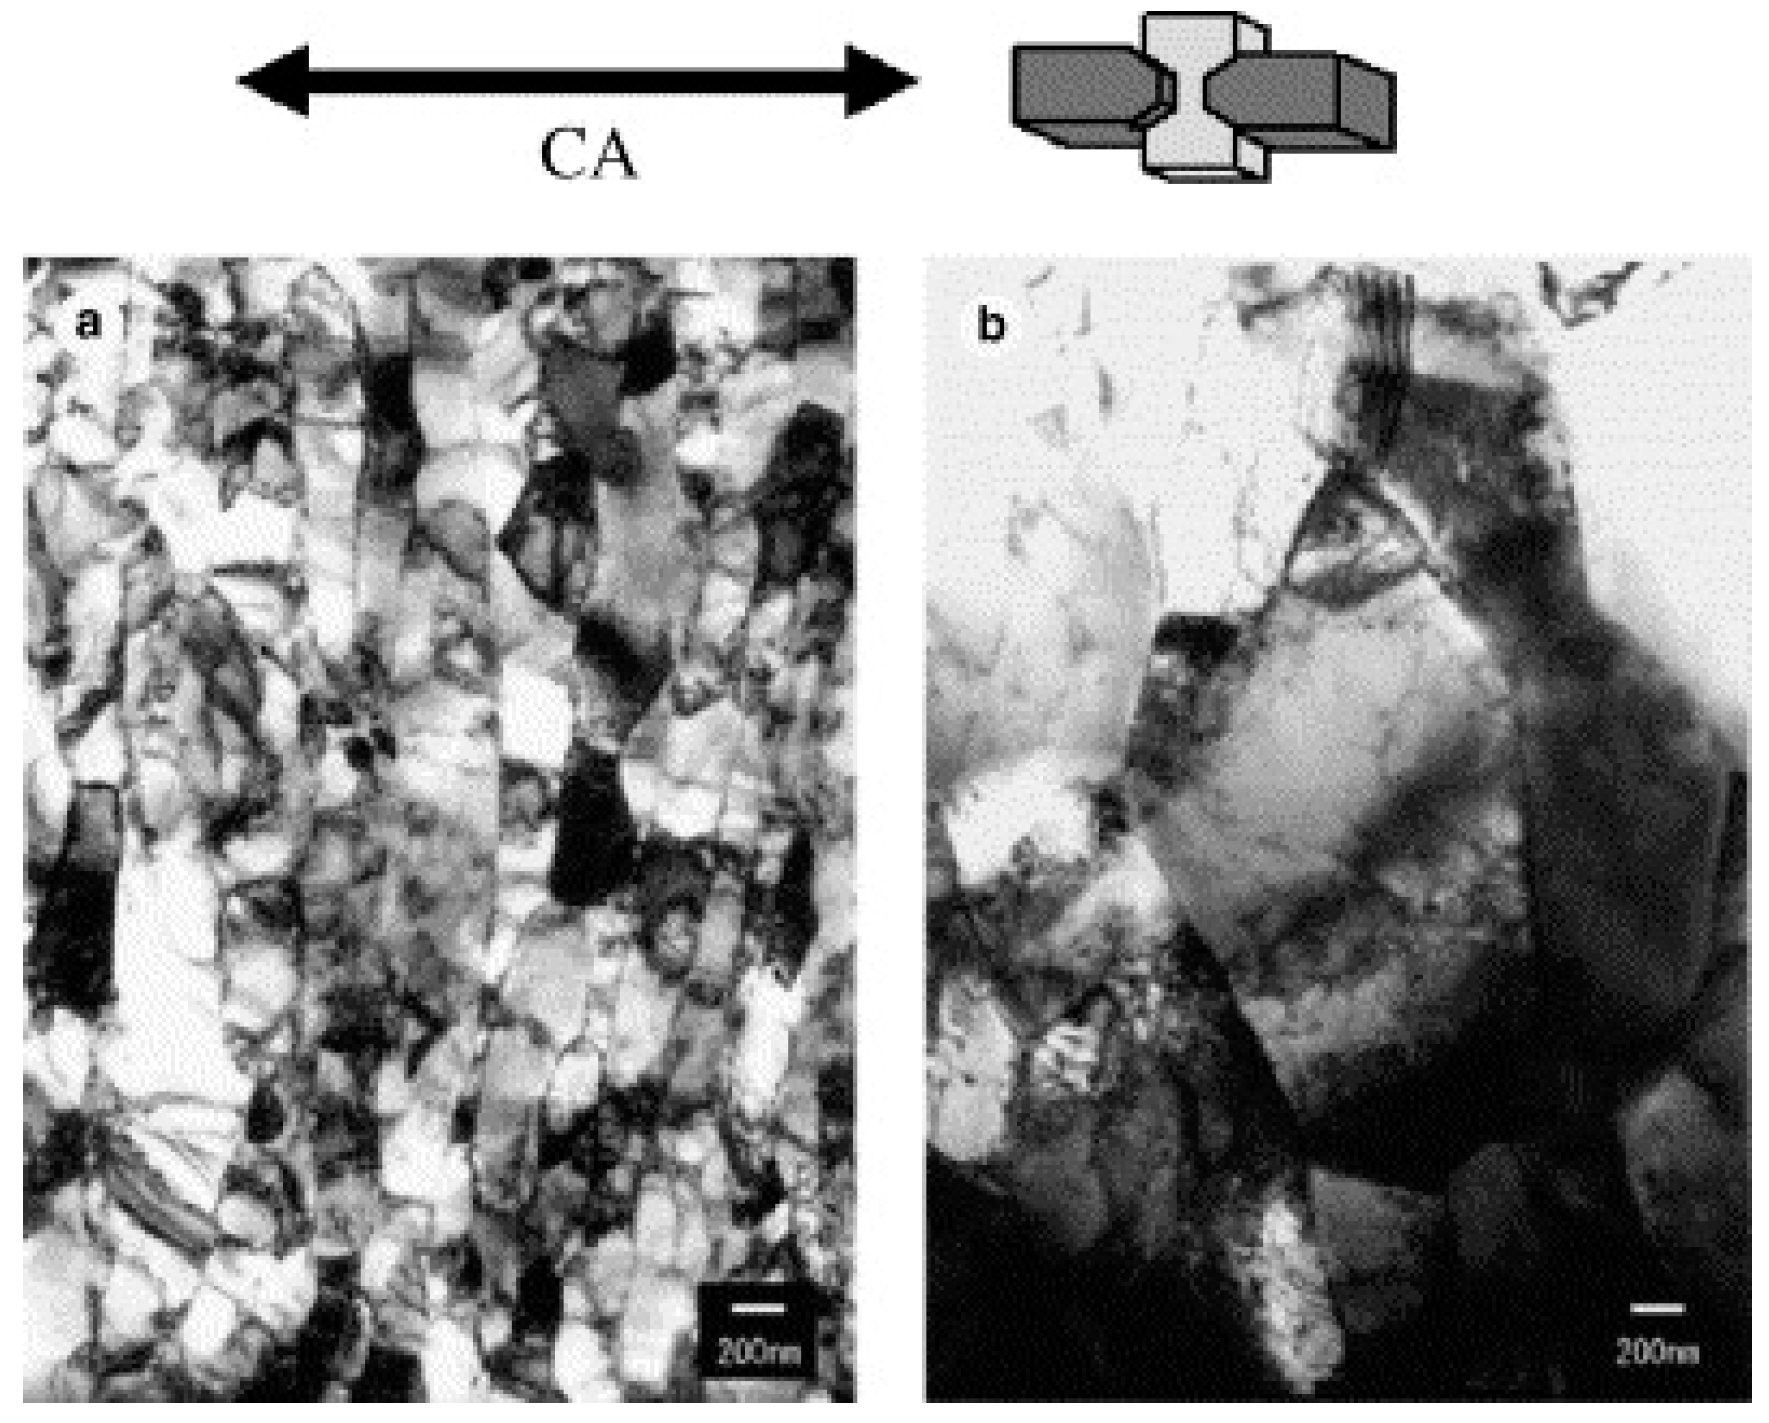
Figure 7. TEM images of the specimen deformed at 823 K at (a) 1 s−1 and (b) 0.01 s−1 [20].
Rajput et al. [22] studied the hot-deformation behaviour of AISI 1010 steel at different regimes of strain rates (0.01–20 s−1) and temperature ranging from 750–1050 °C. They correlate the variation in flow stress with the change in microstructure and Zener–Hollmann parameter and reported instability in the flow stress at higher strain rates as shown in Figure 8. The true stress of the flow curve for a constant strain rate was found to be gradually decreased with an increase in the temperature.

Figure 8. Flow curves of AISI 1010 steel in compression obtained using different strain rates after austenitization at 1050 °C for 5 min and at deformation temperatures of (a) 750 °C, (b) 900 °C, and (c) 1050 °C [22].
Rajput et al. [23] conducted hot compression tests on AISI 1060 steel in Gleeble 3800 simulator at strain rates from 0.01–80/s as well as at different temperatures under the vacuum of 1 pascal. The authors concluded the following: (a) the high values of stress exponent (n) and strain-rate sensitivity (m) were due to the dynamic recovery and recrystallization of ferrite and austenite respectively, (b) the combined effect of adiabatic heating and inhibited restoration leads to damage at the austenite triple grain boundary at high strain rates, and (c) the deformation of the steel was found to be a diffusion-controlled process as the value of apparent activation energy (290 KJ/mole) was very close to the bulk self-diffusion energy of the austenite (270 KJ/mole). The variation of the flow stress versus temperature plots and flow stress versus strain rate for all regimes of strain rates and temperatures is shown in Figure 9 [23].
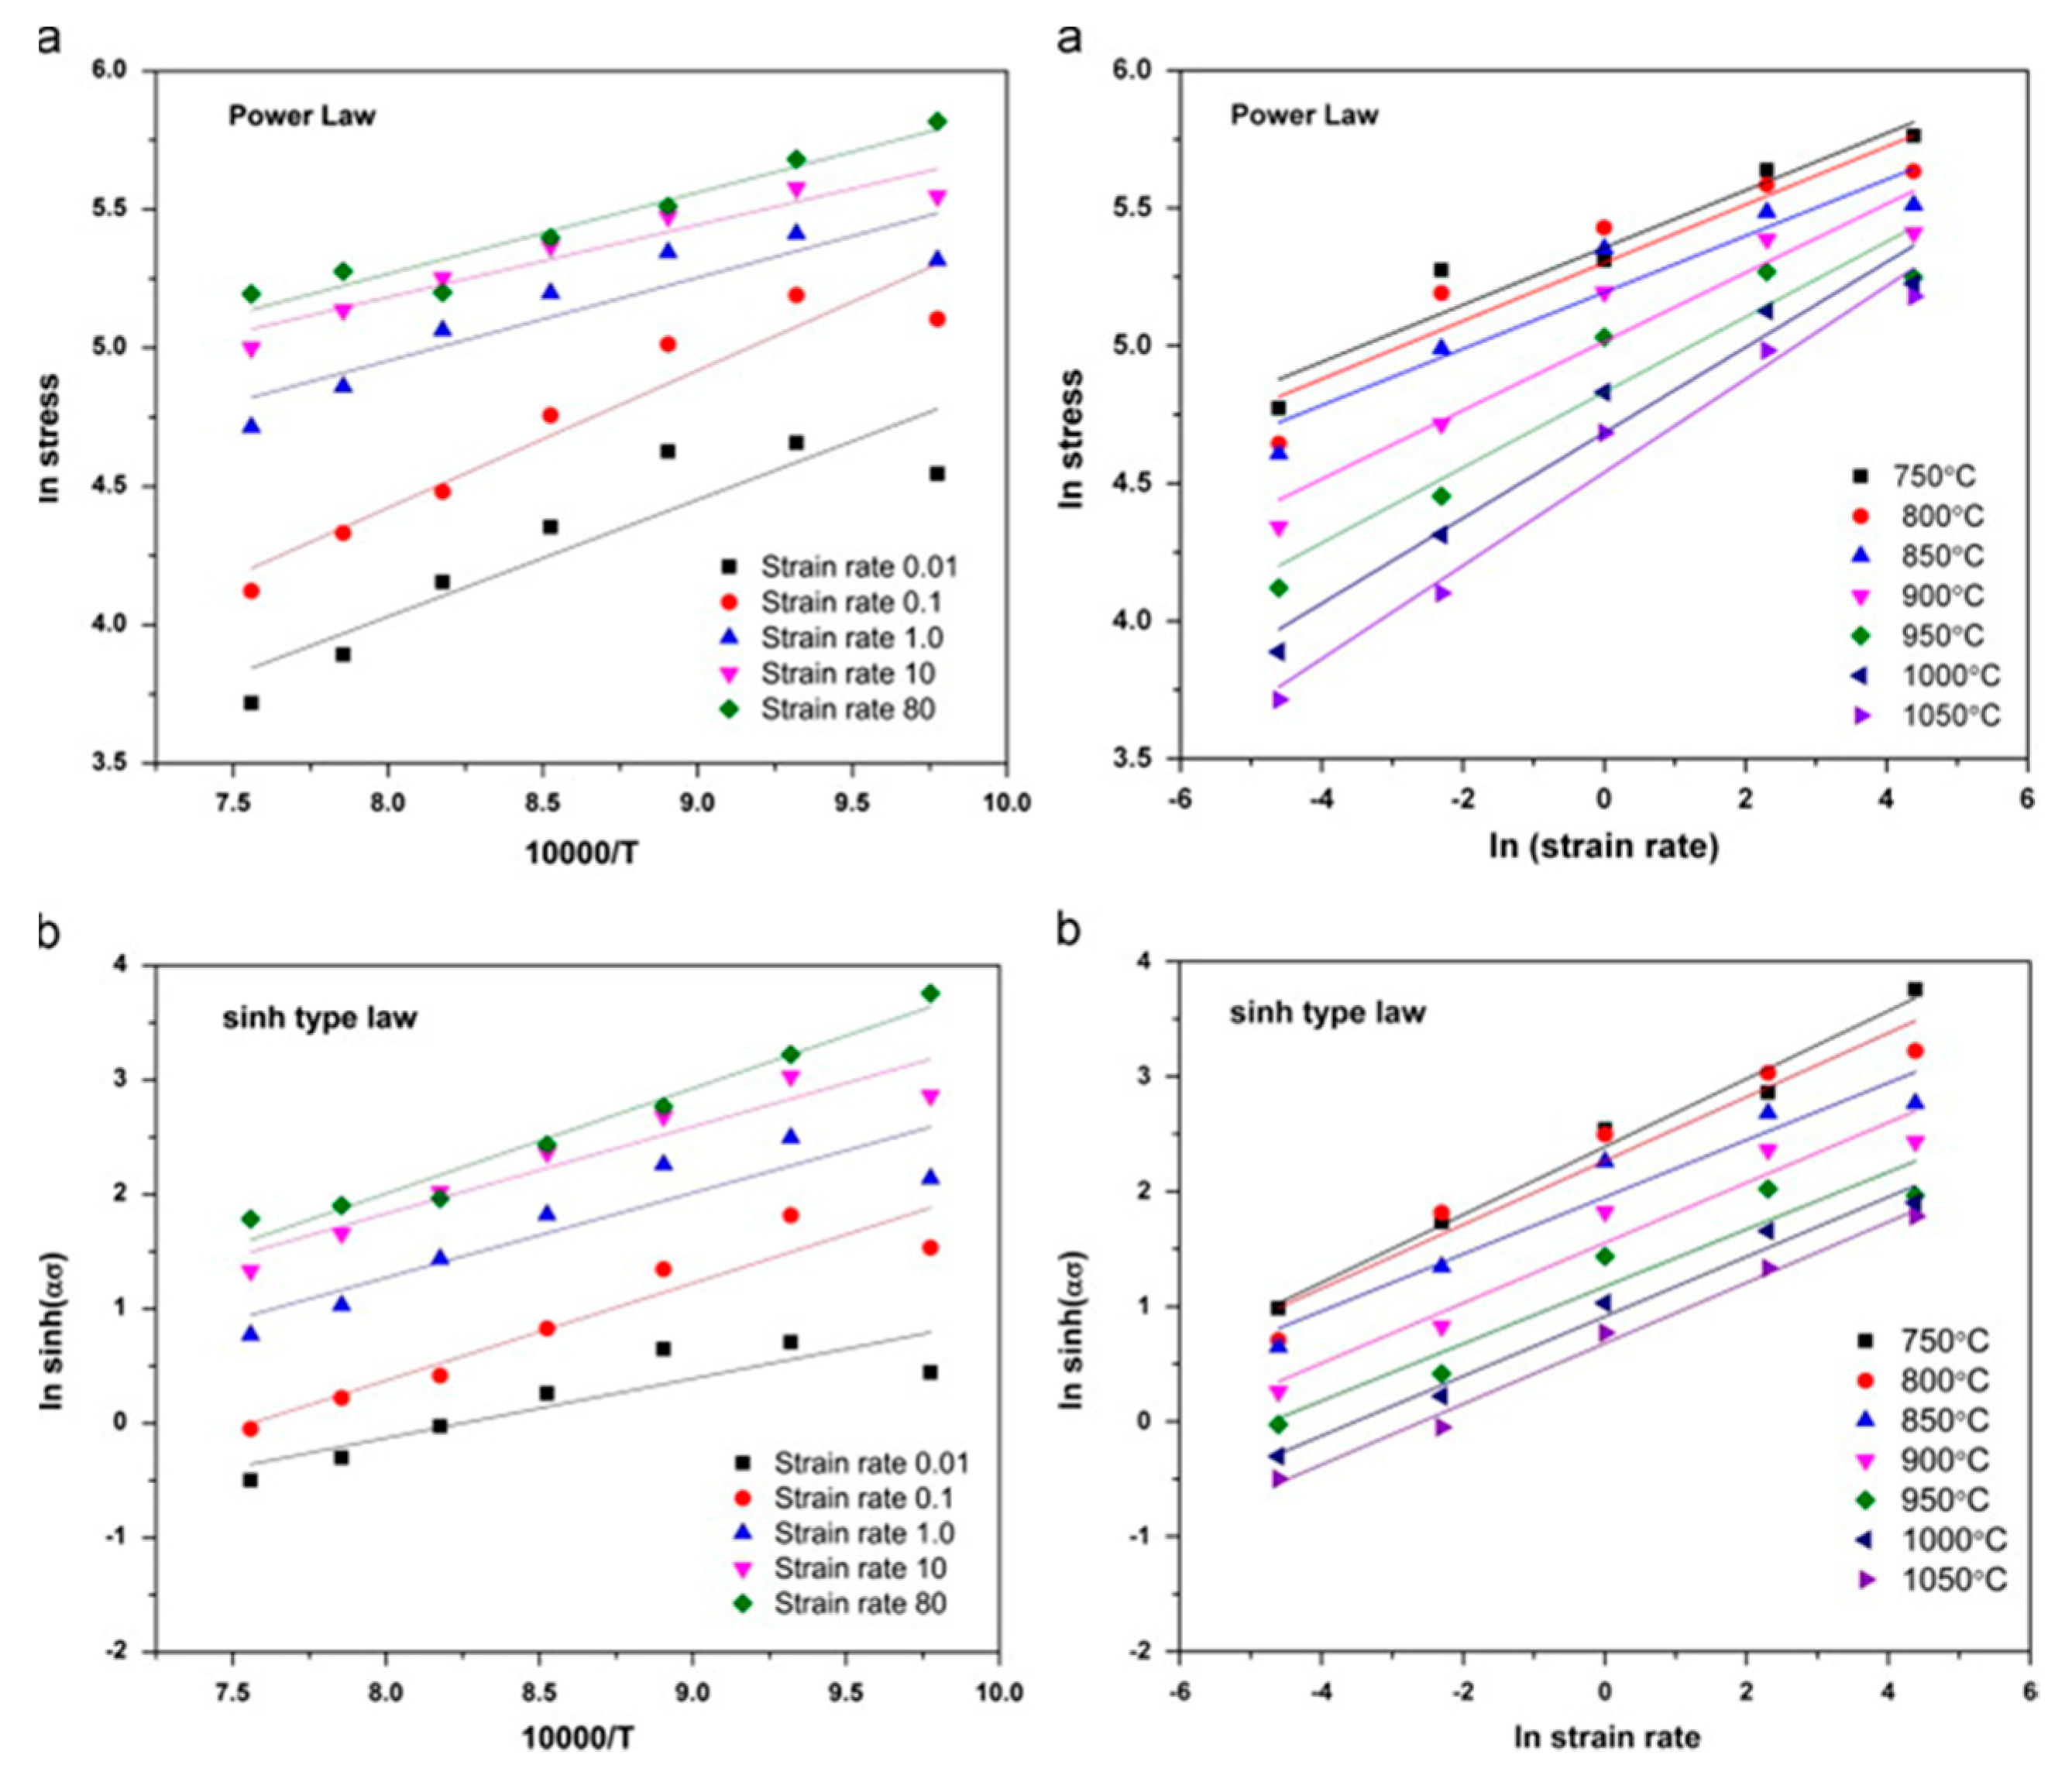
Figure 9. Flow stress and temperature plots for all strain rates at the true strain of 0.6 using (a) power law and (b) sinh type law [23].
Gao et al. [24] conducted a series of compression tests on a bimetal consisting of pearlitic and low carbon steel on Gleeble 3500 mechanical simulator from temperature ranges from 800–1100 °C and strain rates of 0.02, 0.1, 1, and 10 s−1. The authors correlated the profile of the strain-hardening region of the flow curves with the dislocation multiplication as well as interaction and the softening region of the flow curve with the dynamic recrystallization. Zhi-Xiong et al. [25] carried interrupted hot tensile tests at different strain rates from 1 to 3000 s−1 as well as temperature from 800–1200 °C and reported an increase in the volume fraction of the recrystallized grains with an increase in the temperature and strain rate. Similar types of isothermal compression tests were done by Wang et al. [26] at different strain rates ranging from 0.01 to 0.5 s−1 in Gleeble 3500 simulator at temperature of 0.01–0.5 s−1 to understand the deformation behaviour of carbon structural steel (Q235A) having the chemical composition of 0.17% C, 0.22% Si, 0.68% Mn, 0.0095% P, 0.006% S, and rest FE. They concluded that a decrease in the strain rate along with an increase in the deformation temperature inhibits the occurrence of dynamic recrystallization (DRX).
Stress-relaxation phenomenon is observed when the tests are interrupted without unloading the specimen at different strain rates. These tests are widely used for characterising parameters such as internal stresses and activation volume during mechanical deformation [27]. During stress relaxation, the elastic strain gets converted to plastic strain. Stress relaxation tests were conducted at predefined engineering strains for low carbon steel and the other two grades of steel [28]. They concluded the stress drop to be inversely proportional to the rate of change of dislocation velocity. The stress drop was observed to be decreased with strain as shown in Figure 10. Strain hardening is considered the predominant medium for resistance to dislocation for low carbon steel with a ferritic phase. Thus, with an increase in the strain accumulation in the material, there is an increase in strain hardening and a subsequent decrease in stress drop.
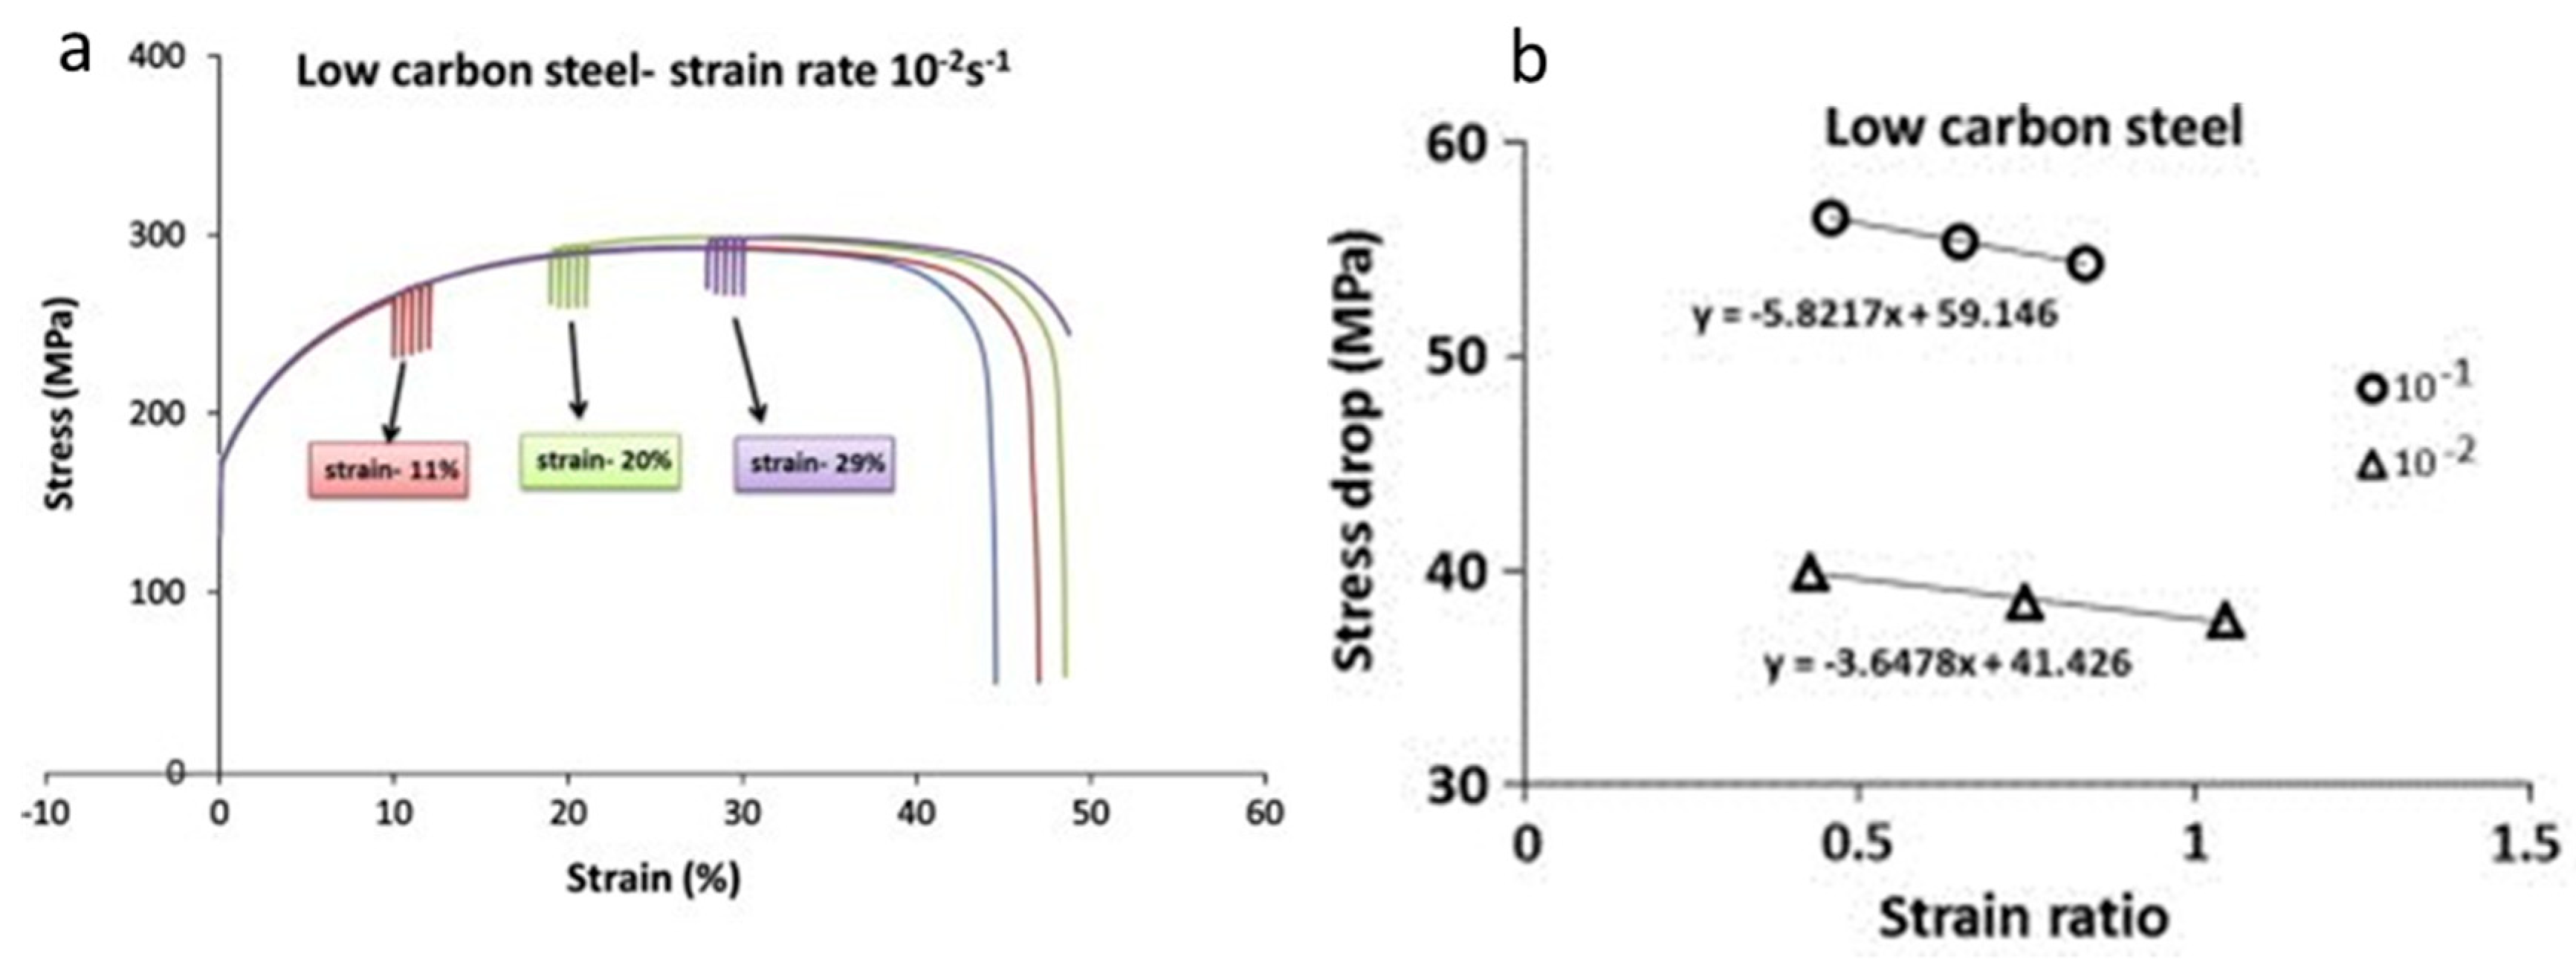
Figure 10. (a) Comparison of stress relaxation and monotonic tensile curve; (b) stress drop versus strain ratio [28].
Earlier studies done by Tsuchida et al. [29] on ferrite-cementite low carbon steel showed an increase in the lower yield point and flow stress with a decrease in the grain size at different strain rates of 3.3 × 10⁻⁴ s−1, 100 s−1, and 103 s−1, as shown in Figure 11. They reported an elongation in the Lüders band at the early stages of deformation and attributed this as a reason for the decrease in flow stress with the increase in grain size. Sun et al. [30] developed and verified an explicit equation for annealed mild steel correlating the strain rate and the Lüders strain by measuring the propagation of a Lüders band, expressed as follows:
where SL˙ is the Lüders band velocity, εL is the Lüders strain, and N is the number of bands. It is to be mentioned here that SL˙ and εL are strongly rate dependent, and thus, the Lüders band velocity is a strain-rate-dependent property.
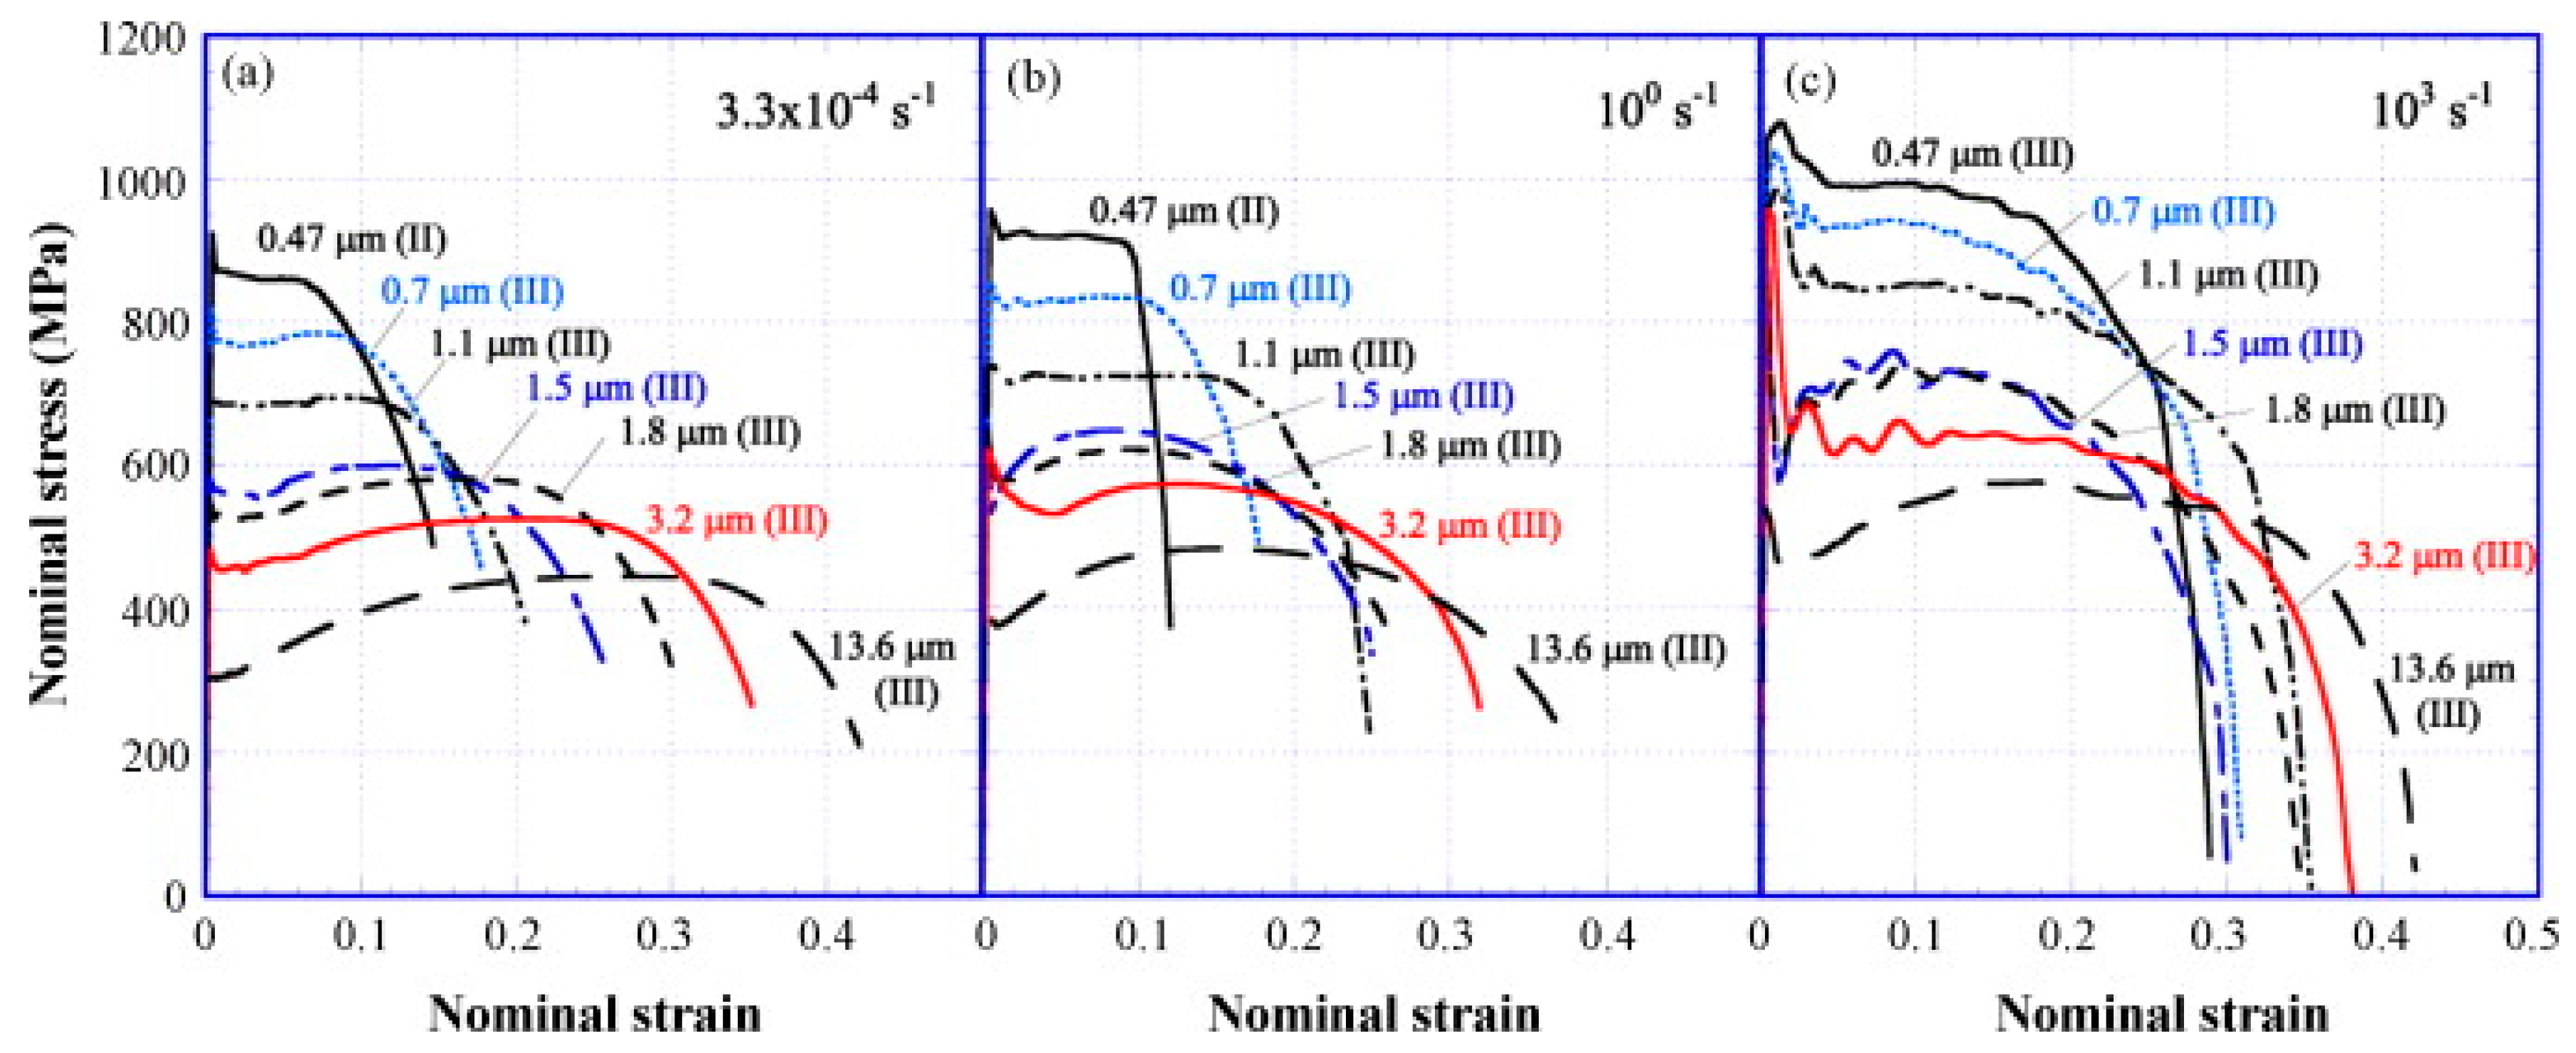
Figure 11. Nominal stress–strain curves of FC specimens obtained by tensile tests with strain rates of 3.3 × 10⁻⁴ s−1 (a), 100 s−1 (b), and 103 s−1 (c) at 296 K [29].
Development of localized shear bands and the concurrent microstructure evolution in a 0.22% C steel at different strain rates of 610, 650, and 1500 s−1 was investigated by Xu [31] while performing torsional testing using split Hopkinson bar. Three different heat treatments were given to the steel viz (a) heating at 850 °C and holding for 30 min followed by air-cooled; (b) heating at 850 °C, holding for 30 min, and then quenched in water; and (c) heating and holding at 850 °C for 30 min, followed by quenching, and then tempering at 300 °C for again 30 min. They concluded (a) that, the higher the strength of the steels, the easier is the formation of the shear bands; (b) that the shear localization was found to occur after the material reached a critical strain. Before arriving at the critical strain, the deformation was uniform for the entire gage length, whereas after reaching the critical strain, the deformation was localized and the material had undergone work softening; (c) that the fracture surface of all the three steel samples showed a transgranular mode of fracture, indicating a ductile failure, as shown in Figure 12; and (d) that the formation of shear localization was due to the change in the crystal orientation and initiation and growth of the microcracks.

Figure 12. Fractographs of different steels: (a) quenched steel, (b) quenched and tempered steel, and (c) normalized steels [31].
2. Medium Carbon Steel
Steels with carbon content in the range of 0.25–55% are generally termed medium carbon steels. In addition to micro-alloyed steels, medium carbon steels are also used for structural applications, and thus, understanding the dynamic flow behaviour of medium carbon steels is important from a functional aspect. Therefore, it is significant to understand the dynamic flow behaviour of these materials, which has been discussed in detail in this section. Saadatkia et al. [32] investigated the high-temperature deformation behaviour for 0.5% carbon steels under varying strain rates (10−4–10−1 s−1) and temperatures from 900–1100 °C. They observed three types of flow behaviours: (a) single peak, (b) multiple transient steady-state peaks (MTSS), and (c) cyclic behaviours, as shown in Figure 13. The curves depict that, at low temperature (900 °C) and at high strain rates, the flow curves exhibited single peak behaviour whereas, at high temperature (1100 °C) and low strain rates, a multi-peak pattern was observed.
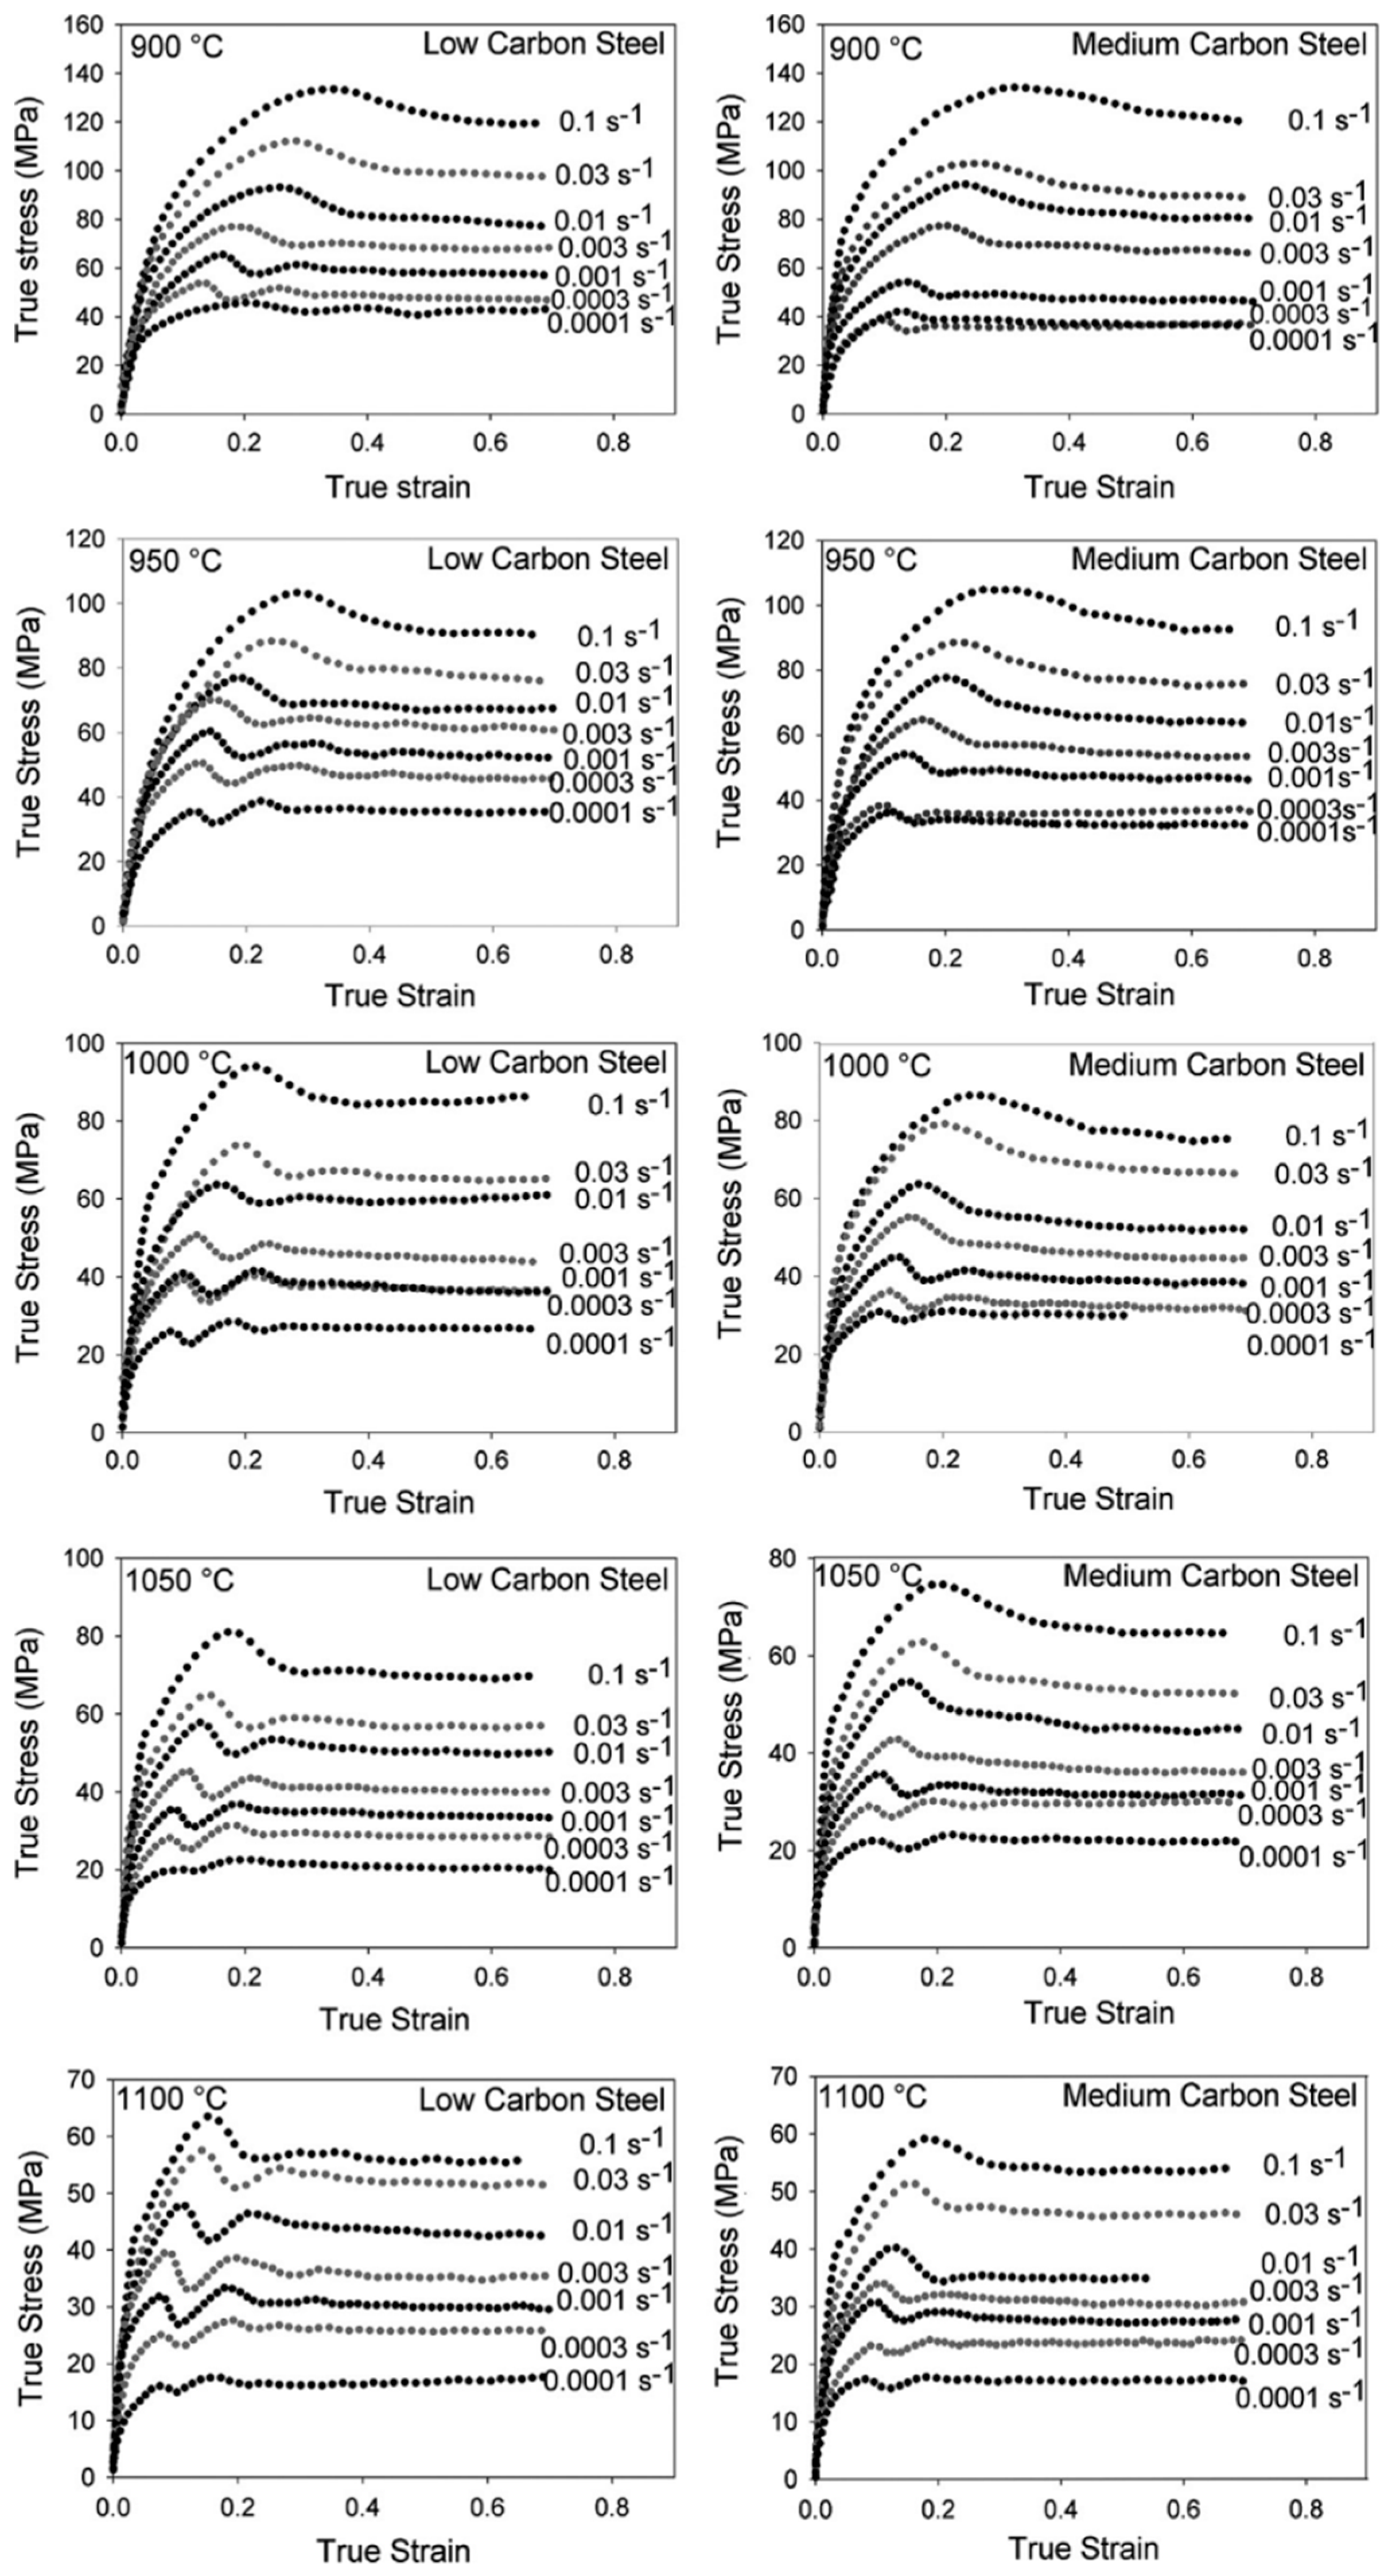
Figure 13. Flow curves at different deformation conditions [32].
Duan and Zhang [33] studied the microstructural features and formation mechanisms of adiabatic shear bands in AISI 1045 steel induced by high-speed machining and observed the formation deformed shear bands (low strain rates) as well as transformed shear bands (high strain rates). The authors concluded that the deformation bands were formed due to the severe plastic shear, whereas the transformed bands were formed due to the process of recrystallization, reorientation, and elongation of the martensitic laths along with the formation of subgrains and equiaxed grains. The formation of both transformed as well as deformed shear bands were observed as shown in Figure 14. It was further concluded that the martensitic laths were elongated along the direction in the deformation bands and experienced plastic deformation only.
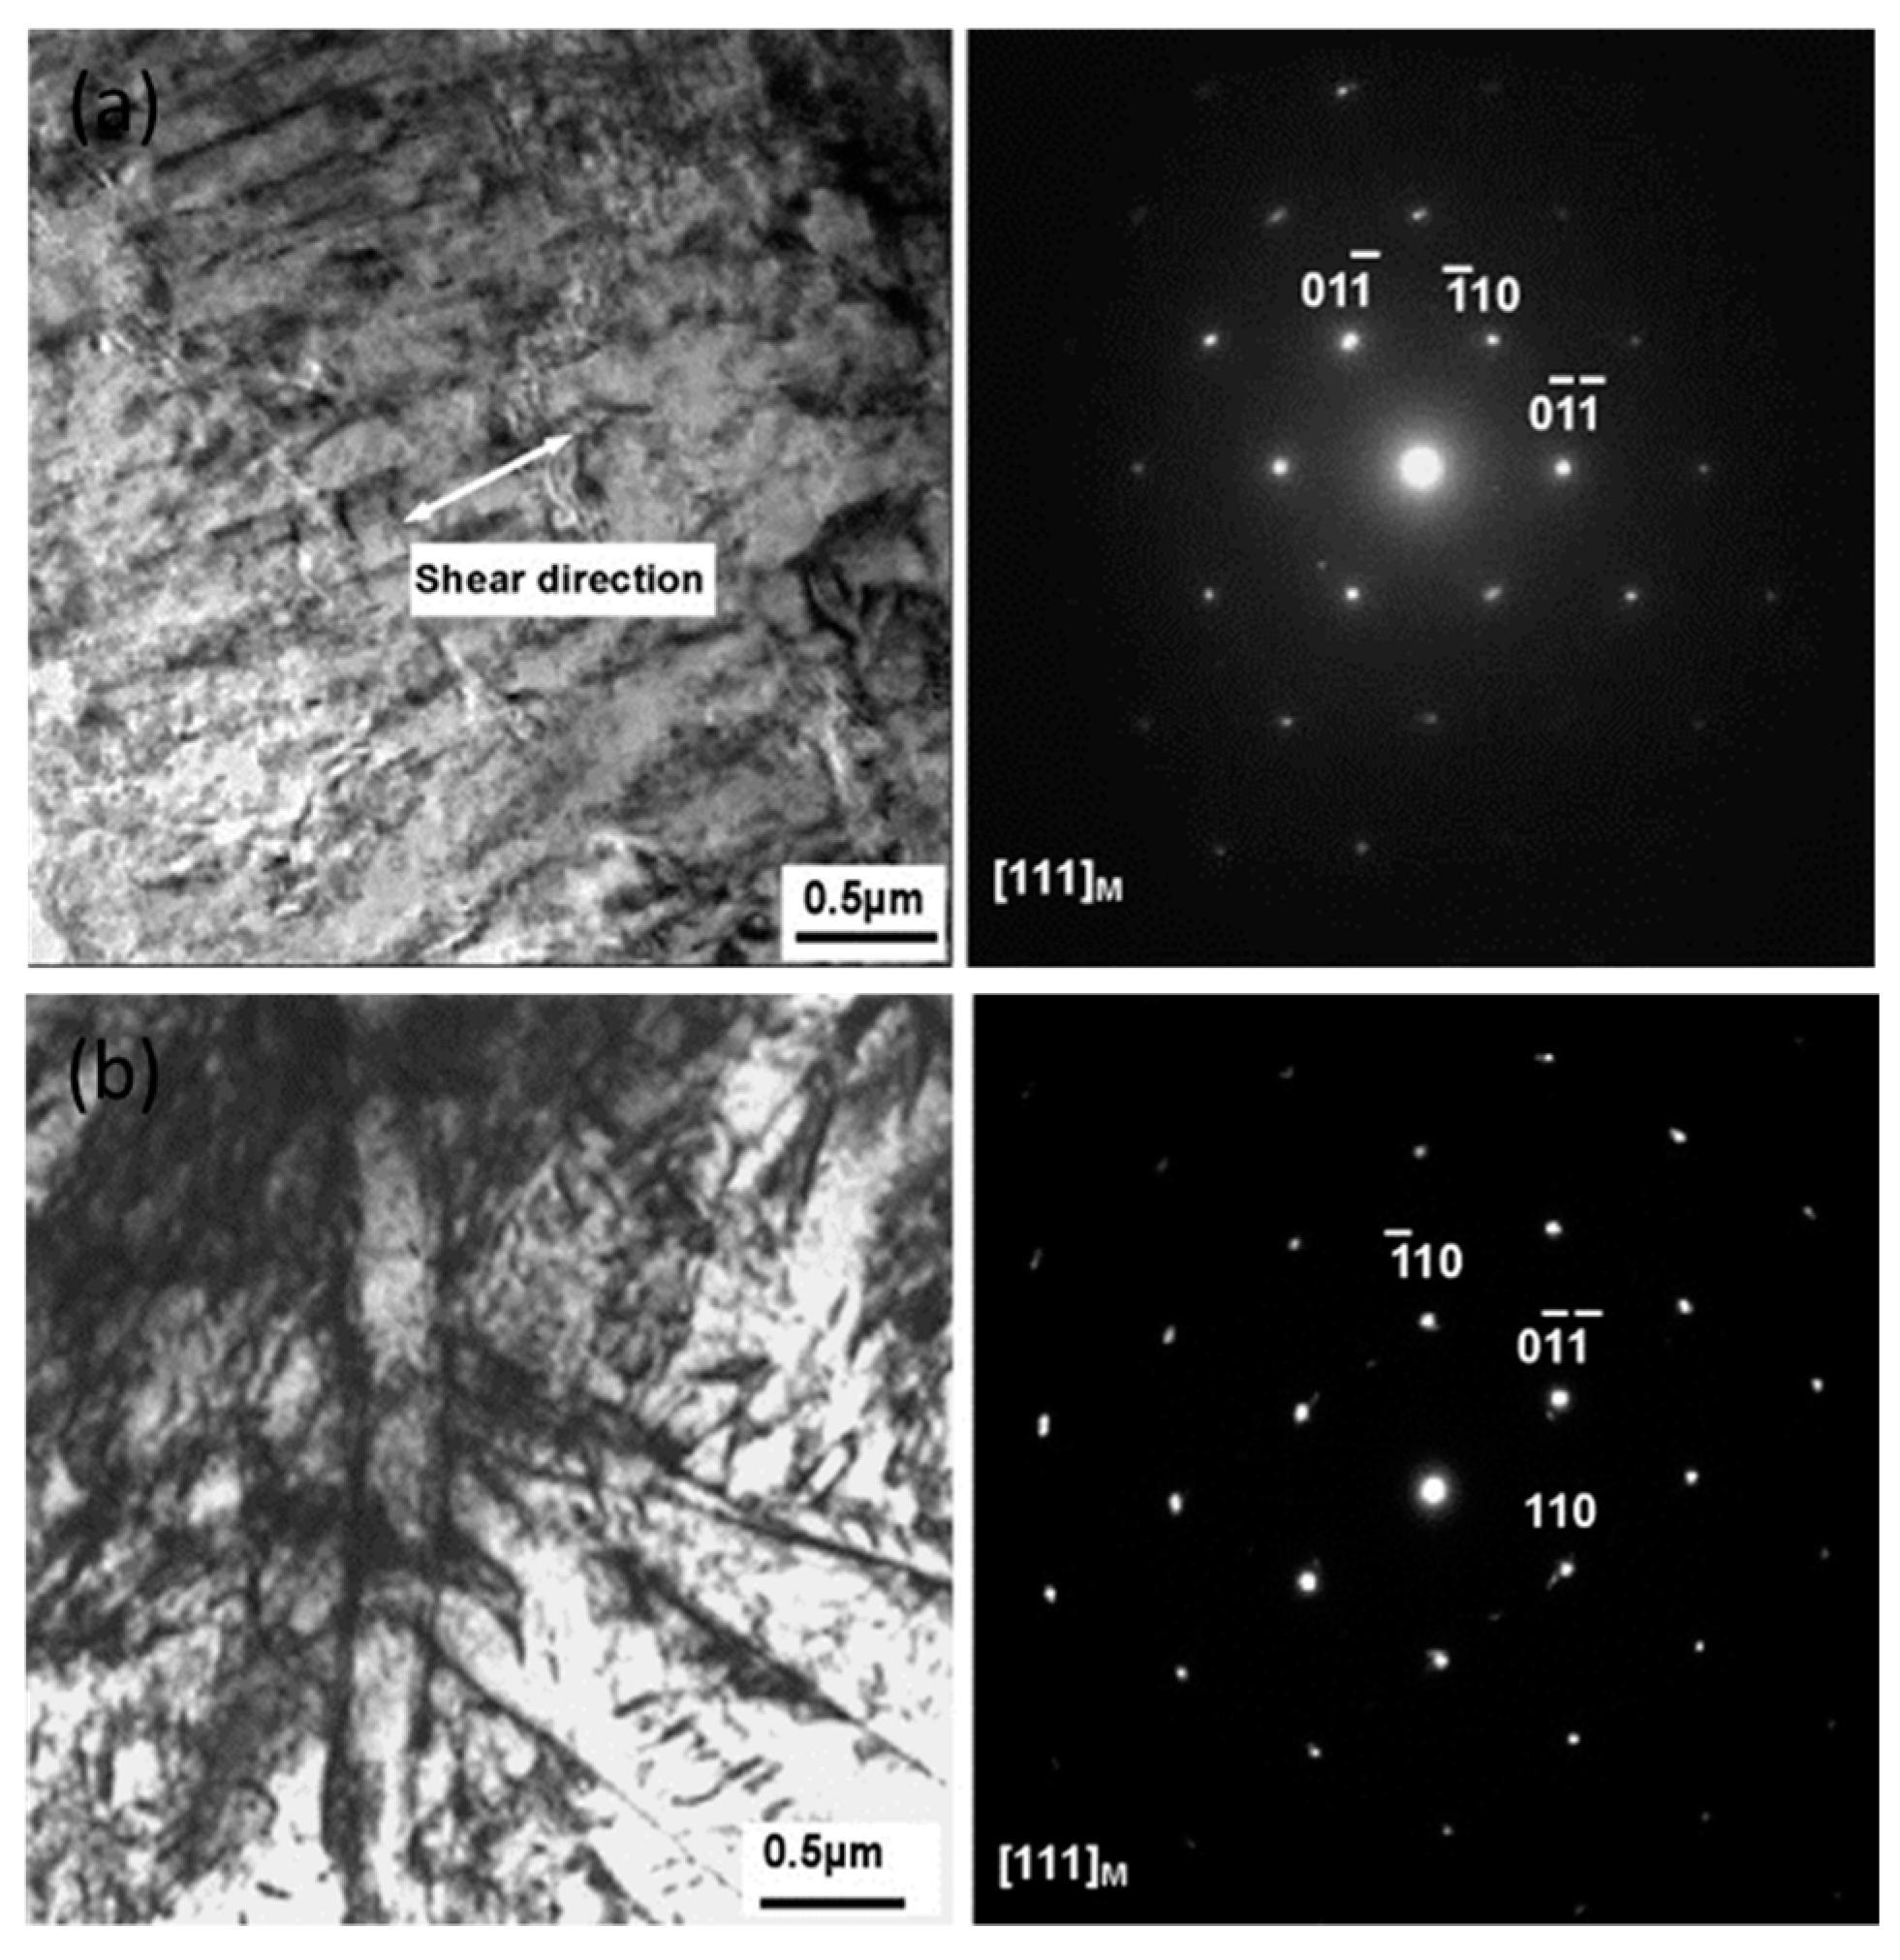
Figure 14. TEM and selected area diffraction (SAD) pattern of (a) deformed shear bands and (b) transformed shear bands [33].
The effect of grain size and strain rate on the strength and strain-rate sensitivity parameter (m) of a nanocrystalline and ultrafine-grained 0.55% carbon steel was predicted by Baracaldo et al. [34] using nanoindentation techniques at various strain rates from 3 × 10⁻³ to 10−1 s−1. The strain-rate sensitivity was determined using the following equation:
where H is the hardness of the material (GPa) and ε˙ is the strain rate. They reported a constant decrease in the m value for the ultrafine regime, whereas for the nanocrystalline regime, a minor increase in the m value with a decrease in the grain sizes was observed. Also, the strength of the material was found to be slightly increased with the increase in the strain rate, as shown in Figure 15.
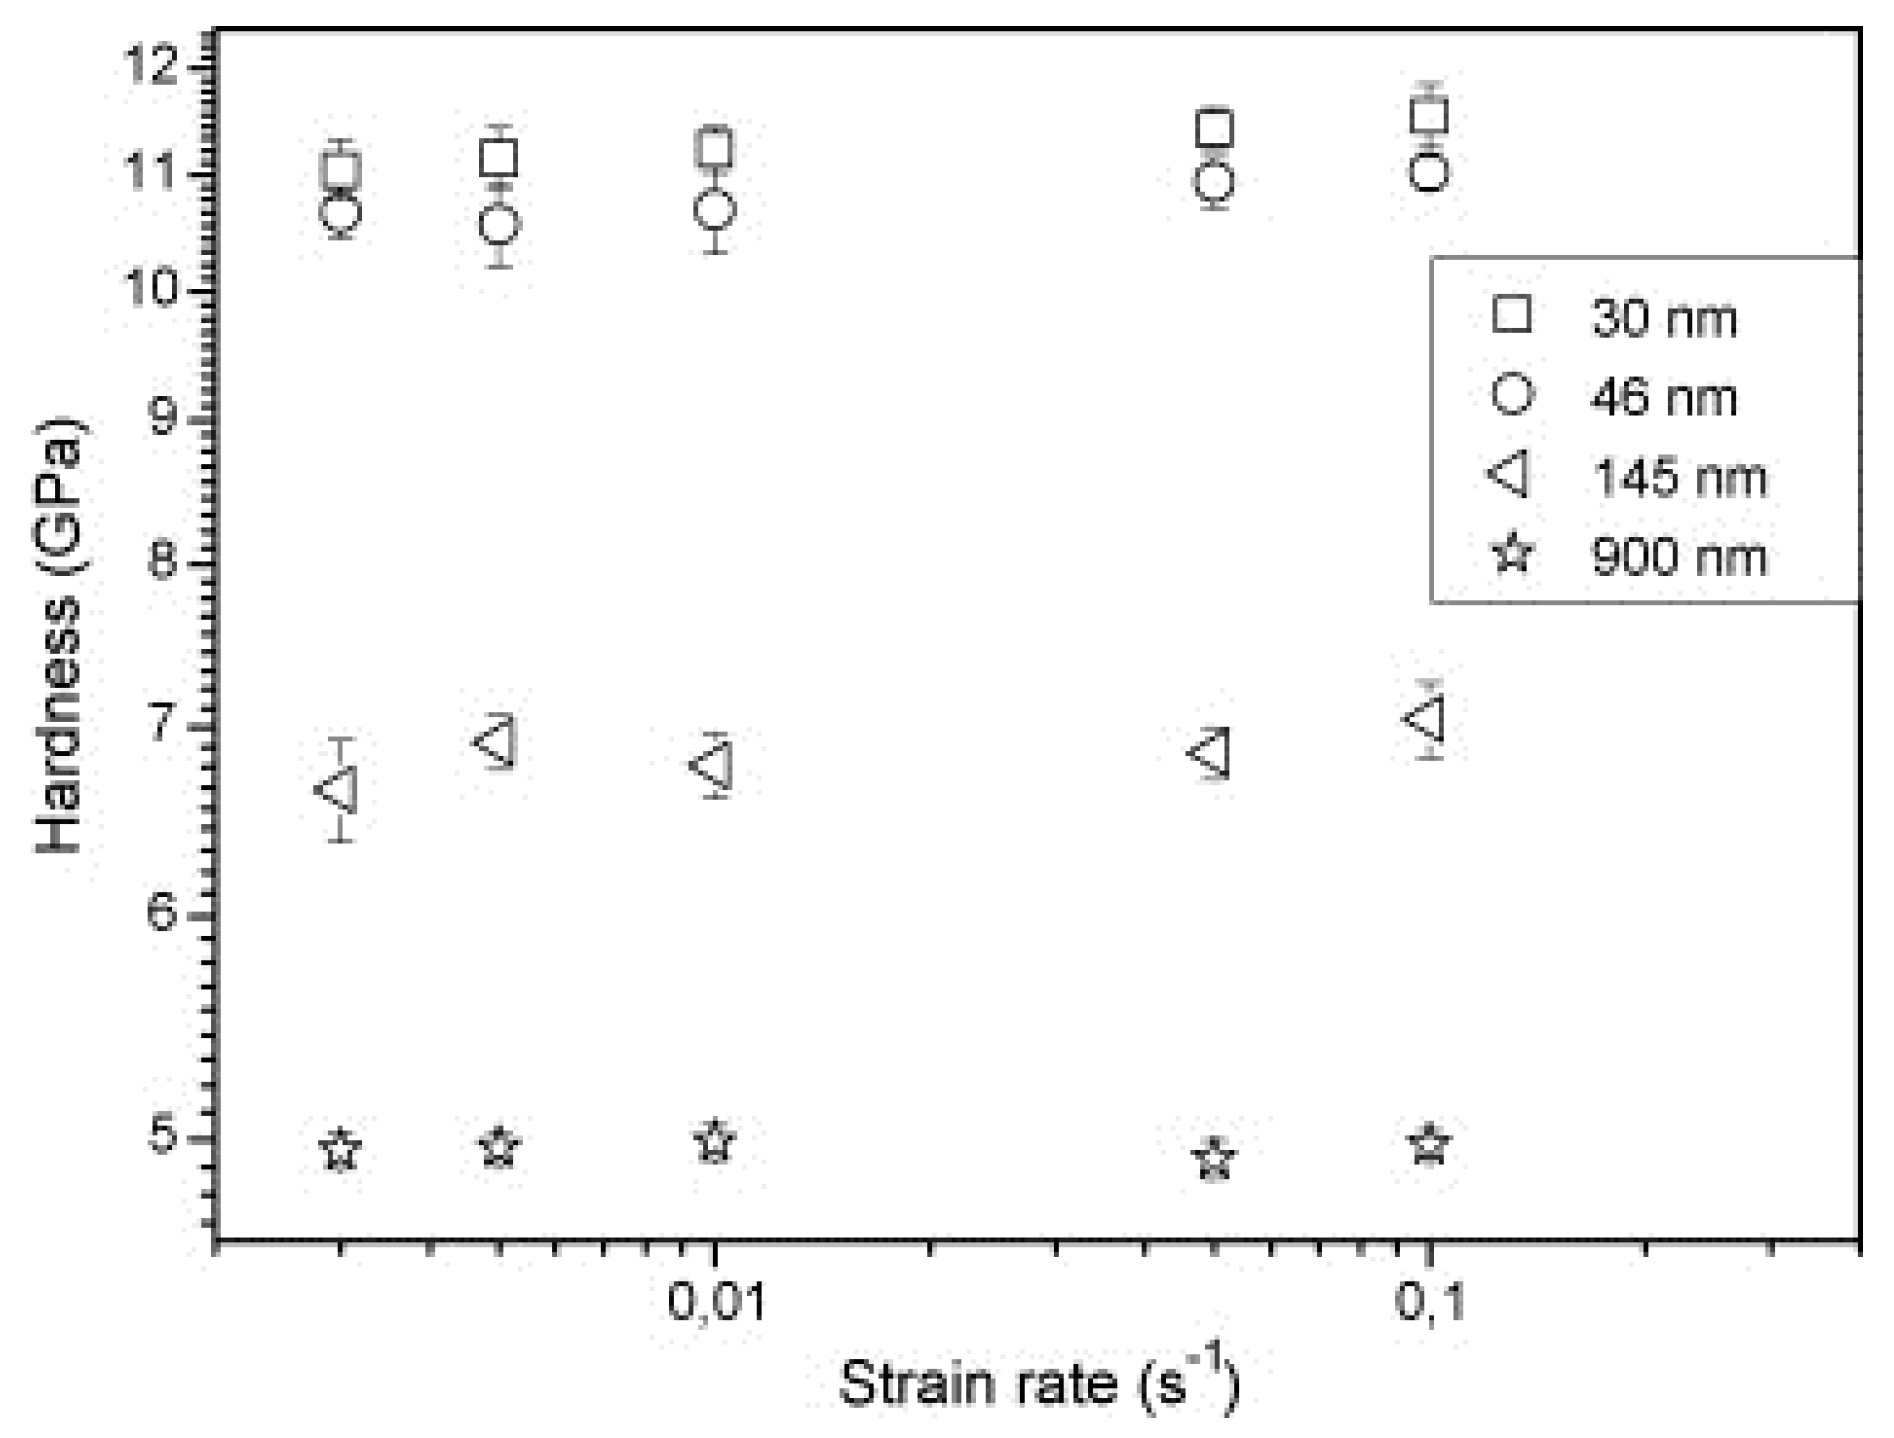
Figure 15. Nanoindentation hardness vs. strain rate for the different grain sizes [34].
Fu and Yu [35] conducted a hot compression test on a 0.36% plain carbon steel in Gleeble. They performed single hit compression tests from 0.01 to 10 s−1 at different temperatures and reported an increase in the flow stress with the increase in the strain rate but a decrease with the increase in the temperature except at 850 °C, as shown in Figure 16. They observed the occurrence of dynamic recrystallization after a critical strain is achieved by the material and reported a drop in the stress after attaining the peak strain εp.
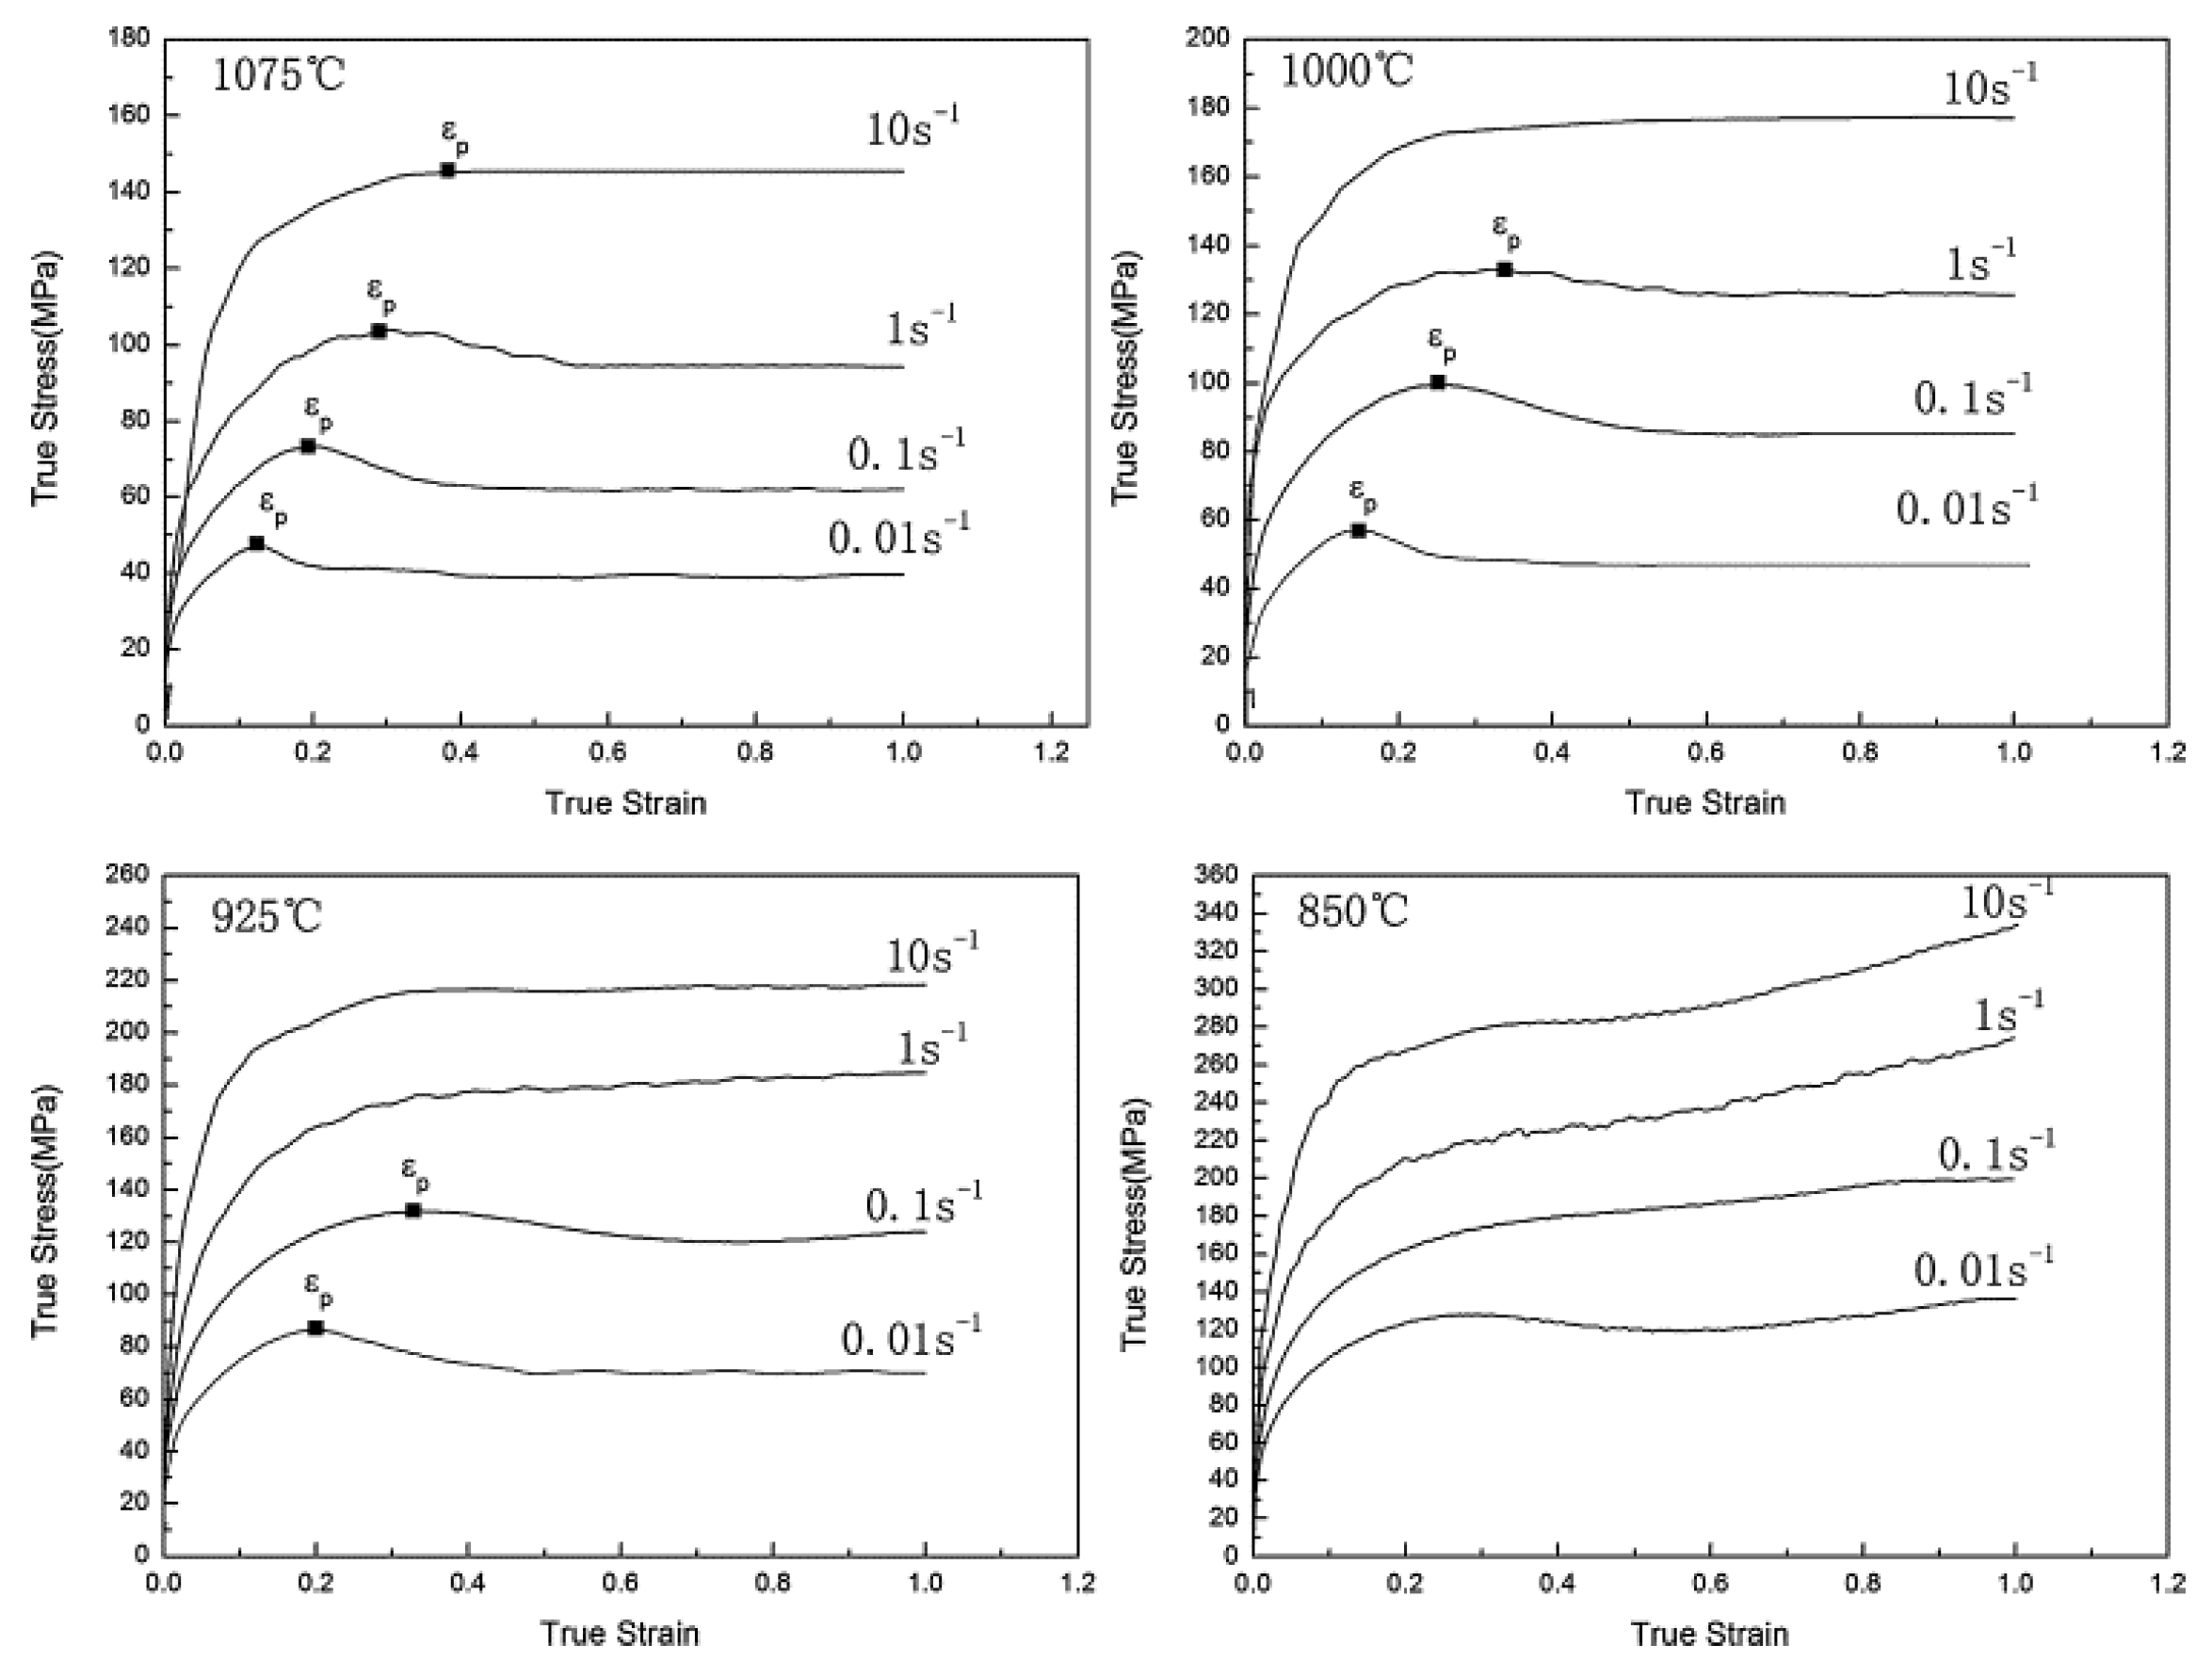
Figure 16. True stress–strain curve under different temperature and strain rates [35].
3. High Carbon Steel
High carbon steels are mostly used for industrial application in extreme operating conditions due to their hardness, strength, and relatively low cost compared to high steel alloys [36][37]. Such steels are mostly used where high abrasion is a necessity. They are mostly used for manufacturing of drill bits, masonry nails, metal cutting tools, grinding balls, and knives. In contrast to the low and medium carbon steels, after an exhaustive literature review, the author predicts that the studies on the strain-rate behaviour of high carbon steel are very scarce. This may be due to the relatively brittle nature of these steels and the lack of interest for their deformation behaviour at different regimes of strain rates and temperatures. In this section, a critical review of research work performed on the strain-rate behaviour of high and ultrahigh carbon steel is presented.
Earlier studies have been done to investigate the effect of change in the carbon content with respect to DRX, dislocation annihilation, grain recovery, and activation energy [38][39][40][41][42][43][44][45][46][47]. Serajzadeh and Taheri [38] investigated the effect of carbon content on the DRX, flow stress, and recovery phenomenon of carbon steels during their hot deformation and reported a faster occurrence of DRX in high carbon steel as compared to the low carbon steel as shown in Figure 17a. They further concluded that the presence of carbon increases the dynamic recovery rate at low strain rates due to its effect on the process of dislocation climb and self-diffusion rate. At higher strain rates, it decreases the rate of dynamic recovery, which is presented in Figure 17b.
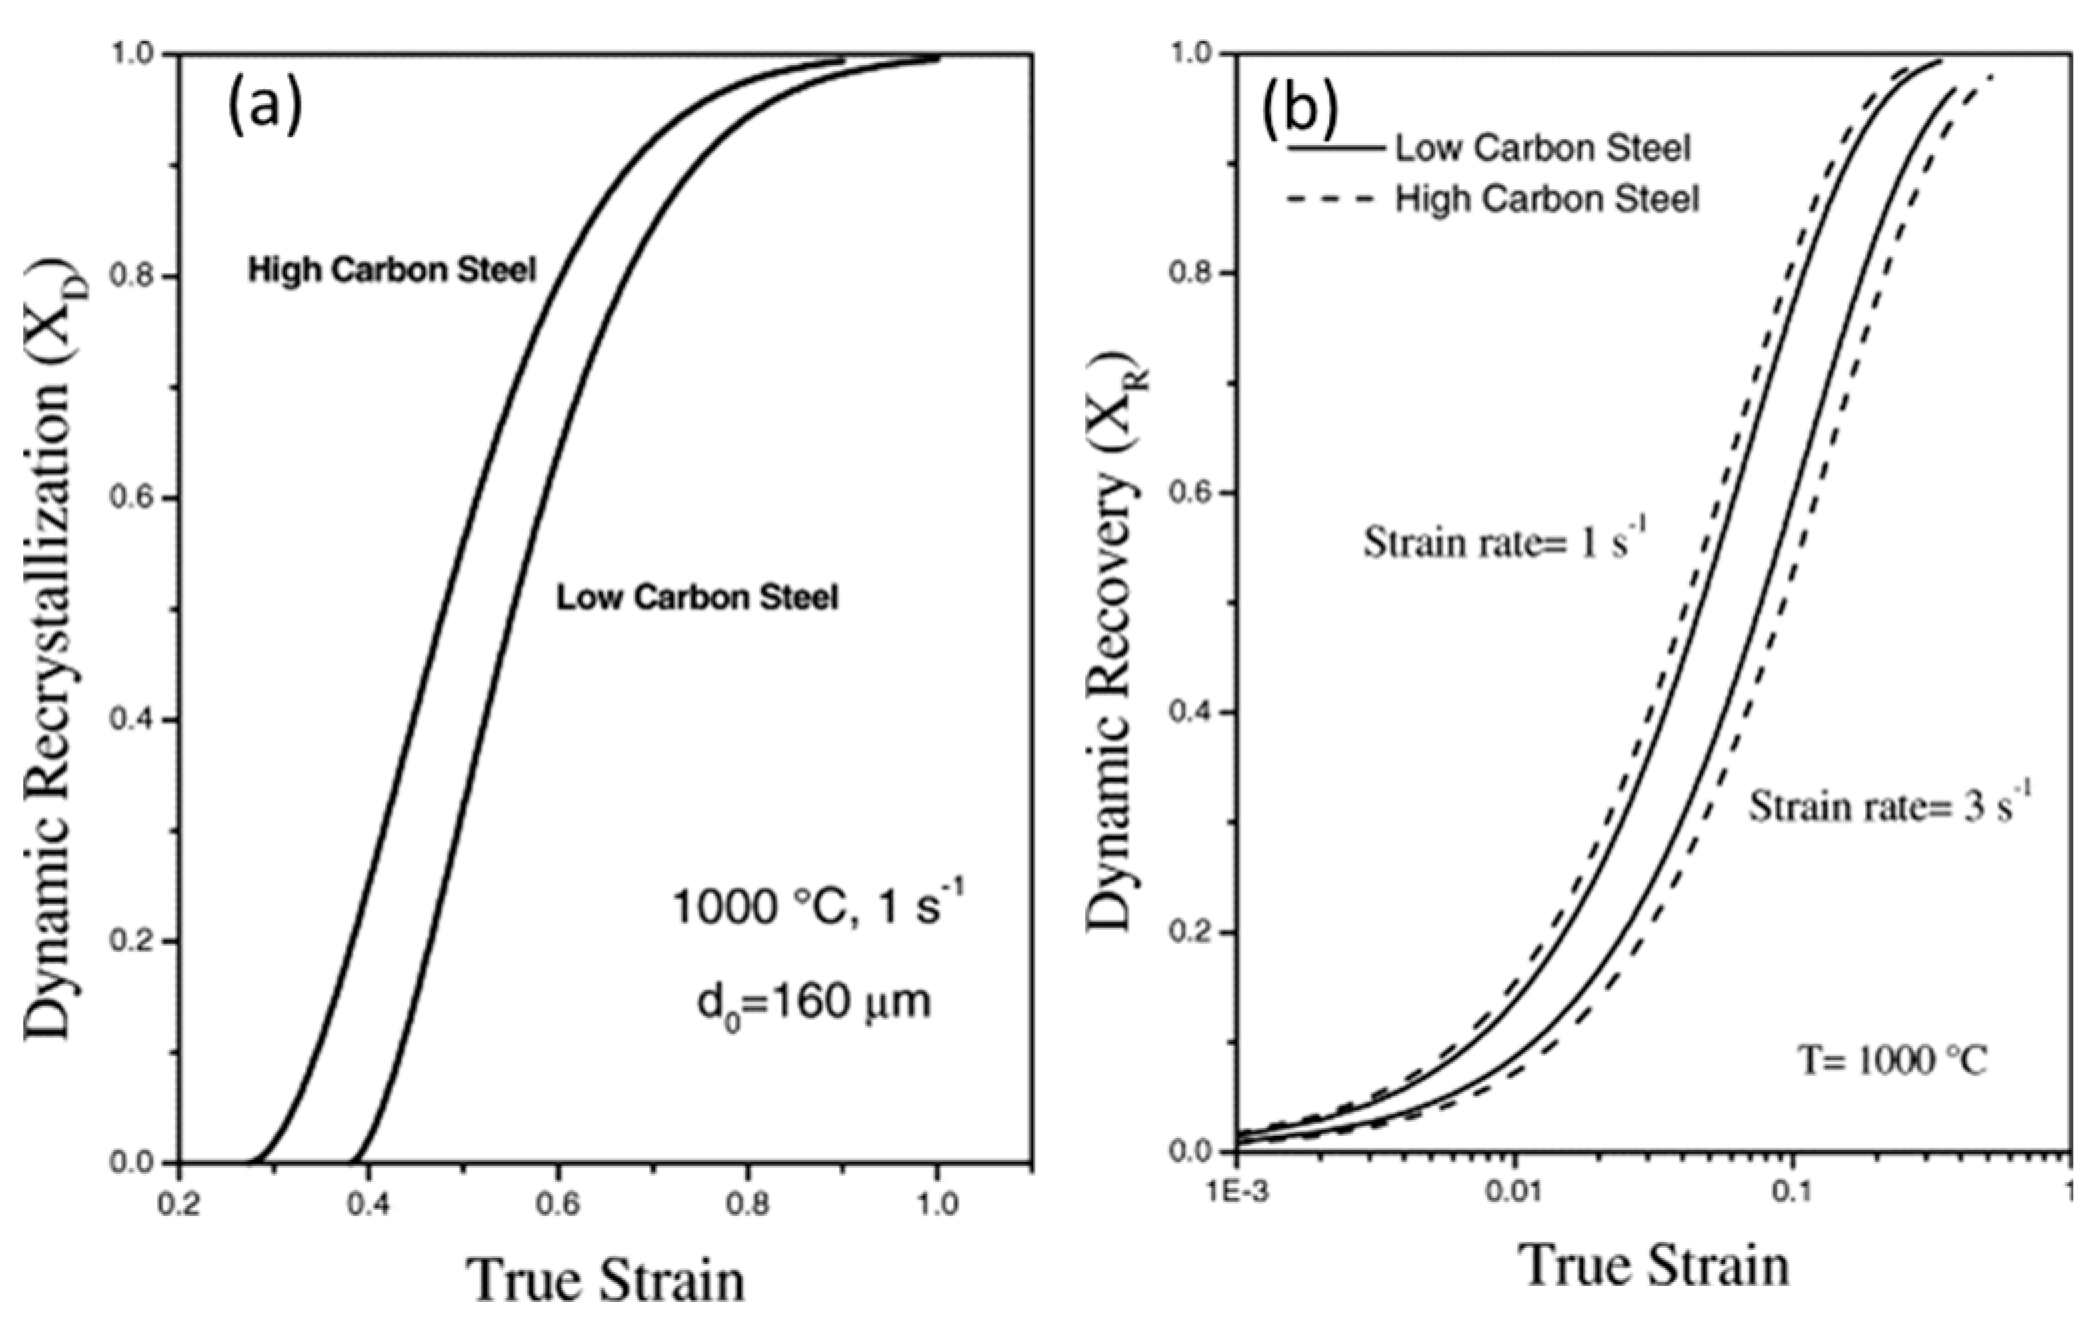
Figure 17. The progress of (a) dynamic recrystallization and (b) dynamic recovery at 1000 °C [38].
Wray, in his previous studies [41][42], conducted hot tensile tests to determine the flow stress behaviour of plain carbon steels at different strain rates varying from 6 × 10⁻⁶ to 2 × 10⁻² s−1 as a function of carbon content in the range of 0.005 to 1.54%. His studies revealed that an increase in the carbon content leads to a decrease in the work-hardening region and the flow stress of the material. The hot strength of the austenitic steels with varying percentage of carbon (0.0037 to 0.79%) was modelled by Kong et al. [43] using the artificial neural network (ANN). They confirmed the decrease in the flow stress with the increase in the carbon content at low strain rates and high temperatures, whereas the flow stress was found to be lower at high strain rates and low temperature. Lee and Liu [44] performed compressive type SHPB tests on low carbon S15C (0.15% C), medium carbon S50 (0.48% C), and high carbon SKS93 (1.16% C) steel at different strain rates of 1.1, 2.0, 2.8, 3.7 × 10³, and 5.5 × 10³ s−1 and temperatures of 25, 200, 400, 600, and 800 °C. The authors found an overall increase in the flow stress with an increase in the strain rate, as shown in Figure 18. As evident from Figure 18, the flow stress for SK50 was found to be 1.3 times higher than the flow stress of S15 steel. Similarly, SKS93 exhibited an approximate 10% increase in the flow stresses when compared to S50 steel.
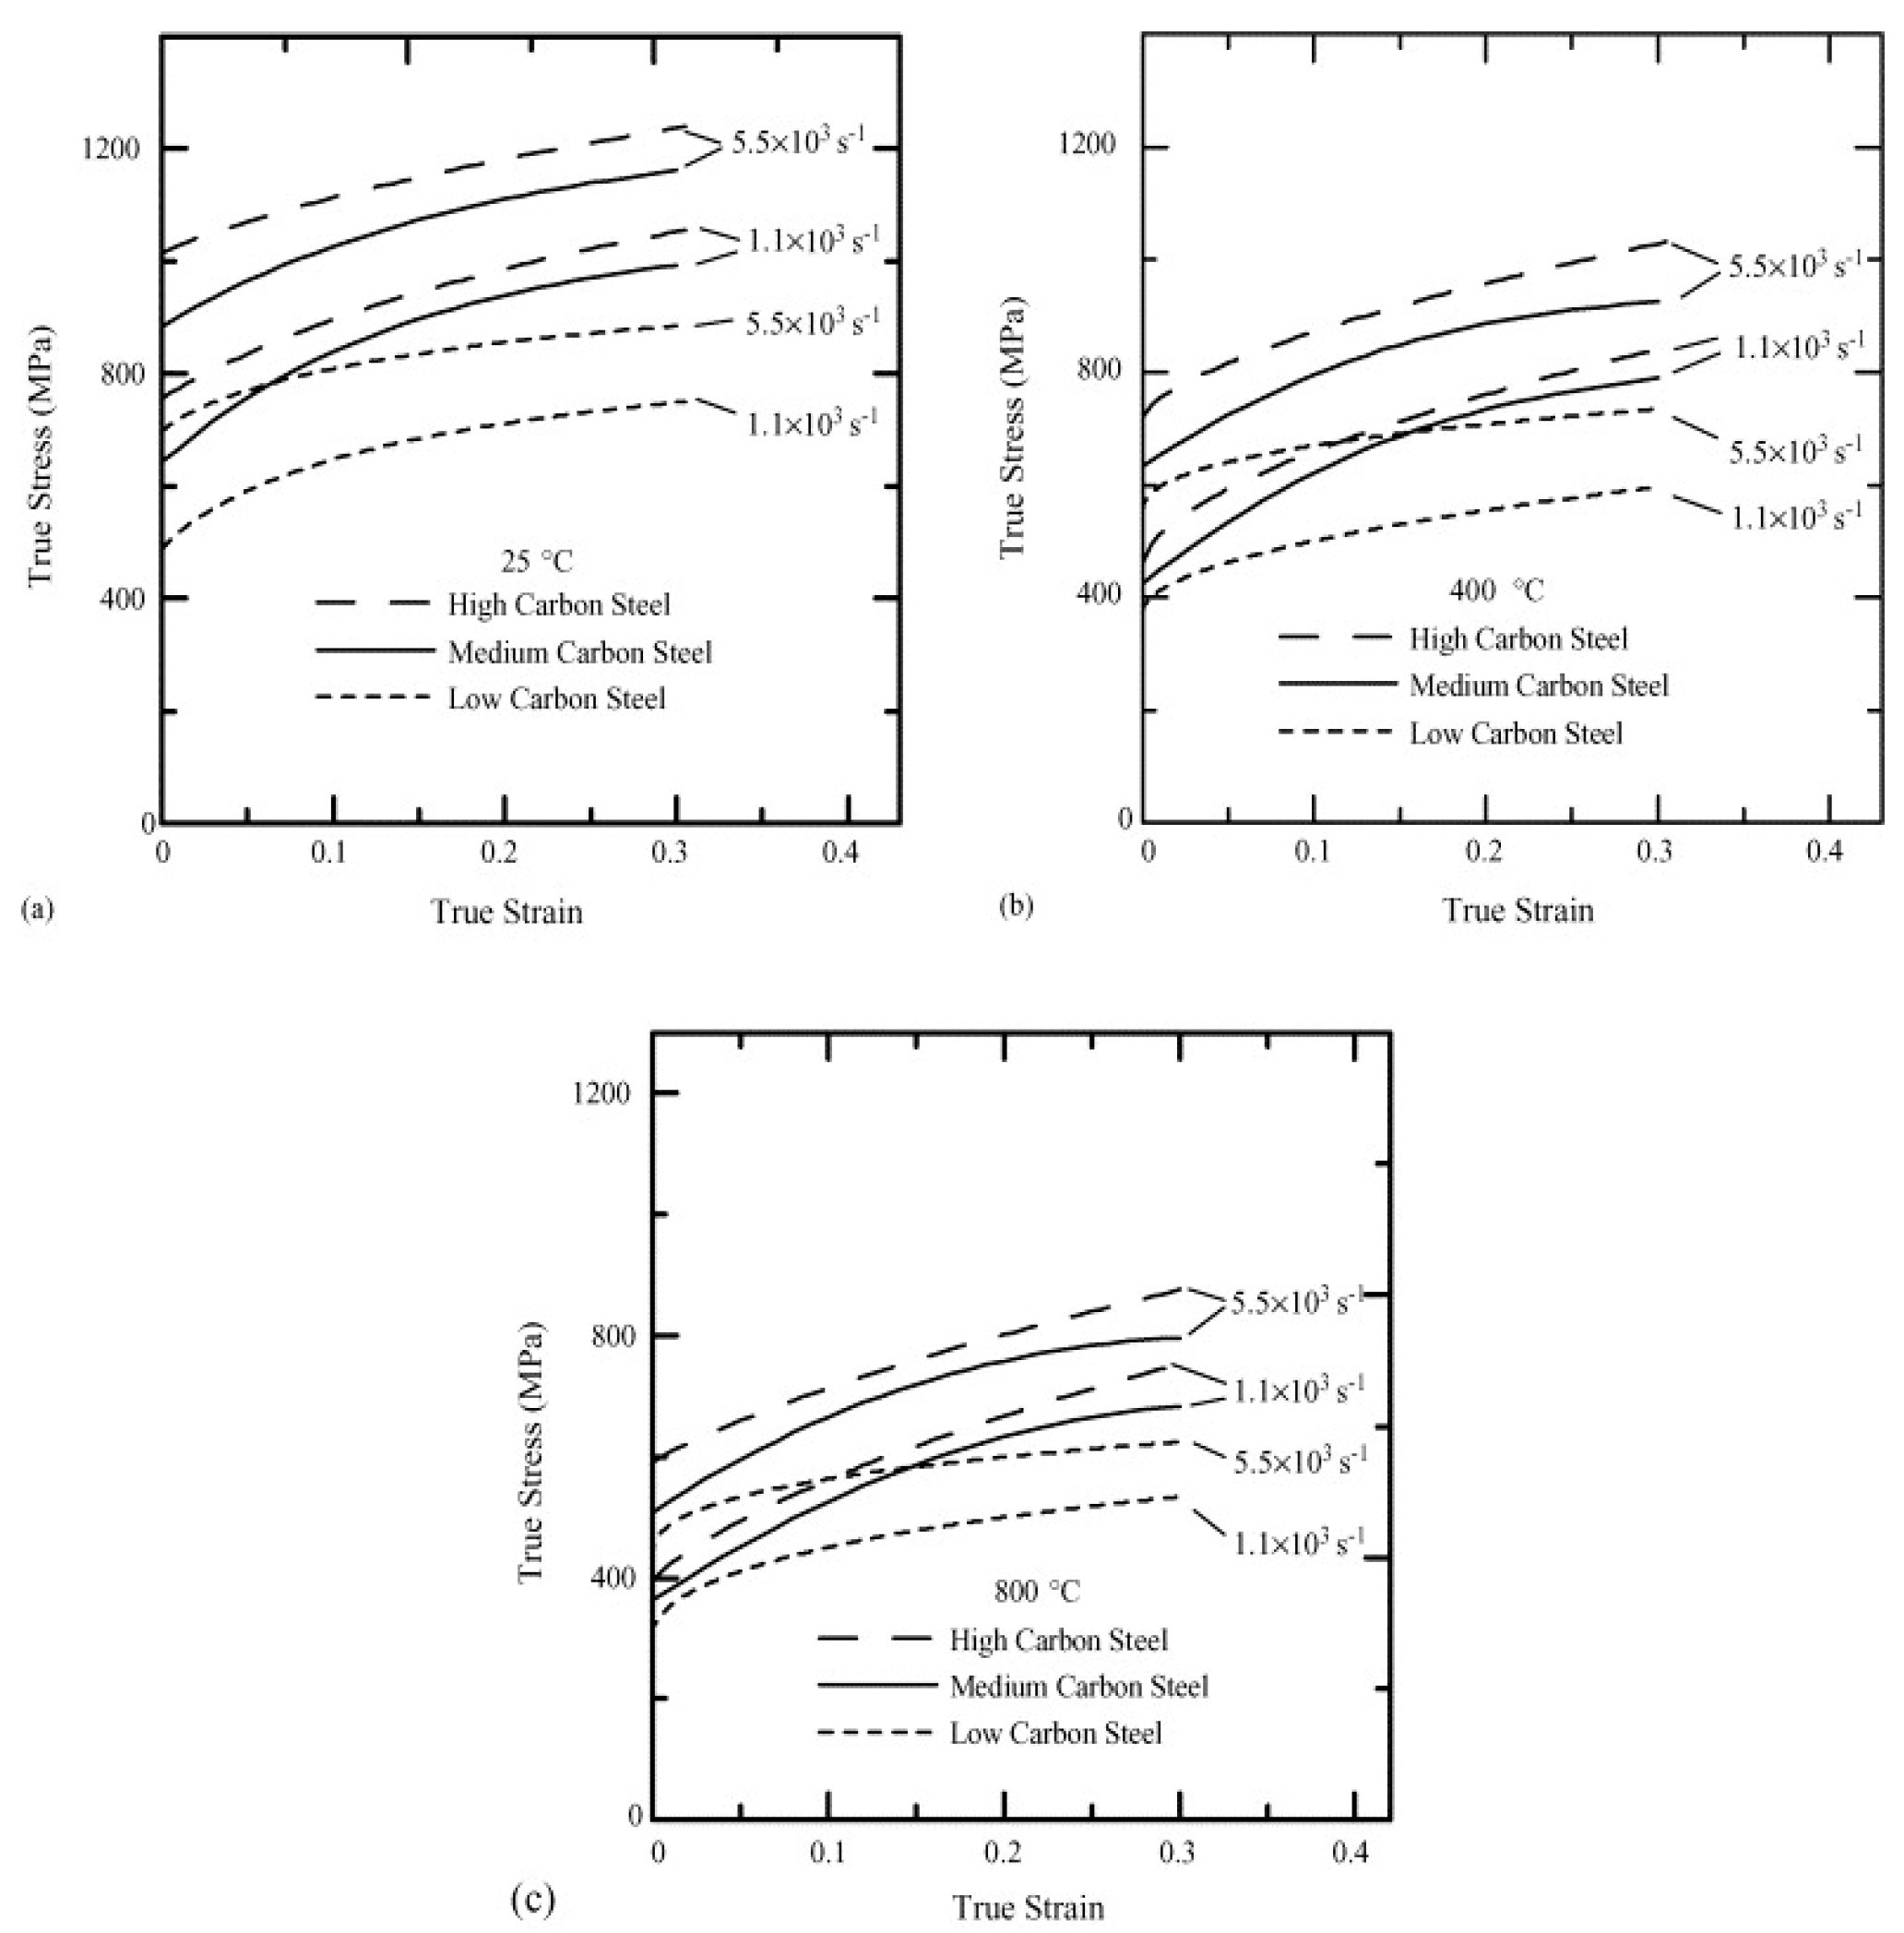
Figure 18. Stress–strain curves of S15C, S50C, and SKS93 at temperatures of (a) 25 °C; (b) 400 °C; and (c) 800 °C [44].
The temperature rise due to adiabatic heating as calculated by Lee and Liu [44] as a function of strain at different strain rates at 25 °C is presented in Figure 19. The material exhibited a rise in the temperature with an increase in the true strain values. For instance, in the case of SKS93 high carbon steel, the rise in the temperature when deformed at the strain rates of 1.1 × 10³ and 5.5 × 10³ s−1 were observed around ~75–80 °C. In terms of microstructural evolution, an increase in the dislocation annihilation at elevated temperatures was documented.
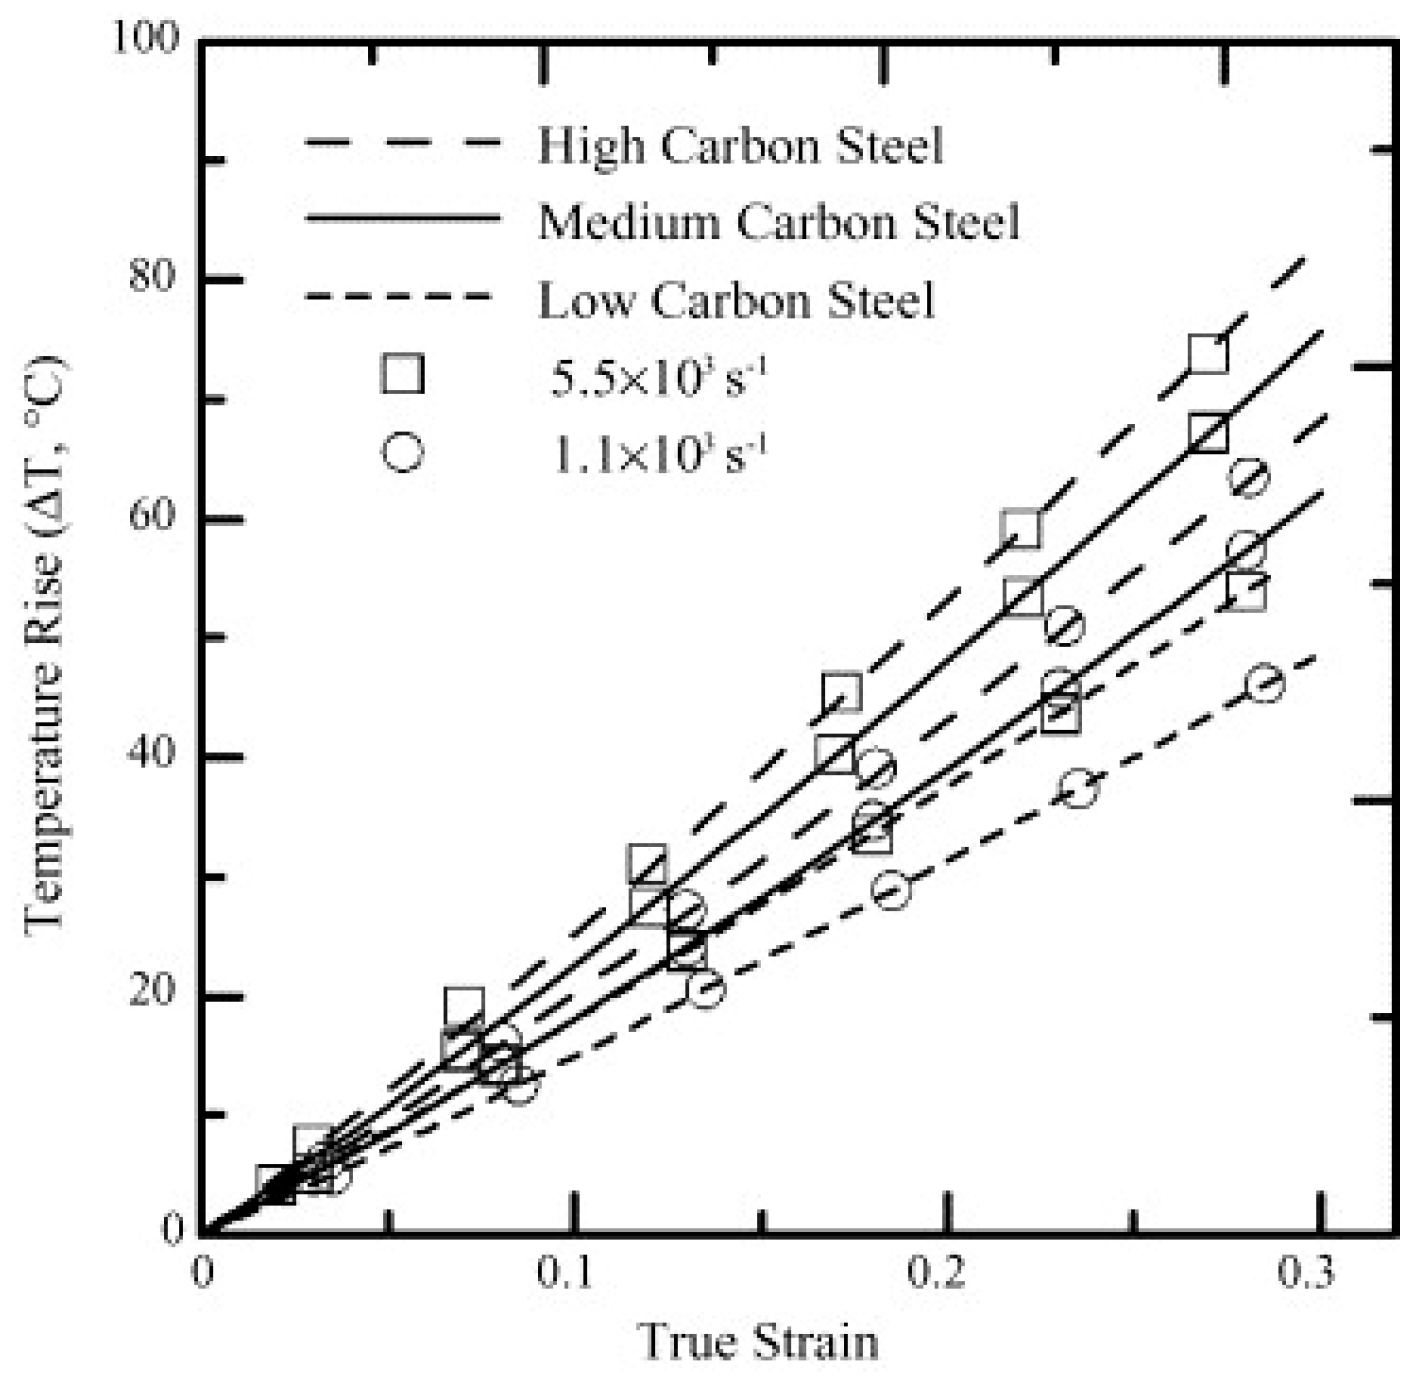
Figure 19. Temperature vs. true strain for three kinds of steels at different strain rates [44].
The superplastic behaviour of ultrahigh carbon steel different strain rates for three different percentages of carbon (1.3, 1.6 and 1.9%) at different temperature regimes was investigated by Sherby et al. [45]. For both the strain rate change tests as well as stress relaxation tests, the measured values of strain-rate sensitivity exponents at 650 °C were reported to be 0.35–0.40 for 1.3% C steel, 0.40–0.45 for 1.6% C steel, and 0.40–0.50 for 1.9% C steel. The tests performed at 750–850 °C revealed the value of strain-rate sensitivity for all the three steels to be around 0.40–0.45.
It is well understood that, during impact and high strain-rate loading conditions, the material is incapable of releasing the heat generated during the process of deformation as that in the case of quasi-static tests [48][49][50][51][52][53]. Thus, the ongoing deformation process is considered adiabatic rather than isothermal in nature. The heating during the adiabatic process may significantly affect the flow behaviour of the material and needs proper investigation. Since the deformation of material exhibits an adiabatic process at high strain rates, a substantial amount of the plastic work gets converted into heat and, thus, the material attains an increase in temperature. The rise in temperature in ferrous material is calculated by the following equation:
where ρ is the density of the steel (7850 kg/cm3); C is the specific heat (0.49 kJ/kg/°C); and η is the proportion of the plastic work which is converted into heat, which was taken to be 100%. In another study [47], Lee and Liu investigated the adiabatic shearing behaviour of the same steels viz S15C low carbon steel, S50C medium carbon steel, and SKS93 high carbon steel at two different strain rates of 5 × 10⁴ and 2 × 10⁵ s−1 using hat-shaped specimens in SHPB testing technique. The authors reported that the shear flow stress, width, and hardness of the shear band were strongly dependent on the amount of carbon content and the strain rate. They observed the formation of deformed and martensitic shear bands in medium carbon and high carbon steel. However, for low carbon steel, only the deformed shear bands were observed. Dimples were observed on the fracture surface of low carbon steel only, whereas for both the medium and high carbon steel, the fracture surface exhibited both dimples and knobby features. The fracture surfaces of all the three deformed steel samples at different strain rates are presented in Figure 20.
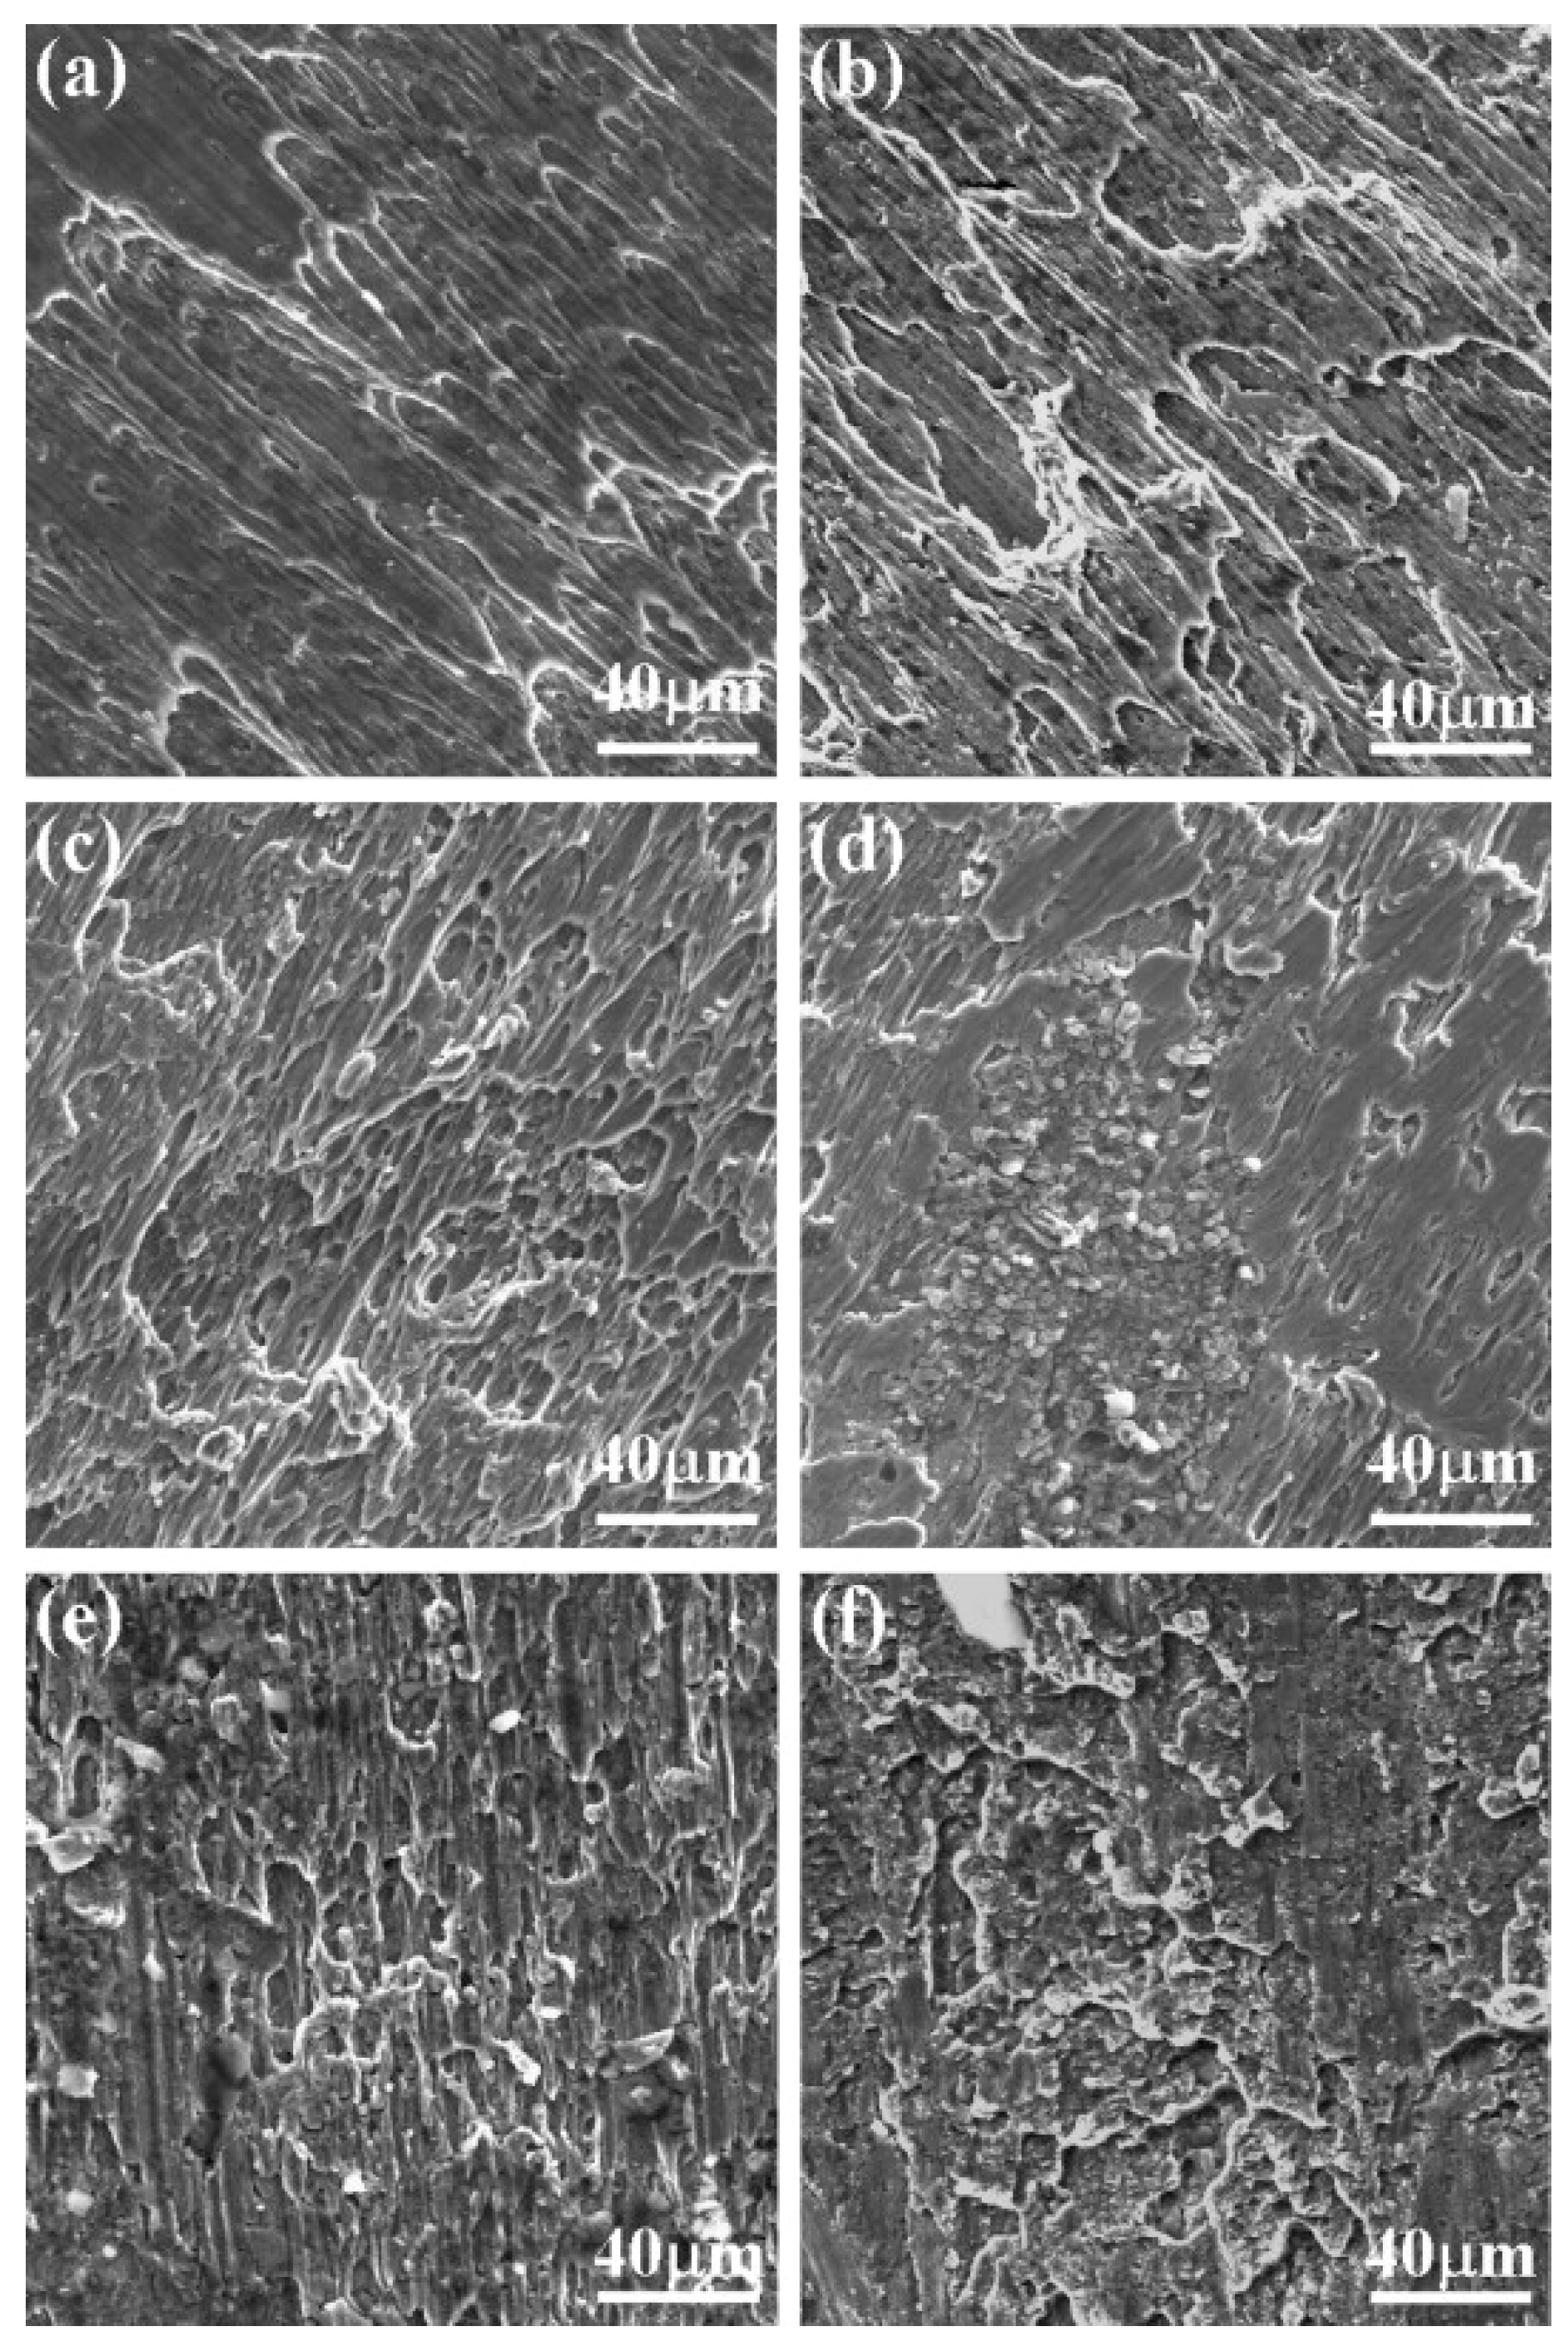
Figure 20. Fracture surfaces of S15C steel deformed at (a) 5 × 10⁴ s−1 and (b) 2 × 10⁵ s−1; S50C steel deformed at (c) 5 × 10⁴ s−1 and (d) 2 × 10⁵ s−1; and SKS93 steel deformed at (e) 5 × 10⁴ s−1 and (f) 2 × 10⁵ s−1 [47].
A similar study was done by Nakkalil [54] to investigate the formation of adiabatic shear bands in plain 0.77% carbon steel during high strain-rate compression testing at different temperatures. The authors concluded that the formation of adiabatic shear band occurs due to the strain localization, which is a common phenomenon during discontinuous load drop. They further observed that, at constant temperature, an increase in the strain rate leads to a decrease in the critical adiabatic strain. On the other hand, an increase in temperature at constant strain rate results in a decrease in the formation of adiabatic shear bands (ASBs). Likewise, in previous studies [33][45], both deformed and transformed bands were observed. Moshksar and Rad [55] analysed the superplastic behaviour of heat-treated fine-grained 0.9% plain carbon steel by conducting experiments at a strain-rate range of 5 × 10⁻⁵ s−1 × 10⁻³ s−1 and at a temperature range of 650–710 °C. They reported a shift in the strain-rate sensitivity exponent (m) towards the greater strain rates with an increase in temperature, as shown in Figure 21. It is shown that, for all the strain rates, the total strain reaches a peak point at a threshold temperature value and then it drops. They reported that, at low strain rates, the grain growth starts at a relatively lower temperature because the specimen is subjected to test temperature for a longer period and thus gets sufficient time for grain growth. With further increase in the temperature, the grain growth accelerates, which leads to the decrease in the total strain.
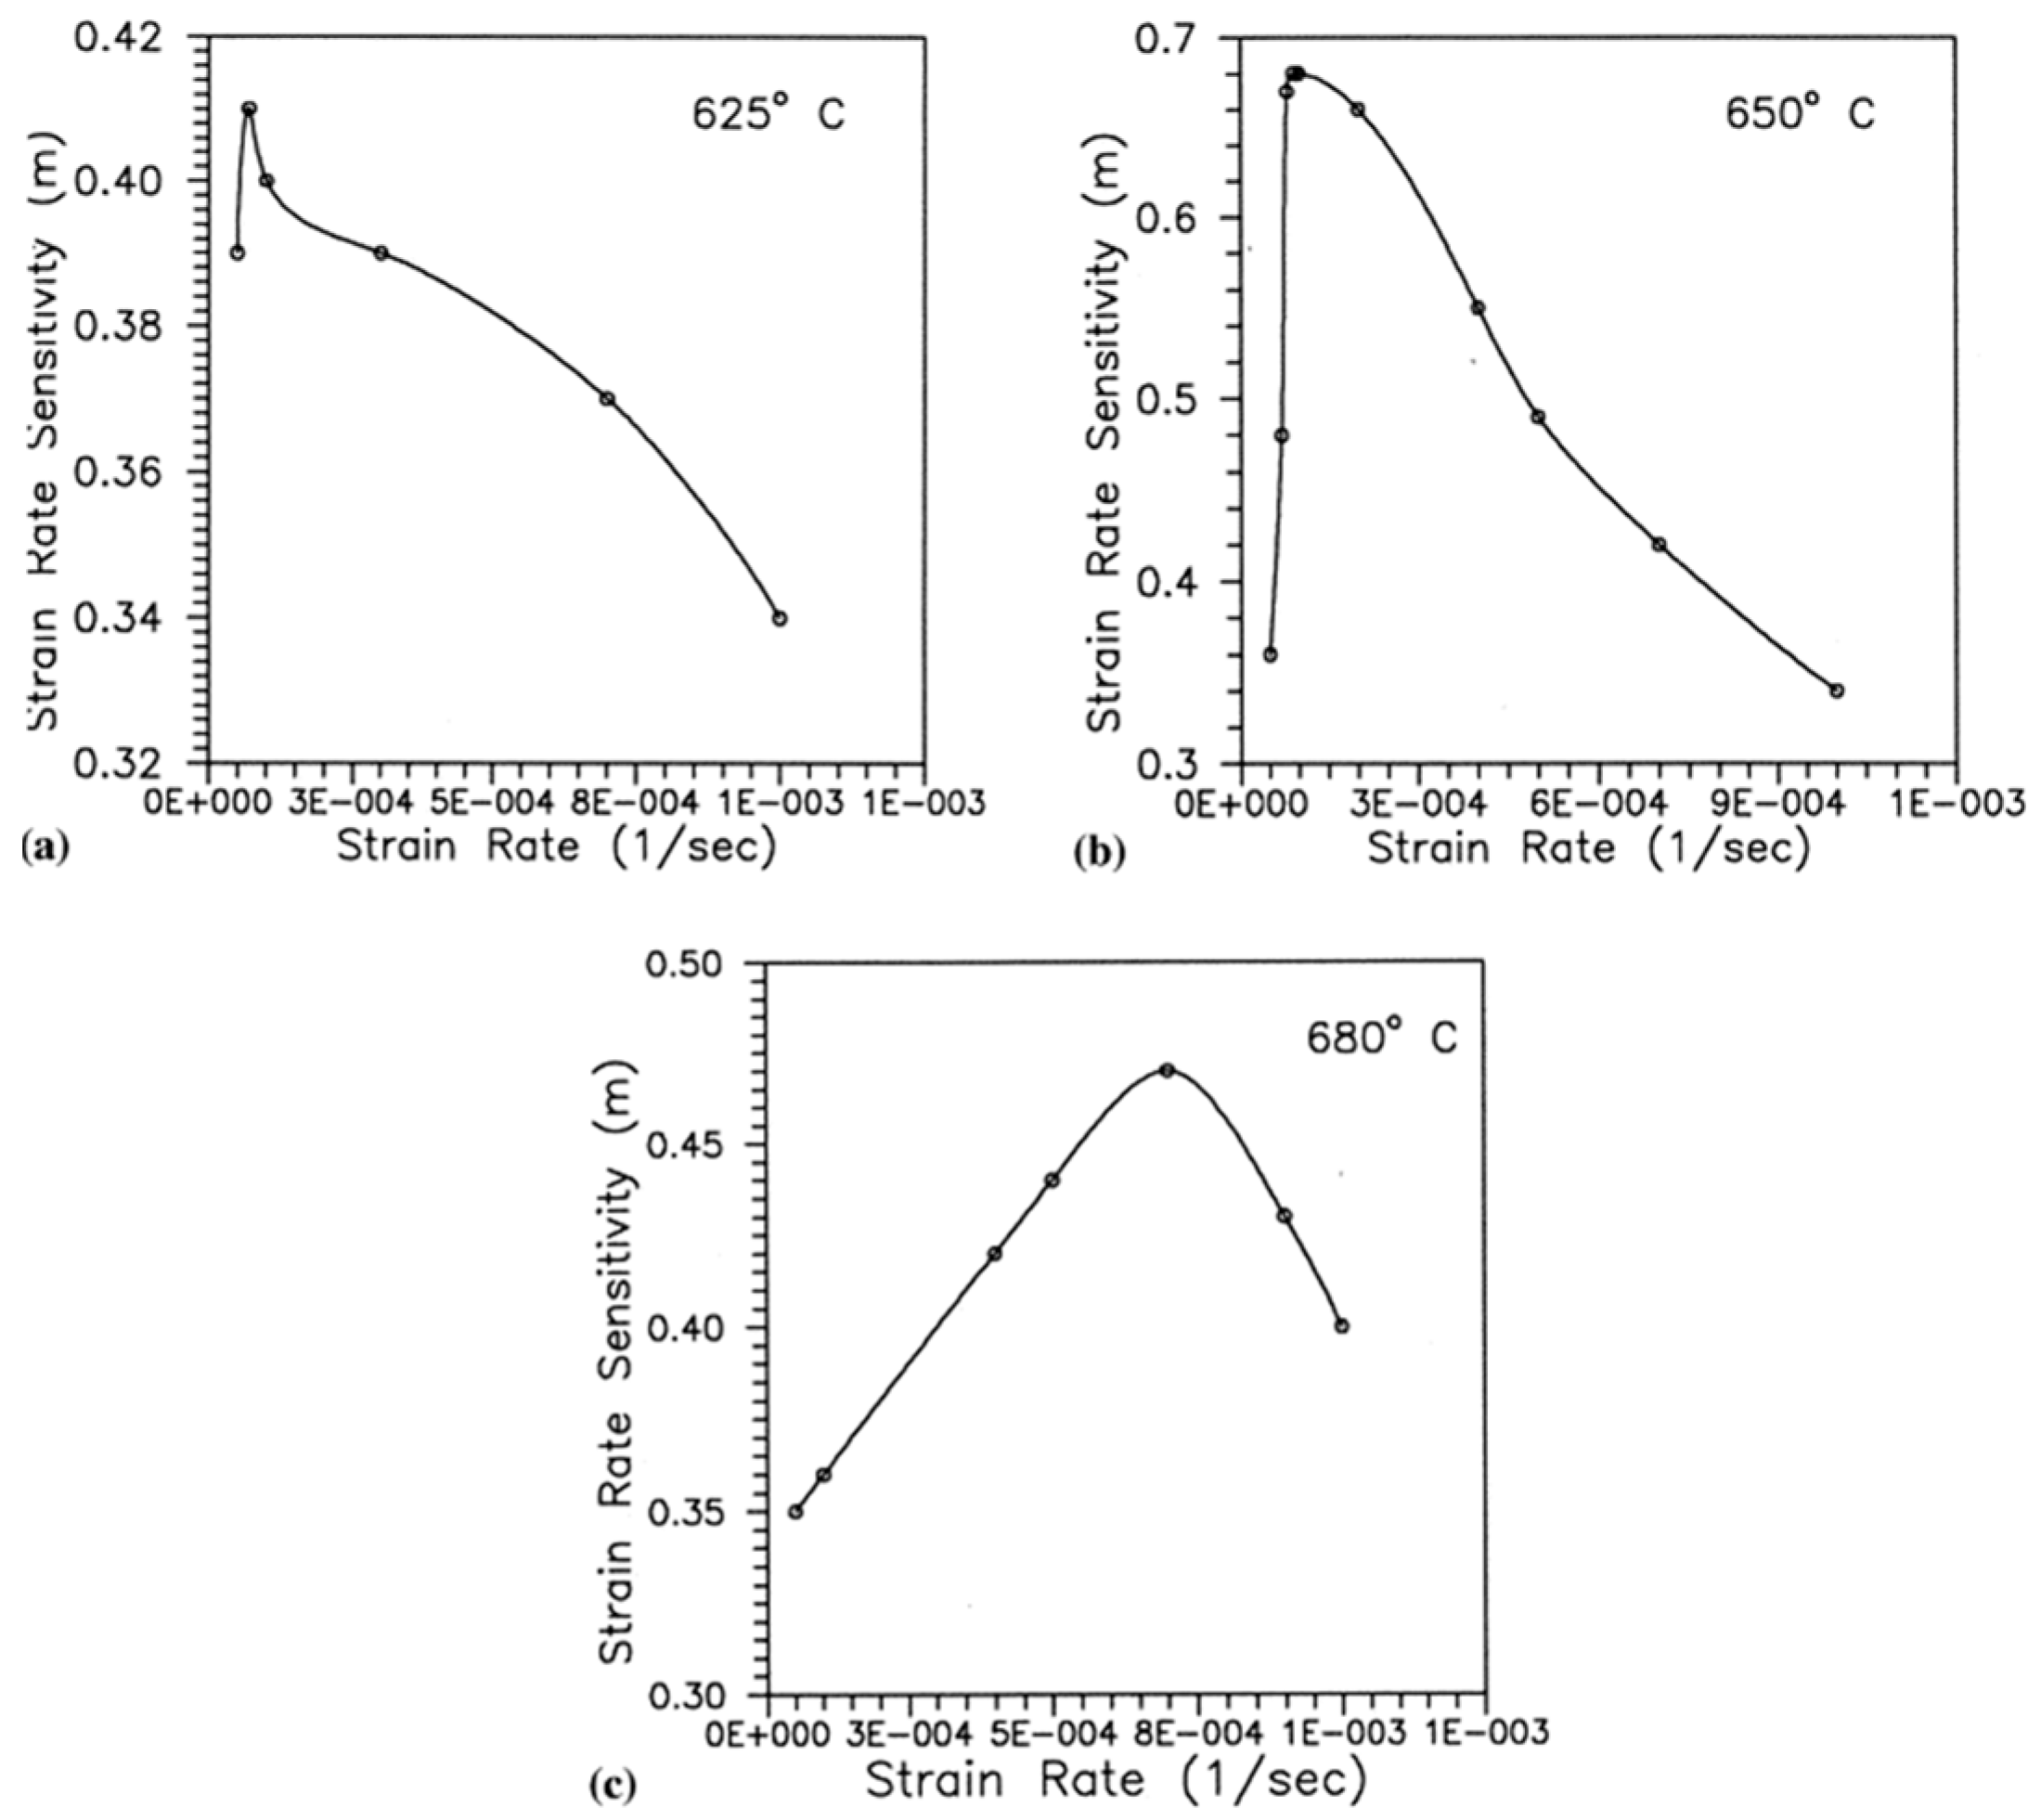
Figure 21. The effect of strain rate on strain-rate sensitivity: (a) 625 °C, (b) 650 °C, and (c) 680 °C [55].
The deformation behaviour and the subsequent microstructural evolution in 1% carbon steel at ambient at different temperature regimes have been investigated by Banerjee et al. [56][57][58][59][60]. The authors reported an increase in the yield strength of the material with an increase in the quasi-static strain rate at all the temperatures. Additionally, the strain-hardening behaviour of the material exhibited an overall decreasing trend with an increase in the temperature, as shown in Figure 22. In their another study, the authors investigated the tension–compression asymmetric behaviour of 1% C steel at quasi-static strain rates and reported the variation in the DIMT phenomenon under tensile and compressive loading [61]. The DIMT phenomenon was reported to be rate dependent for tensile loaded specimens, whereas the phenomenon was found to be rate independent for compressive loaded specimens. The authors correlated this phenomenon with the variation in the molar volume as well as hydrostatic stresses developed during tensile and compressive loading. The high strain-rate deformation behaviour of high carbon (1%) steel at different temperatures (25, 100, and 175 °C) was also investigated by Banerjee et al. [59] using split-Hopkinson pressure bar testing machine. The authors reported an irregular trend in terms of ultimate strength and elongation with respect to temperature. Banerjee et al. also studied the various strengthening mechanisms in high carbon steel at low strain rates and reported an increase in the kernel average misorientation (KAM) values with an increase in the strain rate.
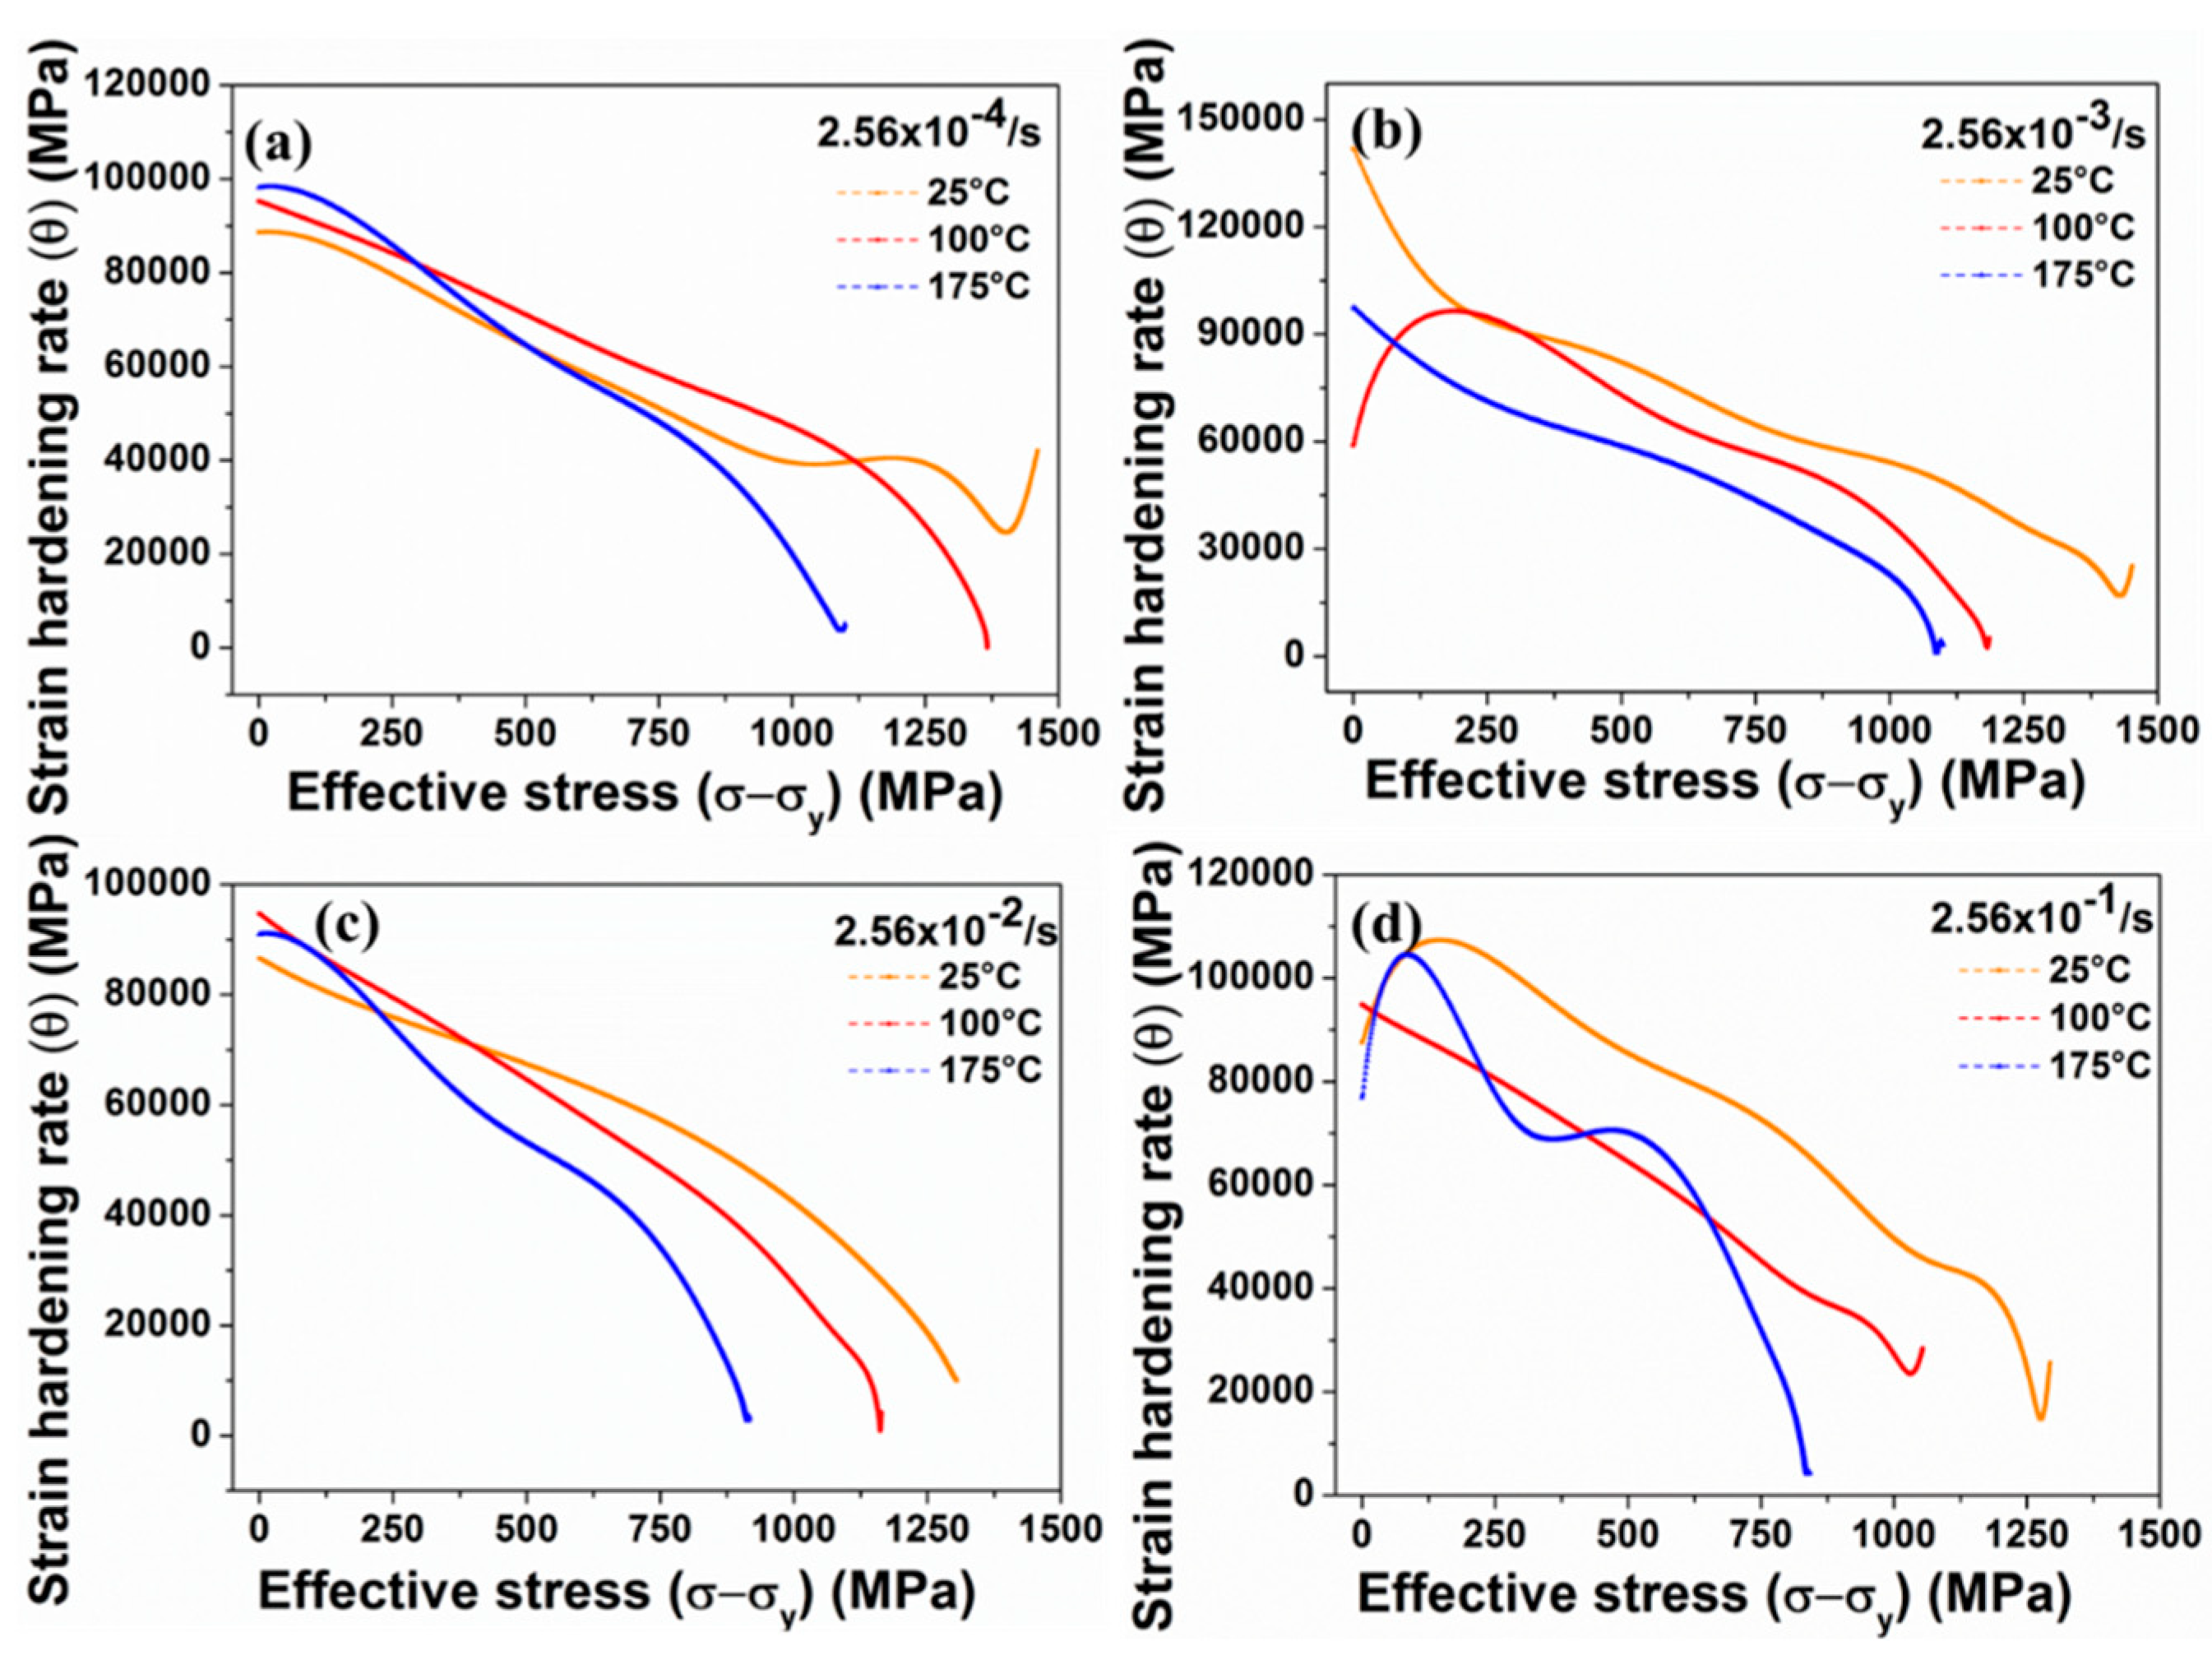
Figure 262. Strain-hardening rate as a function of effective stress at different temperatures and strain rates of (a) 2.56 × 10⁻⁴/s, (b) 2.56 × 10⁻³/s, (c) 2.56 × 10⁻²/s, and (d) 2.56 × 10⁻¹/s [57].
4. Dual-Phase (DP) Steel and Micro-Alloyed Steel
Dual-phase (DP) steel refers to the class of high-strength steel consisting of dispersed bainite or martensite in the soft ferrite matrix [62][63][64]. Martensite/bainite contributes to the hardness, whereas ferrite adds to the ductility of the DP steel. This microstructure results in an excellent combination of strength and ductility. The strain-hardening rates and energy-absorption capabilities of DP steels are also higher than the conventional high strength steel (HSS) grades of steel. DP steel possesses high strain-rate sensitivity and low yield to tensile strength ratio and is mostly used in automobile sectors. These steels are considered to have better deformability than other grades of AHSS steel with similar strength [65]. The mechanical properties of DP steel have been studied by many researchers [66][67][68][69][70][71]. Bag et al. [72] reported an excellent impact toughness of DP steel when the volume fraction of martensite is around 55%. Saeidi et al. [73] showed that the elongation and Charpy impact energy for bainite-34% ferrite dual-phase steel were found to be higher than the bainite and bainite-ferrite microstructures. Modi [74] reported that the volume fraction of ferrite and martensite significantly affect the wear characteristics of DP steel. In this section, the research work done on strain-rate behaviour of DP steel is critically reviewed.
Earlier studies have been carried out to investigate the effect of temperature and strain rates on the deformation behaviour of DP steels [75][76][77][78][79][80][81][82][83]. Cao et al. [75] performed tensile tests at varying strain rates (10−4 to 102 s−1) and temperature ranging from −60 to 100 °C on DP800 grade steel. The authors reported an increase in the yield as well as the ultimate tensile strength of the material with an increase in the strain rate and decrease in the temperature. Similar findings have been reported by other researchers [77][78][80]. Yu et al. [76] conducted quasi-static strain rate tests from 10−4 to 10−2 s−1 and dynamic tensile tests at strain rates 500, 1100, and 1600 s−1 for DP 600 steel and observed the yield strength at high strain rates to be approximately twice that in the quasi-static strain rates, as shown in Figure 23.
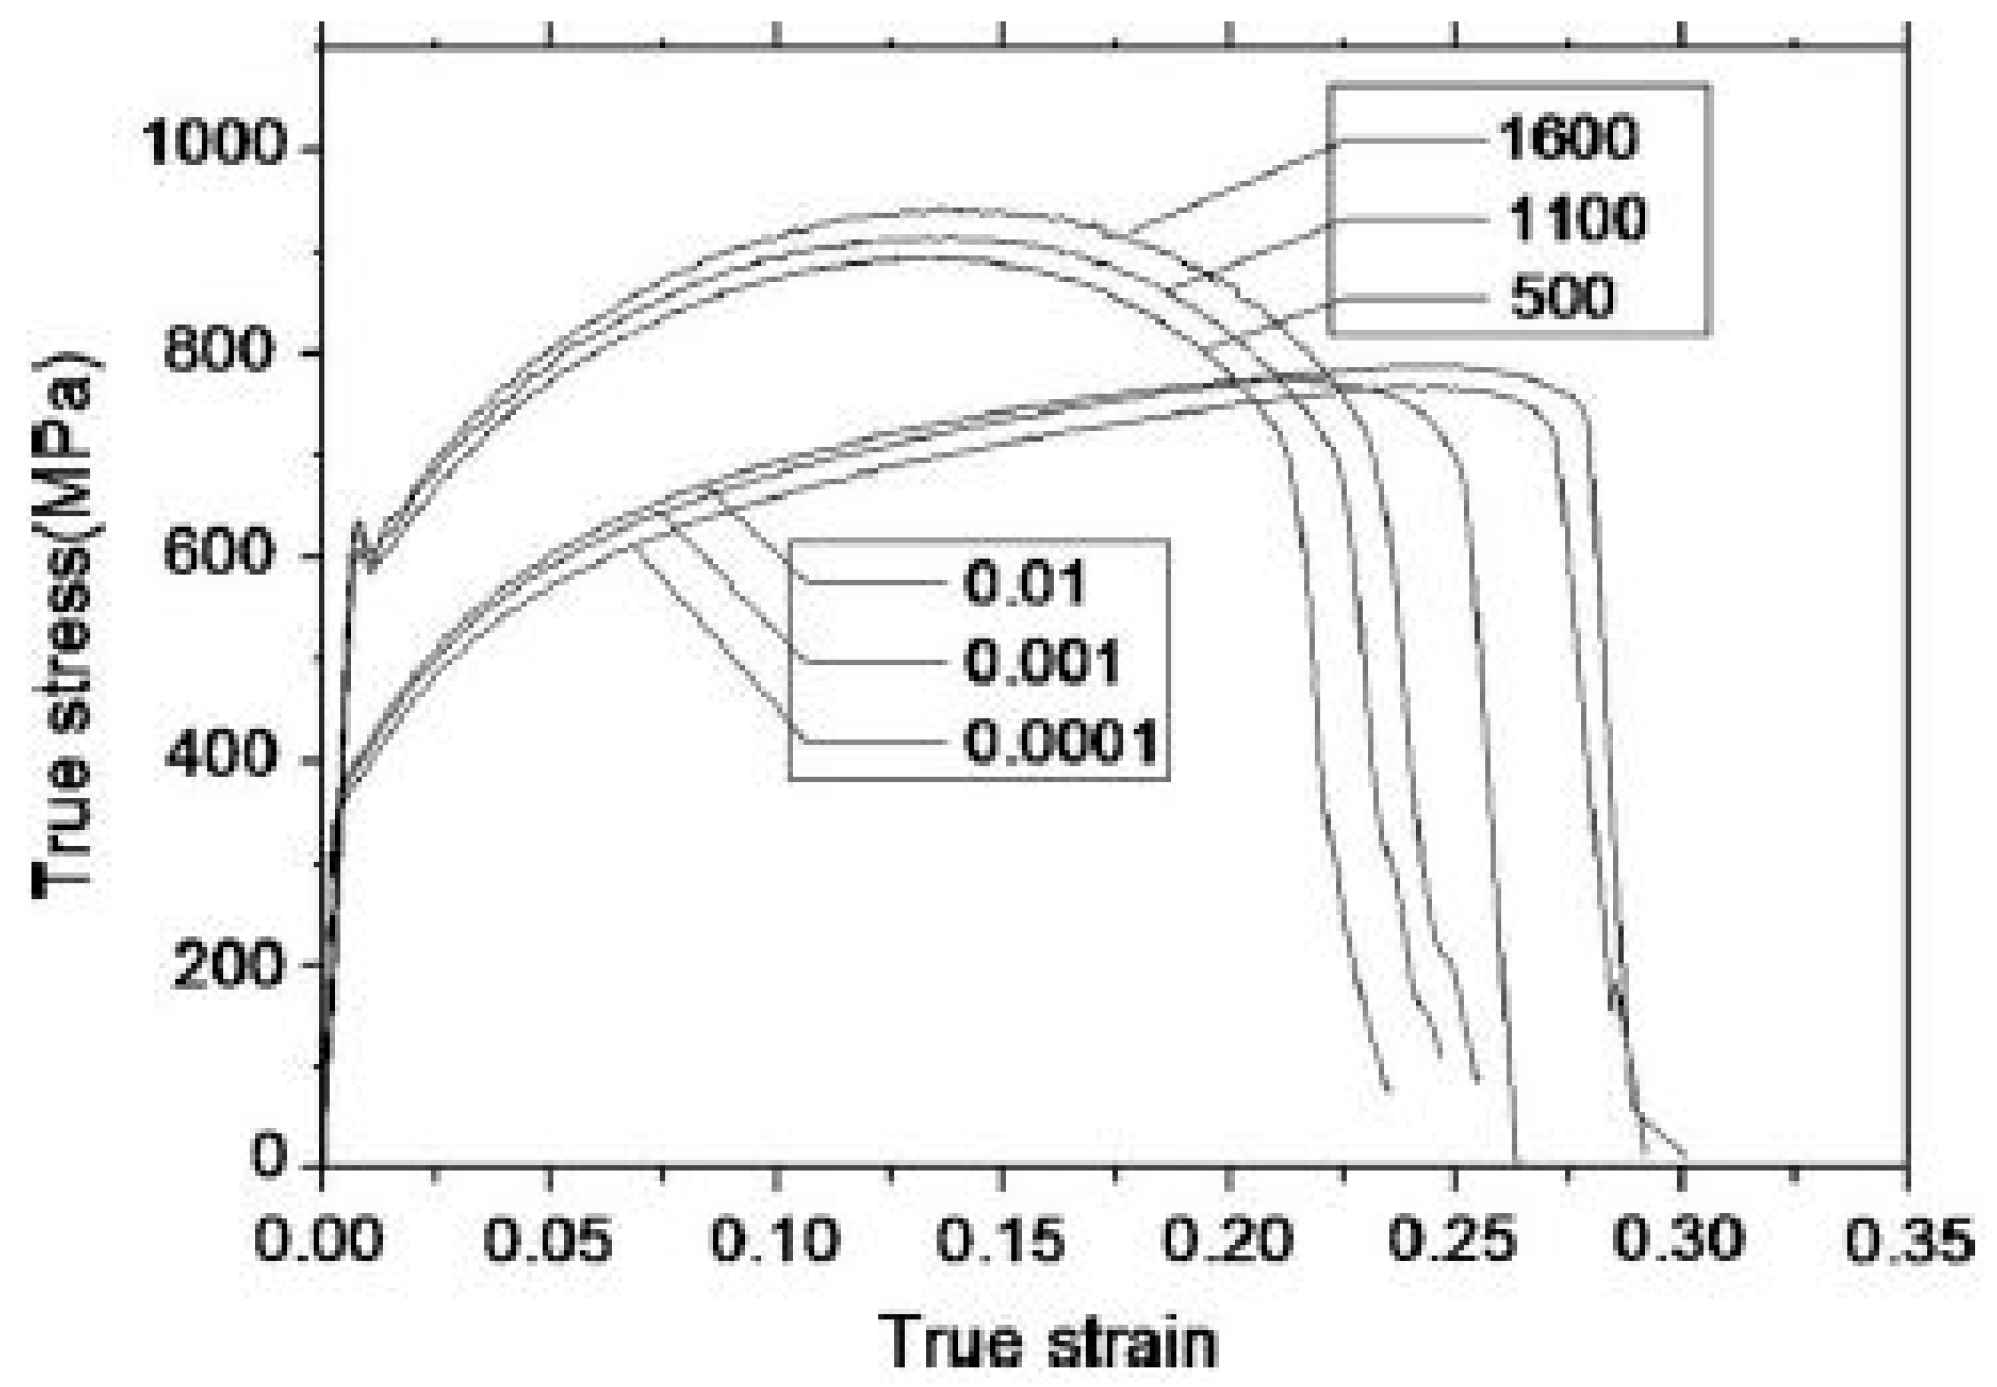
Figure 23. True stress–strain curve at different strain rates [76].
Tarigopula et al. [79] reported an increase in the dynamic flow rate of DP800 steel (C: 0.12%, Si: 0.20%, Mn: 1.50%, P: 0.015%, S: 0.002%, Nb: 0.015%, and rest FE) steel with the change in the strain rates. The authors also observed severely localized strains at high strain rates. Sachdev [81] investigated the effect of retained austenite (RA) on the deformation behaviour of DP steel and reported that the presence of RA significantly affects the strain-hardening exponent of DP steel. Dai et al. [82] reported two stages of a strain-hardening mechanism for DP1180 steel for strain rates ranging from 10−3 to 1750 s−1. The authors further observed the formation of dislocation cell blocks of 90 nm size and adiabatic temperature rise for higher strain rates. Rahmann et al. [83] conducted shear tests at varying strain rates from 0.01 to 600 s−1 for DP600 steel at room temperature. The authors reported that, beyond 50% of the shear strain, the steel showed negative strain-rate sensitivity at higher strain rates of 100 and 600 s−1, as shown in Figure 24.
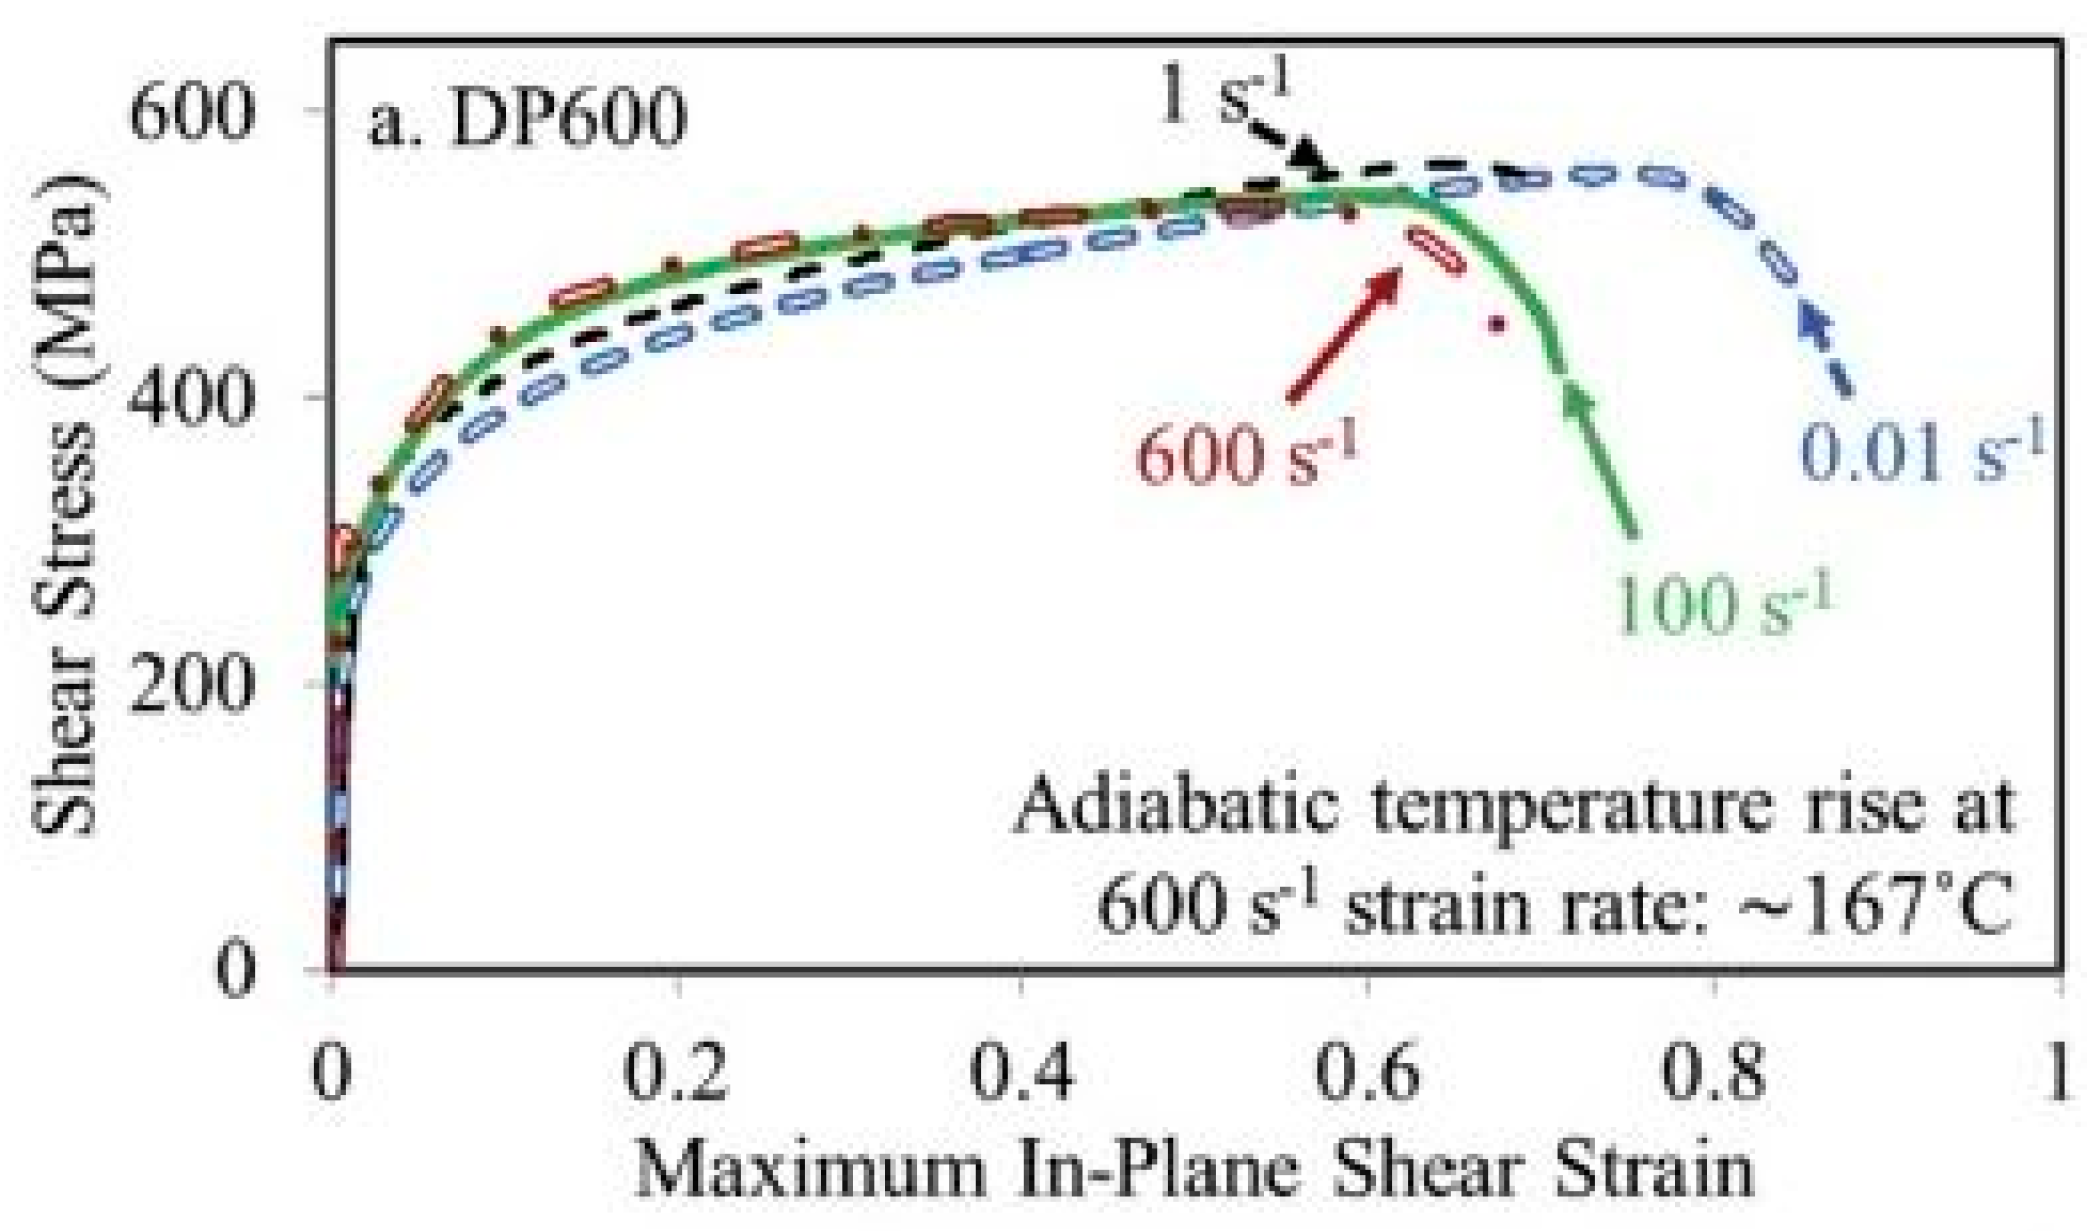
Figure 24. Effect of strain rate on the deformation behaviour during shear experiments for DP600 steel [83].
Hassannejadasl et al. [84] reported alteration in the flow surface for DP600 steel with a variation in the material anisotropy coefficients when subjected to various strain rates from 10−3 to 103 s−1. Huh et al. [85] investigated the effect of strain rates ranging from 0.003 to 200 s−1 on the deformation behaviour of DP600 and DP800 steel and found an increase in the flow stress with an increase in the strain rate. Misra et al. [86] conducted nano-indentation tests at different strain rates from 0.05 to 1 s−1 for an ultrafine Fe–0.95C–1.30Mn–0.91Si–0.23Cr DP steel at room temperature and observed a high strain-rate sensitivity with twinning as the major controlling mechanism for the deformation of material. Samuel et al. [87] described the strain-hardening behaviour of uniaxially deformed dual-phase steel by a modified Crussard-Jaoul (C-J) analysis and reported an increase in the yield strength, ultimate tensile strength, and work-hardening rate with an increase in the strain rate.
The effect of strain rates on the fracture and deformation behaviour of DP600 base metal (BM) containing 0.061% C and its welded joint (WJ) was investigated by Dong et al. [88]. The authors carried out quasi-static and dynamic tensile tests at varying strain rates extending from 0.001 to 1133 s−1. The yield as well as the ultimate strength of the material exhibited an increasing trend with an increase in the strain rate, as shown in Figure 25. However, the author observed no significant change in the fracture behaviour for the base as well as the weld material.
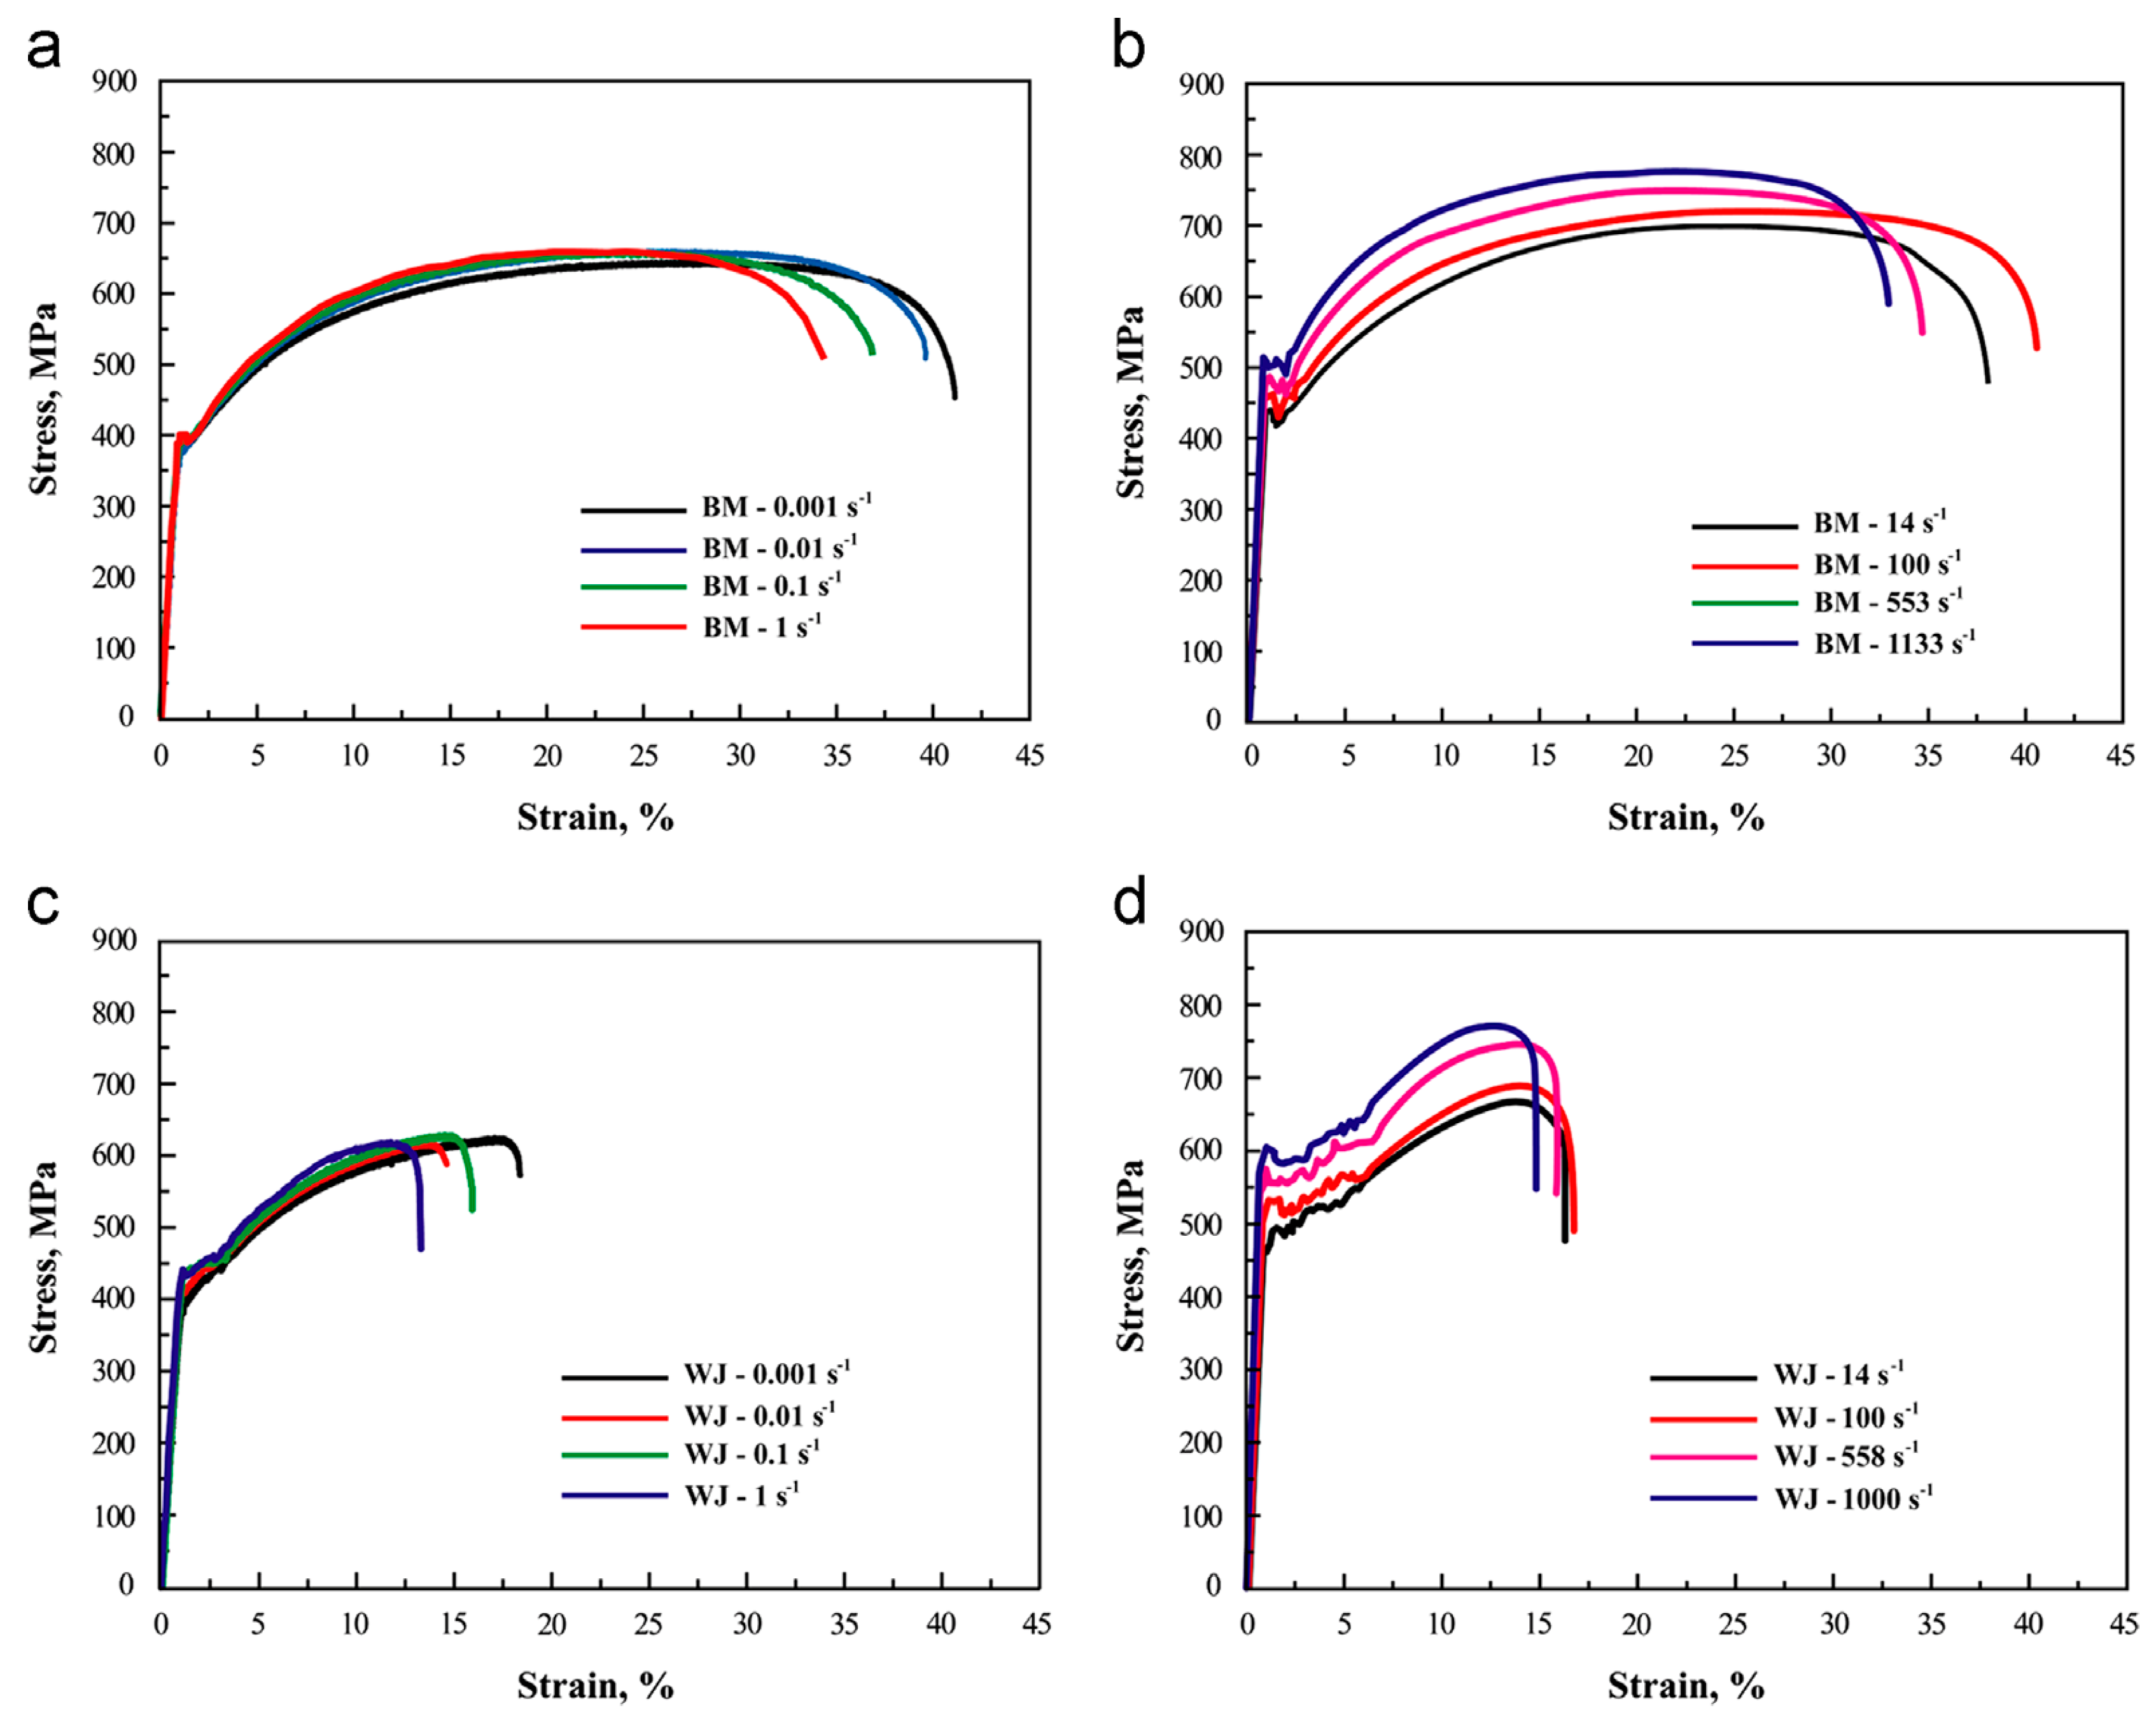
Figure 25. Stress–strain curves for (a) DP600 base metal (BM) tested at strain rates from 0.001 to 1 s−1, (b) DP600 BM tested at strain rates from 14 to 1133 s−1, (c) DP600WJ tested at strain rates from 0.001 to 1 s−1, and (d) DP600 WJ tested at strain rates from 14 to 1000 s−1 [88].
Several other studies have been carried out on the deformation behaviour of DP780 steel at different strain rates [89][90][91]. Huh et al. [89] investigated the effect of strain rate on the plastic anisotropy of DP780 steel and reported a reduction in the plastic anisotropy with an increase in the strain rate. They further developed a new method to quantify the r-value (plastic strain ratio) with the help of digital image correlation (DIC). The effect of stress triaxiality and strain rate (10−3 to 1500/s) on the deformation behaviour of DP780 steel was investigated by Anderson et al. [90]. The material exhibited an increase in the failure strain with the increase in the stress triaxiality, as shown in Figure 26. In addition, the strain-rate sensitivity was observed to be mostly positive for all conditions with a slightly negative for uniaxial specimens up to strain rates of 10−1 s−1, as shown in Figure 27.
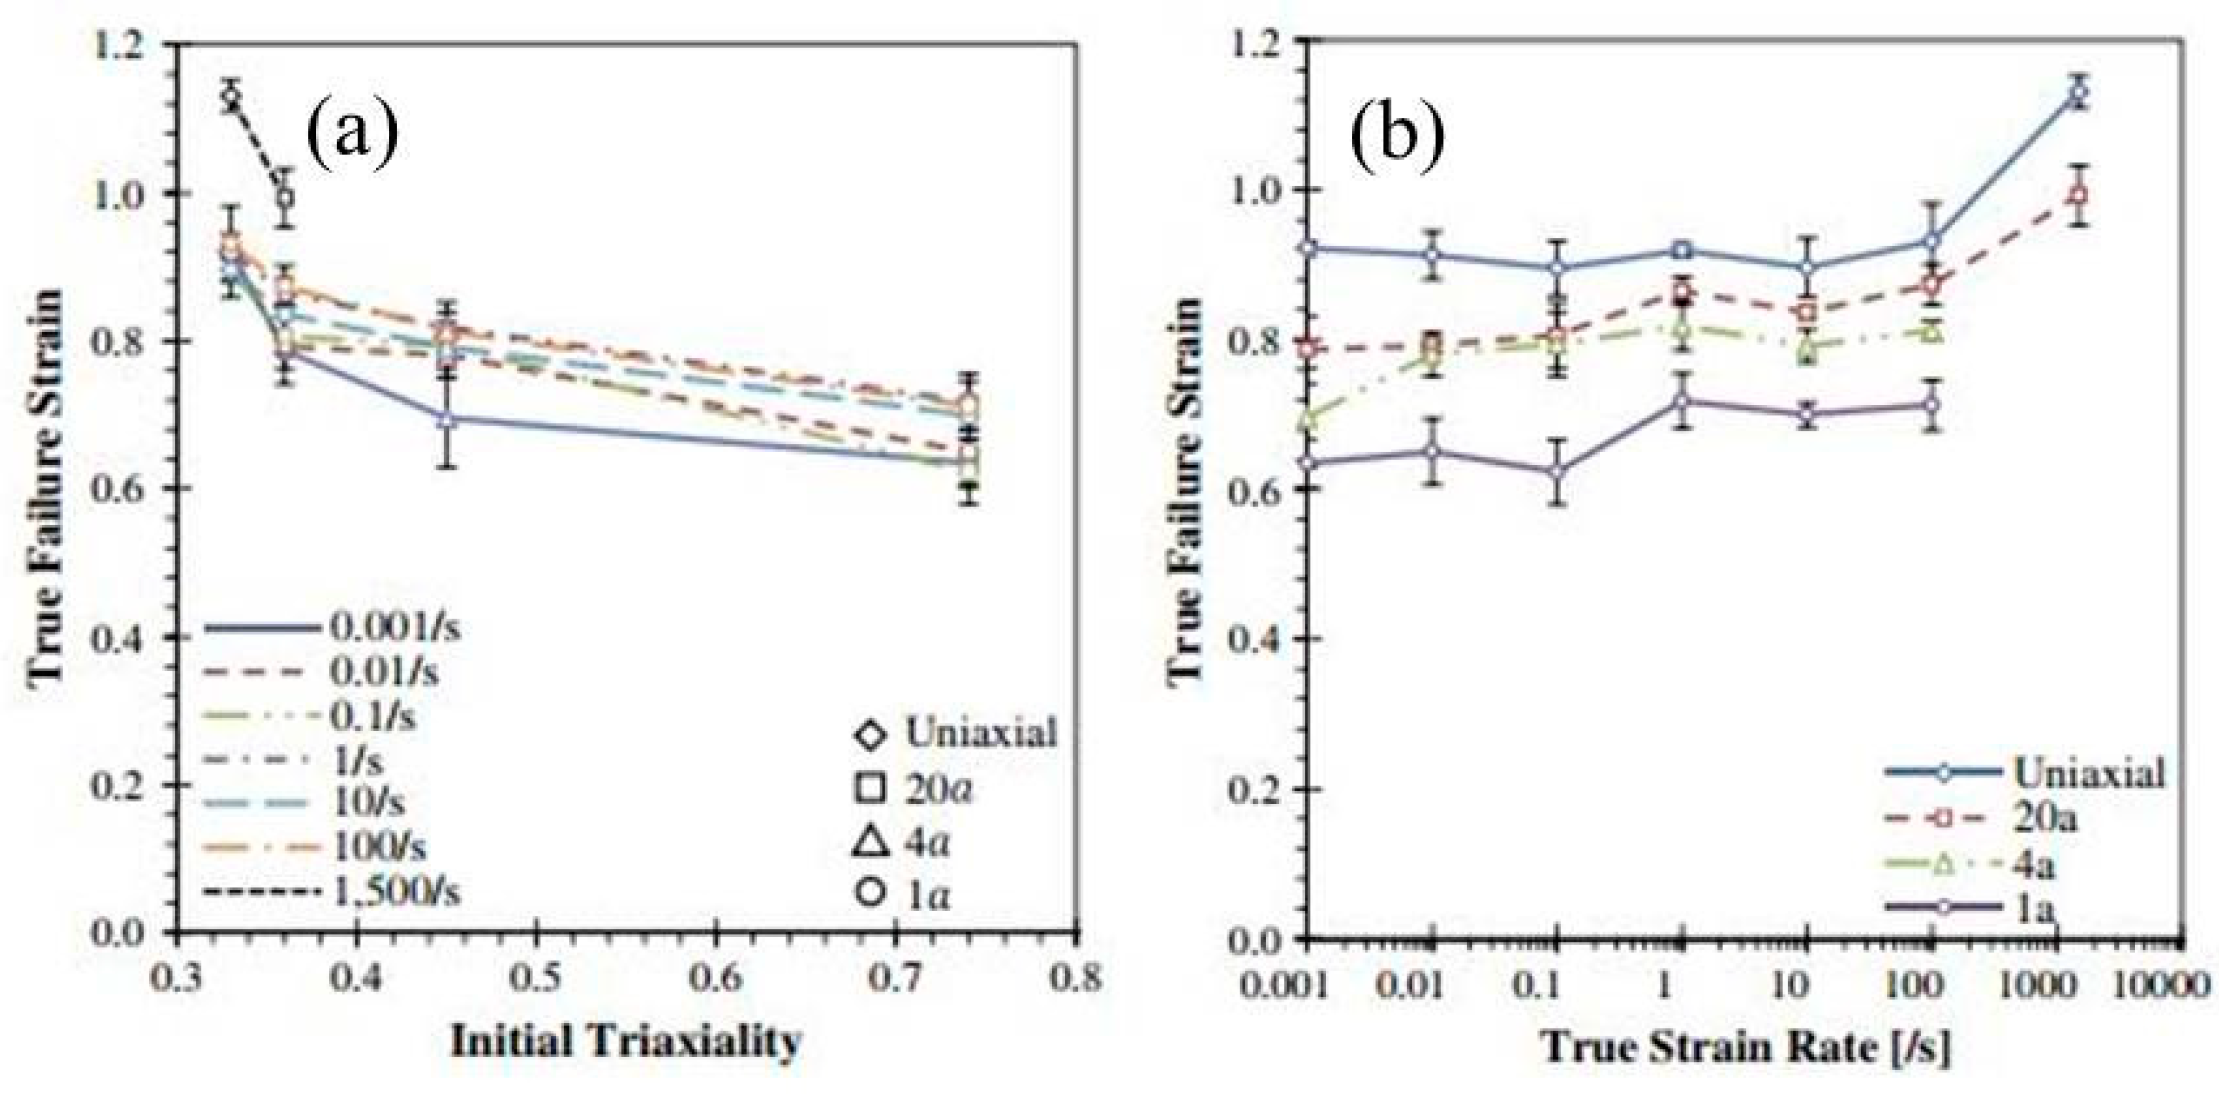
Figure 26. True failure strain as a function of (a) stress triaxiality and (b) true strain rate [90].
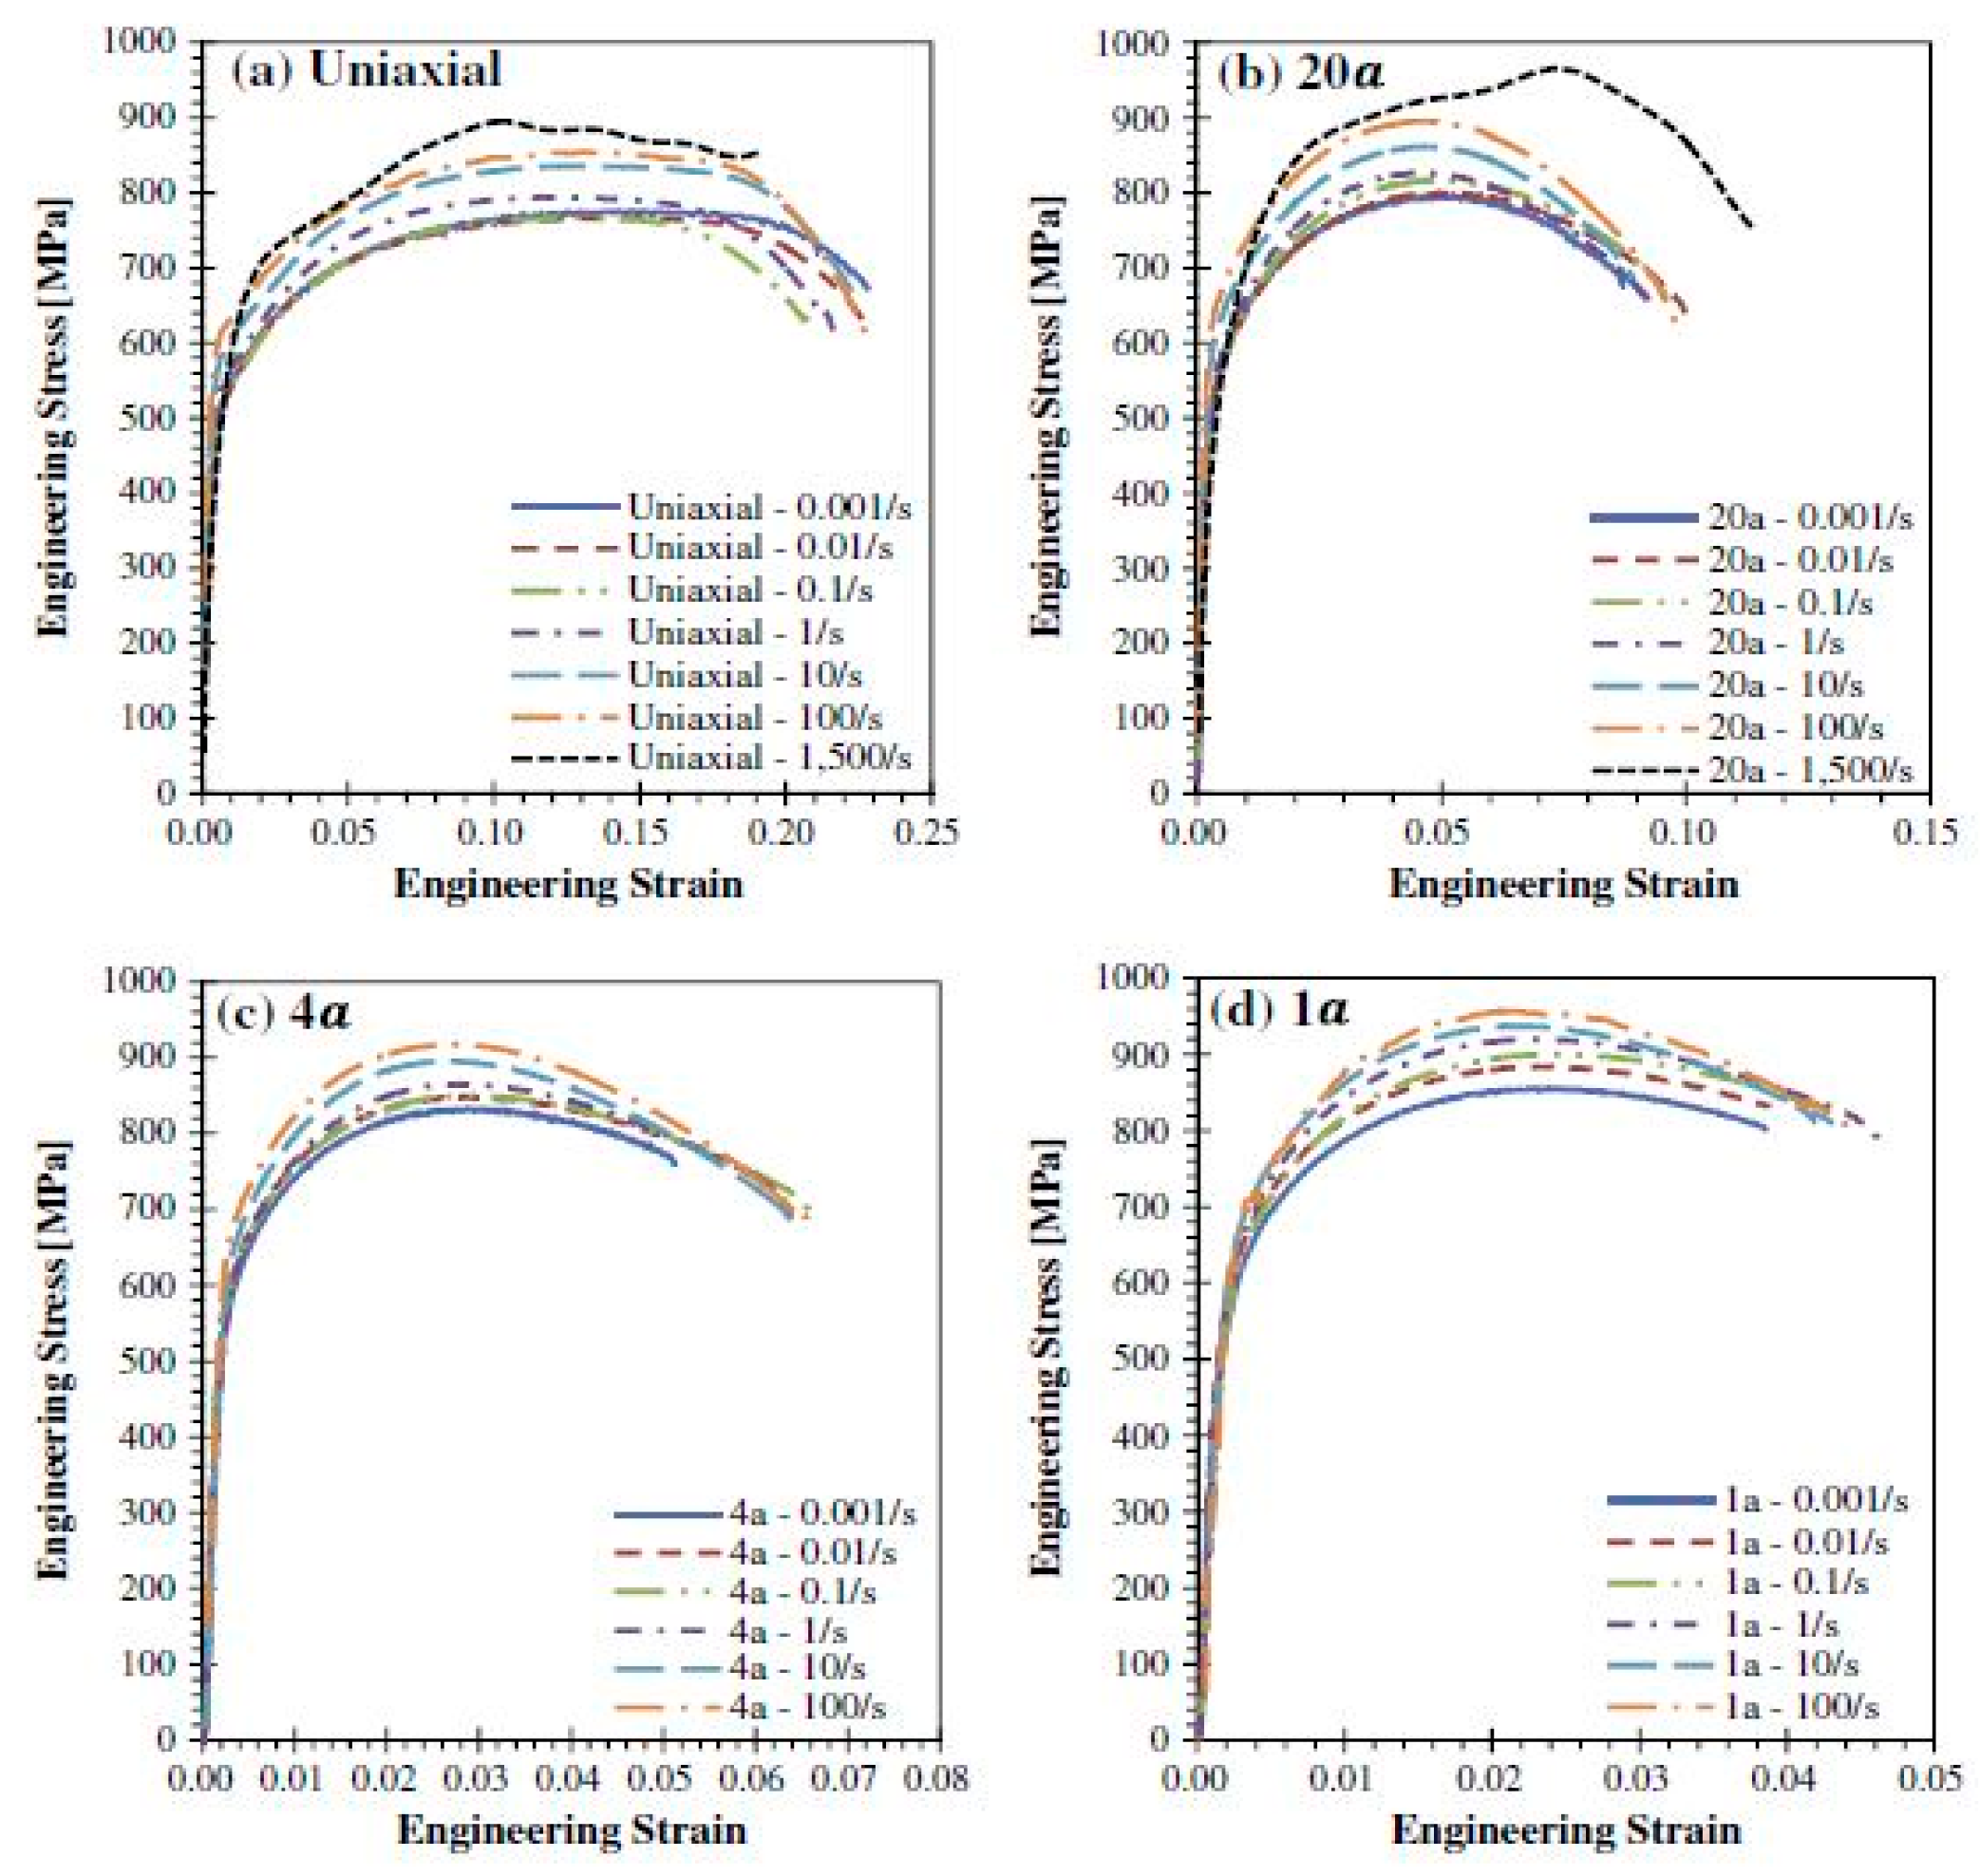
Figure 27. Stress strain curve of DP780 steel for (a) uniaxial test, (b) 17.5-mm notch specimen, (c) 3.5-mm notch specimen, and (d) 1-mm notch specimen [90].
Kim et al. [91] conducted high strain-rate experiments on DP780 and 980 steel ranging from 10−1 to 500 s−1 and observed a significant change in the yield strength and ultimate tensile strength with the change in the strain rate. Tarigopula et al. [92] conducted static and dynamic tensile tests on DP800 steel and reported an increase in the flow stress with an increase in strain rate from 10−3 to 500 s−1.
Das et al. [93][94] investigated the deformation behaviour of DP600 and DP800 grades of steel at varying strain rates from 10−3 to 800 s−1 and found an increase in the yield strength and ultimate tensile strength for both DP600 and DP800 steel with the increase in the strain rate. It was observed that the rate of increase in the strength of these steels was higher in higher strain rate regimes (≥100 s−1) as compared to lower strain rates (shown in Figure 28).
Figure 28. (a) Stress–strain curves for dual-phase (DP) 600, (b) stress–strain curves for DP 800, and (c) variation in the yield and ultimate tensile strength of DP600 and DP800 steel as a function of strain rate [93].
Sato et al. [95] investigated the deformation behaviour of DP590, DP 980, and DP 1180 grades of steel for varying strain rates (10−3, 101, and 102 s−1) The fracture strains for all the three grades of DP steel were found to be independent of the strain rate. It was further observed that the strain rate played a significant role in the strain localization for DP590 steel, whereas for DP980 and DP1180, steel the influence of strain rate on the strain localization was found to a minimum.
The effects of microstructure on the strain-rate deformation behaviour of DP steels have been carried out by many researchers [90][93][96][97][98]. Anderson [90] reported the presence of dimples and shear lips along with the formation of transverse cracks of DP800 steel when subjected to varying strain rates.
Berbenni et al. [98] investigated the influence of the microstructure of DP500 and DP600 steel containing 10 and 15% martensite on its dynamic deformation behaviour when subjected to strain rates varying from 10−3 to 100 s−1 and reported that the increase in the martensitic content increases the stress with an increase in the strain rate. Queiroz et al. [99] investigated the strain ageing behaviour of a 0.10% C dual-phase steel by conducting static tensile tests at varying strain rates from 5 × 10⁻⁴ to 10−2 s−1 and temperature from 25 °C to 600 °C. Serrations were observed in the stress–strain curve between 155–250 °C for 10−3 s−1 strain rate (shown in Figure 29), which in turn signifies the Portevin–Le Chatelier PLC effect.
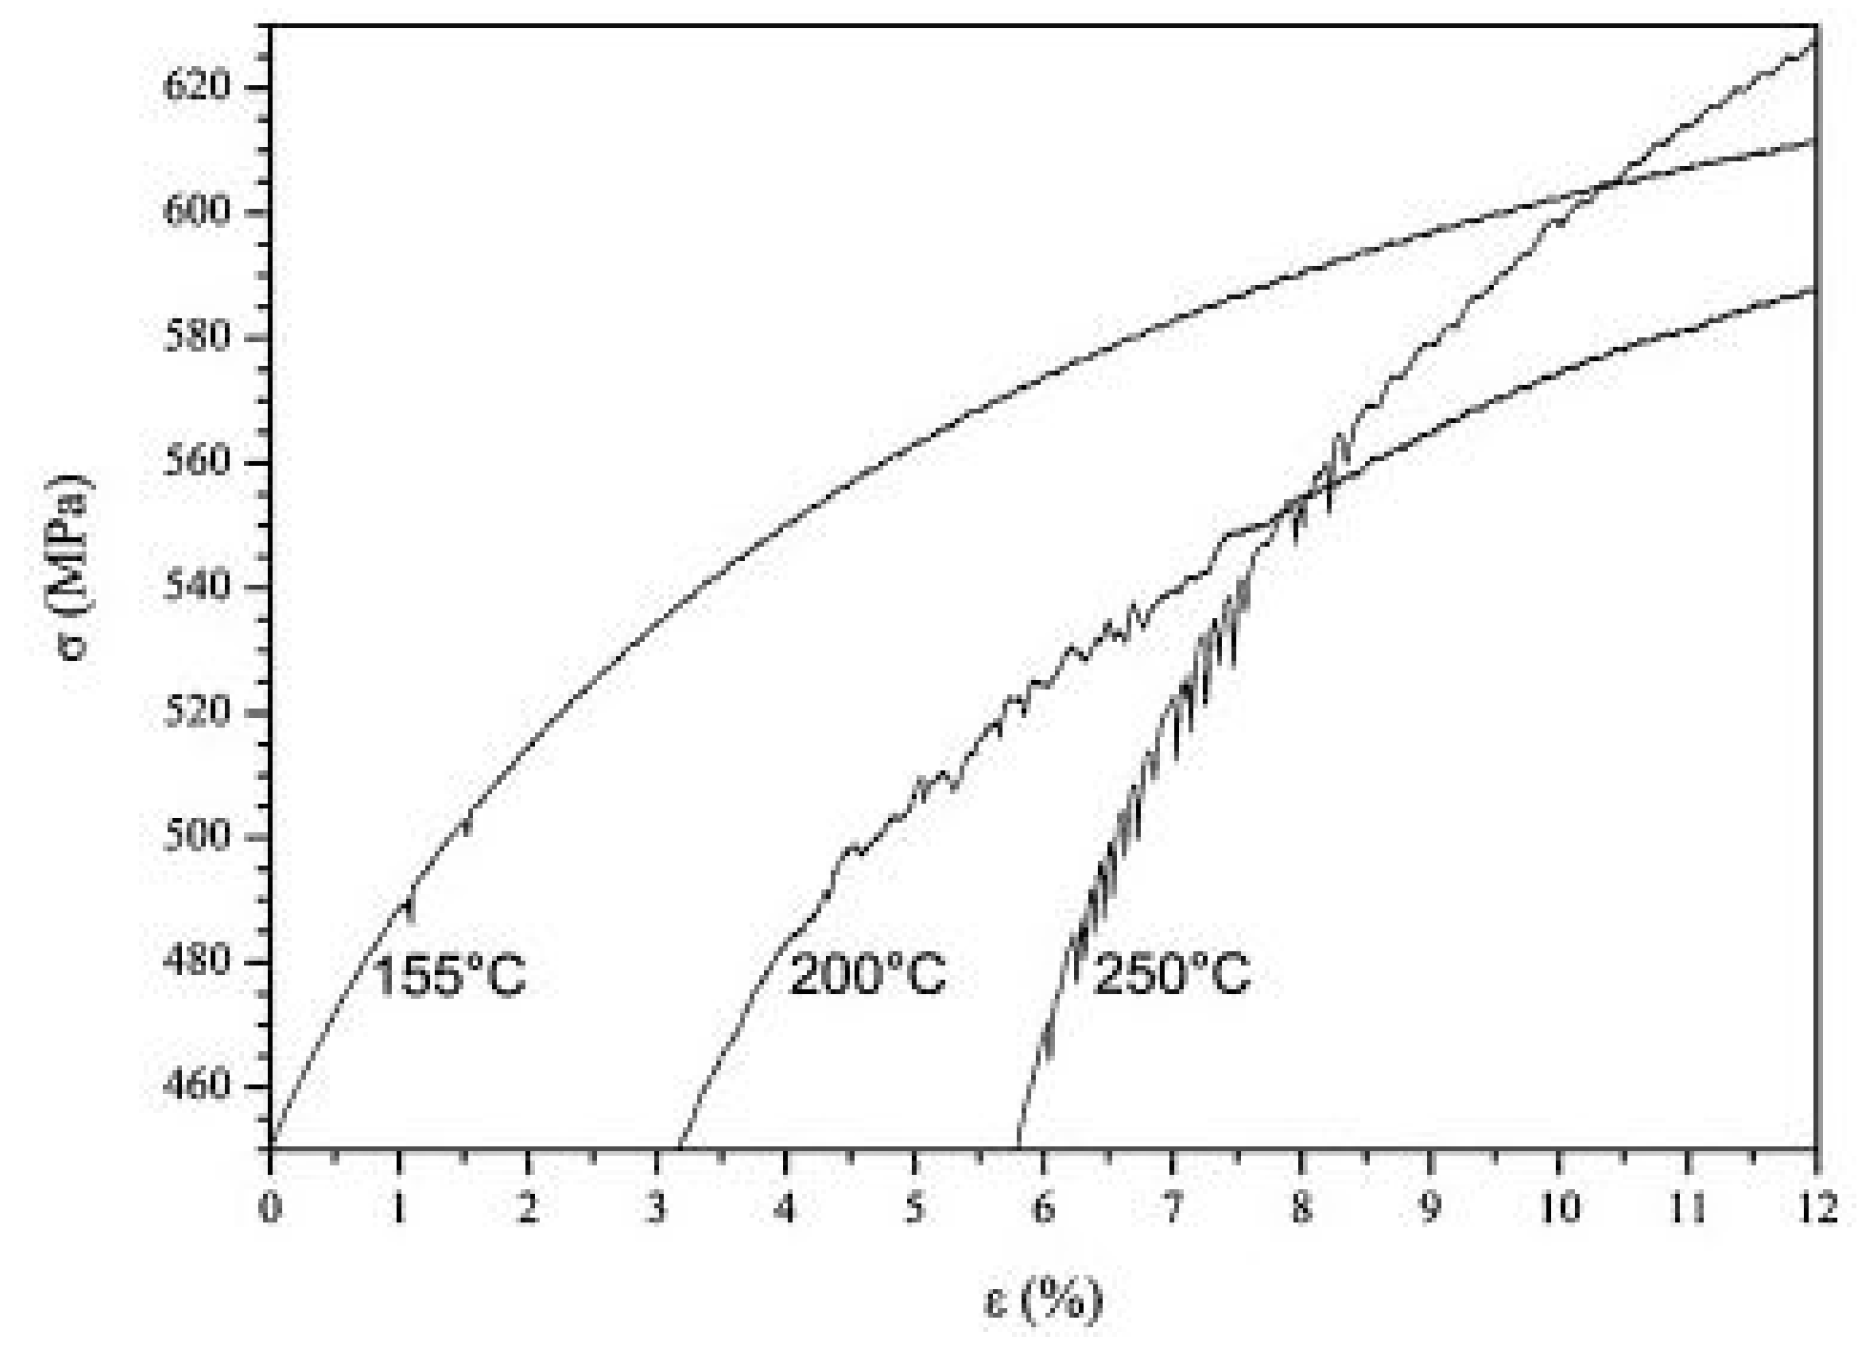
Figure 29. Serrations in the stress–strain curves at a strain rate of 10−3 s−1 at different temperature for 0.10%C DP steel [99].
Kim et al. [100] conducted uniaxial tests to investigate the relationship between strain rate (10−3 to 100 s−1) and formability of two steel sheets of CQ and DP590 grades. DP590 steel exhibited an increase in the flow stress with an increase in strain rate. Furthermore, the total elongation of DP steel exhibited an increasing trend for high strain rates ranging from 0.1–100 s−1, whereas for quasi-static strain rates (10−3 to 10−1 s−1), DP steel exhibited a decreasing trend. The authors attributed the change in the dislocation structure and local strain-rate hardening at high-speed deformation as major reasons for the increase in total elongation at higher strain rates.
Micro-alloyed steels are low alloy steels containing carbides or carbonitride-forming elements such as niobium, vanadium, titanium, etc. in a small amount for refining the grain refinement and precipitation strengthening resulting in an increase in the yield strength of the steels. Micro-alloyed steels are considered a subclass of HSLA steels. Micro-alloyed steels are widely used in automobile sectors due to their higher strength [101].
References
- Tsuchida, N.; Nakano, H.; Okamoto, T.; Inoue, T. Effect of strain rate on true stress–true strain relationships of ultrafine-grained ferrite–cementite steels up to plastic deformation limit. Mater. Sci. Eng. A 2015, 626, 441–448.
- Paul, S.K.; Raj, A.; Biswas, P.; Manikandan, G.; Verma, R.K. Tensile flow behavior of ultra low carbon, low carbon and micro alloyed steel sheets for auto application under low to intermediate strain rate. Mater. Des. 2014, 57, 211–217.
- Korkolis, Y.P.; Mitchell, B.R.; Locke, M.R.; Kinsey, B.L. Plastic flow and anisotropy of a low-carbon steel over a range of strain-rates. Int. J. Impact Eng. 2018, 121, 157–171.
- Campbell, J.D.; Ferguson, W.G. The temperature and strain-rate dependence of the shear strength of mild steel. Philos. Mag. 1970, 21, 63–82.
- Klepaczko, J.R. An experimental technique for shear testing at high and very high strain rates. The case of a mild steel. Int. J. Impact Eng. 1994, 15, 25–39.
- Hurley, P.J.; Hodgson, P.D. Formation of ultra-fine ferrite in hot rolled strip: Potential mechanism for grain refinement. Mater. Sci. Eng. A 2001, 302, 206–214.
- Yada, H.; Li, C.M.; Yamagata, H. Dynamic γ→α transformation during hot deformation in iron-nickel-carbon alloys. ISIJ Int. 2000, 40, 200–206.
- Ok, S.Y.; Park, J.K. Dynamic austenite-to-ferrite transformation behavior of plain low carbon steel within (γ + α) 2-phase field at low strain rate. Scr. Mater. 2005, 52, 1111–1116.
- Chung, J.H.; Park, J.K.; Kim, T.H.; Kim, K.H.; Ok, S.Y. Study of deformation-induced phase transformation in plain low carbon steel at low strain rate. Mater. Sci. Eng. A 2010, 527, 5072–5077.
- Rizhi, W.; Lei, T.C. Substructural evolution of ferrite in a low carbon steel during hot deformation in (F+A) two-phase range. Scr. Metall. Et Mater. 1993, 28, 629–632.
- Shakerifard, B.; Lopez, J.G.; Legaza, M.C.T.; Verleysen, P.; Kestens, L.A. Strain rate dependent dynamic mechanical response of bainitic multiphase steels. Mater. Sci. Eng. A 2019, 745, 279–290.
- Tiamiyu, A.A.; Odeshi, A.G.; Szpunar, J.A. Multiple strengthening sources and adiabatic shear banding during high strain-rate deformation of AISI 321 austenitic stainless steel: Effects of grain size and strain rate. Mater. Sci. Eng. A 2018, 711, 233–249.
- Bloniarz, R.; Majta, J.; Trujillo, C.; Cerreta, E.; Muszka, K. The mechanisms for strengthening under dynamic loading for low carbon and microalloyed steel. Int. J. Impact Eng. 2018, 114, 53–62.
- Jiang, M.; Devincre, B.; Monnet, G. Effects of the grain size and shape on the flow stress: A dislocation dynamics study. Int. J. Plast. 2019, 113, 111–124.
- Ohmori, A.; Torizuka, S.; Nagai, K.; Koseki, N.; Kogo, Y. Effect of deformation temperature and strain rate on evolution of ultrafine grained structure through single-pass large-strain warm deformation in a low carbon steel. Mater. Trans. 2004, 45, 2224–2231.
- Medina, S.F.; Hernandez, C.A. General expression of the Zener-Hollomon parameter as a function of the chemical composition of low alloy and microalloyed steels. Acta Mater. 1996, 44, 137–148.
- Razmpoosh, M.H.; Zarei-Hanzaki, A.; Imandoust, A. Effect of the Zener–Hollomon parameter on the microstructure evolution of dual phase TWIP steel subjected to friction stir processing. Mater. Sci. Eng. A 2015, 638, 15–19.
- Li, Y.S.; Zhang, Y.; Tao, N.R.; Lu, K. Effect of the Zener–Hollomon parameter on the microstructures and mechanical properties of Cu subjected to plastic deformation. Acta Mater. 2009, 57, 761–772.
- Narayana Murty, S.V.S.; Torizuka, S.; Nagai, K.; Kitai, T.; Kogo, Y. Grain boundary diffusion controlled ultrafine grain formation during large strain-high Z deformation of coarse (200 μm) grained ultra-low carbon steel. Mater. Sci. Eng. A 2007, 457, 162–168.
- Murty, S.V.S.N.; Torizuka, S.; Nagai, K.; Kitai, T.; Kogo, Y. Dynamic recrystallization of ferrite during warm deformation of ultrafine grained ultra-low carbon steel. Scr. Mater. 2005, 53, 763–768.
- Kang, J.-H.; Torizuka, S. Dynamic recrystallization by large strain deformation with a high strain rate in an ultralow carbon steel. Scr. Mater. 2007, 57, 1048–1051.
- Rajput, S.K.; Chaudhari, G.P.; Nath, S.K. Characterization of hot deformation behavior of a low carbon steel using processing maps, constitutive equations and Zener-Hollomon parameter. J. Mater. Process. Technol. 2016, 237, 113–125.
- Rajput, S.K.; Dikovits, M.; Chaudhari, G.P.; Poletti, C.; Warchomicka, F.; Pancholi, V.; Nath, S.K. Physical simulation of hot deformation and microstructural evolution of AISI 1016 steel using processing maps. Mater. Sci. Eng. A 2013, 587, 291–300.
- Gao, X.J.; Jiang, Z.Y.; Wei, D.B.; Li, H.J.; Jiao, S.H.; Xu, J.; Zhang, X.M.; Han, J.T.; Chen, D.F. Constitutive analysis for hot deformation behaviour of novel bimetal consisting of pearlitic steel and low carbon steel. Mater. Sci. Eng. A 2014, 595, 1–9.
- Xie, Z.-X.; Gao, H.-Y.; Wang, J.; Yu, Y.; Fang, Y.; Sun, B.-D. Static Recrystallization Behavior of Twin Roll Cast Low-Carbon Steel Strip. J. Iron Steel Res. Int. 2011, 18, 45–51.
- Wang, J.; Xiao, H.; Xie, H.; Xu, X.; Gao, Y. Study on hot deformation behavior of carbon structural steel with flow stress. Mater. Sci. Eng. A 2012, 539, 294–300.
- Li, X.; Li, J.; Ding, W.; Zhao, S.; Chen, J. Stress Relaxation in Tensile Deformation of 304 Stainless Steel. J. Mater. Eng. Perform. 2017, 26, 630–635.
- Hariharan, K.; Majidi, O.; Kim, C.; Lee, M.G.; Barlat, F. Stress relaxation and its effect on tensile deformation of steels. Mater. Des. 2013, 52, 284–288.
- Tsuchida, N.; Masuda, H.; Harada, Y.; Fukaura, K.; Tomota, Y.; Nagai, K. Effect of ferrite grain size on tensile deformation behavior of a ferrite-cementite low carbon steel. Mater. Sci. Eng. A 2008, 488, 446–452.
- Sun, H.B.; Yoshida, F.; Ohmori, M.; Ma, X. Effect of strain rate on Lüders band propagating velocity and Lüders strain for annealed mild steel under uniaxial tension. Mater. Lett. 2003, 57, 4535–4539.
- Xu, Y.B.; Bai, Y.L.; Xue, Q.; Shen, L.T. Formation, microstructure and development of the localized shear deformation in low-carbon steels. Acta Mater. 1996, 44, 1917–1926.
- Saadatkia, S.; Mirzadeh, H.; Cabrera, J.-M. Hot deformation behavior, dynamic recrystallization, and physically-based constitutive modeling of plain carbon steels. Mater. Sci. Eng. A 2015, 636, 196–202.
- Duan, C.Z.; Zhang, L.C. Adiabatic shear banding in AISI 1045 steel during high speed machining: Mechanisms of microstructural evolution. Mater. Sci. Eng. A 2012, 532, 111–119.
- Rodríguez-Baracaldo, R.; Benito, J.A.; Caro, J.; Cabrera, J.M.; Prado, J.M. Strain rate sensitivity of nanocrystalline and ultrafine-grained steel obtained by mechanical attrition. Mater. Sci. Eng. A 2008, 485, 325–333.
- Fu, Y.; Yu, H. Application of mathematical modeling in two-stage rolling of hot rolled wire rods. J. Mater. Process. Technol. 2014, 214, 1962–1970.
- Hossain, R.; Pahlevani, F.; Quadir, M.Z.; Sahajwalla, V. Stability of retained austenite in high carbon steel under compressive stress: An investigation from macro to nano scale. Sci. Rep. 2016, 6, 34958.
- Terasaki, H.; Shintome, Y.; Takada, A.; Komizo, Y.; Morito, S. In-situ Characterization of Martensitic Transformation in High Carbon Steel Under Continuous-cooling Condition. Mater. Today: Proc. 2015, 2, S941–S944.
- Serajzadeh, S.; Taheri, A.K. An investigation into the effect of carbon on the kinetics of dynamic restoration and flow behavior of carbon steels. Mech. Mater. 2003, 35, 653–660.
- Jaipal, J.D.C.; Wynne, B.P.; Collinson, D.C.; Brownrig, A.; Hodgson, P.D. Effect of carbon content on the hot flow stress and dynamic recrystallization behaviour of plain carbon steels. In Proceedings of the Thermec’97: International Conference on Thermomechanical Proc. of Steels and Other Materials, Wollongong, Australia, 7–11 July 1997.
- Dixon, T.J.; Sellars, C.M.; Whiteman, J.A. The effect of carbon content during hot deformation of austenite. In Proceedings of the 37th MWSP Conference Proceedings, Hamilton, ON, Canada, 22–25 October 1996.
- Wray, P.J. Effect of carbon content on the plastic flow of plain carbon steels at elevated temperatures. Metall. Trans. A 1982, 13, 125–134.
- Wray, P.J. Effect of composition and initial grain size on the dynamic recrystallization of austenite in plain carbon steels. Metall. Trans. A Phys. Metall. Mater. Sci. 1984, 15, 2009–2019.
- Kong, L.X.; Hodgson, P.D.; Collinson, D.C. Modelling the effect of carbon content on hot strength of steels using a modified artificial neural network. ISIJ Int. 1998, 38, 1121–1129.
- Lee, W.-S.; Liu, C.-Y. The effects of temperature and strain rate on the dynamic flow behaviour of different steels. Mater. Sci. Eng. A 2006, 426, 101–113.
- Sherby, O.D.; Walser, B.; Young, C.M.; Cady, E.M. Superplastic ultra-high carbon steels. Scr. Metall. 1975, 9, 569–573.
- Li, Q.; Wang, T.-S.; Li, H.-B.; Gao, Y.-W.; Li, N.; Jing, T.-F. Warm Deformation Behavior of Steels Containing Carbon of 0. 45% to 1. 26% With Martensite Starting Structure. J. Iron Steel Res. Int. 2010, 17, 34–37.
- Lee, W.-S.; Liu, C.-Y.; Chen, T.-H. Adiabatic shearing behavior of different steels under extreme high shear loading. J. Nucl. Mater. 2008, 374, 313–319.
- Di Benedetto, G.; Matteis, P.; Scavino, G. Impact behavior and ballistic efficiency of armor-piercing projectiles with tool steel cores. Int. J. Impact Eng. 2018, 115, 10–18.
- Lindroos, M.; Apostol, M.; Kuokkala, V.-T.; Laukkanen, A.; Valtonen, K.; Holmberg, K.; Oja, O. Experimental study on the behavior of wear resistant steels under high velocity single particle impacts. Int. J. Impact Eng. 2015, 78, 114–127.
- Zhang, R.; Zhi, X.-D.; Fan, F. Plastic behavior of circular steel tubes subjected to low-velocity transverse impact. Int. J. Impact Eng. 2018, 114, 1–19.
- Verma, P.N.; Dhote, K.D. Characterising primary fragment in debris cloud formed by hypervelocity impact of spherical stainless steel projectile on thin steel plate. Int. J. Impact Eng. 2018, 120, 118–125.
- Gruben, G.; Langseth, M.; Fagerholt, E.; Hopperstad, O.S. Low-velocity impact on high-strength steel sheets: An experimental and numerical study. Int. J. Impact Eng. 2016, 88, 153–171.
- Iqbal, M.A.; Senthil, K.; Madhu, V.; Gupta, N.K. Oblique impact on single, layered and spaced mild steel targets by 7.62 AP projectiles. Int. J. Impact Eng. 2017, 110, 26–38.
- Nakkalil, R. Formation of adiabatic shear bands in eutectoid steels in high strain rate compression. Acta Metall. Et Mater. 1991, 39, 2553–2563.
- Moshksar, M.M.; Marzban Rad, E. Effect of temperature and strain rate on the superplastic behaviour of high-carbon steel. J. Mater. Process. Technol. 1998, 83, 115–120.
- Banerjee, A.; Hossain, R.; Pahlevani, F.; Zhu, Q.; Sahajwalla, V.; Prusty, B.G. Strain-rate-dependent deformation behaviour of high-carbon steel in compression: Mechanical and structural characterisation. J. Mater. Sci. 2019.
- Banerjee, A.; Prusty, B.G.; Bhattacharyya, S. Rate-dependent mechanical strength and flow behaviour of dual-phase high carbon steel at elevated temperatures: An experimental investigation. Mater. Sci. Eng. A 2019, 744, 224–234.
- Banerjee, A.; Pahlevani, F.; Sahajwalla, V.; Prusty, B. Compressive deformation behaviour of high carbon steel at quasi-static strain rates. In Proceedings of the 9th Australasian Congress on Applied Mechanics (ACAM9), Sydney, Australia, 27–29 November 2017; pp. 55–60.
- Banerjee, A.; Wang, H.; Brown, A.; Ameri, A.; Zhu, Q.; Bhattacharyya, S.; Hazell, P.J.; Prusty, B.G. Experimental investigation on the dynamic flow behaviour and structure-property correlation of dual-phase high carbon steel at elevated temperatures. Mater. Sci. Eng. A 2019.
- Banerjee, A.; Prusty, B.G.; Bhattacharyya, S.; Zhu, Q. An investigation on the deformation mechanisms of high carbon steel under the influence of thermal and rate-dependent loading. Mater. Sci. Eng. A 2020, 772, 138766.
- Banerjee, A.; Gangadhara Prusty, B.; Zhu, Q.; Pahlevani, F.; Sahajwalla, V. Strain-Rate-Dependent Deformation Behavior of High-Carbon Steel under Tensile–Compressive Loading. JOM 2019, 71, 2757–2769.
- Lorusso, H.; Burgueño, A.; Egidi, D.; Svoboda, H. Application of Dual Phase Steels in Wires for Reinforcement of Concrete Structures. Procedia Mater. Sci. 2012, 1, 118–125.
- Calcagnotto, M.; Ponge, D.; Raabe, D. Effect of grain refinement to 1μm on strength and toughness of dual-phase steels. Mater. Sci. Eng. A 2010, 527, 7832–7840.
- Lu, W.J.; Qin, R.S. Stability of martensite with pulsed electric current in dual-phase steels. Mater. Sci. Eng. A 2016, 677, 252–258.
- Mousavi Anijdan, S.H.; Vahdani, H. Room-temperature mechanical properties of dual-phase steels deformed at high temperatures. Mater. Lett. 2005, 59, 1828–1830.
- Kadkhodapour, J.; Schmauder, S.; Raabe, D.; Ziaei-Rad, S.; Weber, U.; Calcagnotto, M. Experimental and numerical study on geometrically necessary dislocations and non-homogeneous mechanical properties of the ferrite phase in dual phase steels. Acta Mater. 2011, 59, 4387–4394.
- Ekrami, A. High temperature mechanical properties of dual phase steels. Mater. Lett. 2005, 59, 2070–2074.
- Paruz, H.; Edmonds, D.V. The strain hardening behaviour of dual-phase steel. Mater. Sci. Eng. A 1989, 117, 67–74.
- Giordano, L.; Matteazzi, P.; Tiziani, A.; Zambon, A. Retained austenite variation in dual-phase steel after mechanical stressing and heat treatment. Mater. Sci. Eng. A 1991, 131, 215–219.
- Ozturk, F.; Polat, A.; Toros, S.; Picu, R.C. Strain Hardening and Strain Rate Sensitivity Behaviors of Advanced High Strength Steels. J. Iron Steel Res. Int. 2013, 20, 68–74.
- Ogata, S.; Mayama, T.; Mine, Y.; Takashima, K. Effect of microstructural evolution on deformation behaviour of pre-strained dual-phase steel. Mater. Sci. Eng. A 2017, 689, 353–365.
- Bag, A.; Ray, K.K.; Dwarakadasa, E.S. Influence of martensite content and morphology on tensile and impact properties of high-martensite dual-phase steels. Metall. Mater. Trans. A 1999, 30, 1193–1202.
- Saeidi, N.; Ekrami, A. Impact properties of tempered bainite–ferrite dual phase steels. Mater. Sci. Eng. A 2010, 527, 5575–5581.
- Modi, A.P. Effects of microstructure and experimental parameters on high stress abrasive wear behaviour of a 0.19wt% C dual phase steel. Tribol. Int. 2007, 40, 490–497.
- Cao, Y.; Ahlström, J.; Karlsson, B. The influence of temperatures and strain rates on the mechanical behavior of dual phase steel in different conditions. J. Mater. Res. Technol. 2015, 4, 68–74.
- Yu, H.; Guo, Y.; Lai, X. Rate-dependent behavior and constitutive model of DP600 steel at strain rate from 10−4 to 103 s−1. Mater. Des. 2009, 30, 2501–2505.
- Waterschoot, T.; De Cooman, B.C.; De, A.K.; Vandeputte, S. Static strain aging phenomena in cold-rolled dual-phase steels. Metall. Mater. Trans. A 2003, 34, 781–791.
- Cao, Y.; Ahlström, J.; Karlsson, B. Mechanical Behavior of a Rephosphorized Steel for Car Body Applications: Effects of Temperature, Strain Rate, and Pretreatment. J. Eng. Mater. Technol. 2011, 133.
- Tarigopula, V.; Hopperstad, O.S.; Langseth, M.; Clausen, A.H.; Hild, F. A study of localisation in dual-phase high-strength steels under dynamic loading using digital image correlation and FE analysis. Int. J. Solids Struct. 2008, 45, 601–619.
- Bleck, W.; Schael, I. Determination of crash-relevant material parameters by dynamic tensile tests. Steel Res. 2000, 71, 173–178.
- Sachdev, A.K. Effect of retained austenite on the yielding and deformation behavior of a dual phase steel. Acta Metall. 1983, 31, 2037–2042.
- Dai, Q.; Song, R.; Fan, W.; Guo, Z.; Guan, X. Behaviour and mechanism of strain hardening for dual phase steel DP1180 under high strain rate deformation. Jinshu Xuebao/Acta Metall. Sin. 2012, 48, 1160–1165.
- Rahmaan, T.; Abedini, A.; Butcher, C.; Pathak, N.; Worswick, M.J. Investigation into the shear stress, localization and fracture behaviour of DP600 and AA5182-O sheet metal alloys under elevated strain rates. Int. J. Impact Eng. 2017, 108, 303–321.
- Hassannejadasl, A.; Rahmaan, T.; Green, D.E.; Golovashchenko, S.F.; Worswick, M.J. Prediction of DP600 Flow Surfaces at Various Strain-rates Using Yld2004-18p Yield Function. Procedia Eng. 2014, 81, 1378–1383.
- Huh, H.; Kim, S.-B.; Song, J.-H.; Lim, J.-H. Dynamic tensile characteristics of TRIP-type and DP-type steel sheets for an auto-body. Int. J. Mech. Sci. 2008, 50, 918–931.
- Misra, R.D.K.; Venkatsurya, P.; Wu, K.M.; Karjalainen, L.P. Ultrahigh strength martensite–austenite dual-phase steels with ultrafine structure: The response to indentation experiments. Mater. Sci. Eng. A 2013, 560, 693–699.
- Samuel, F.H. Effect of strain rate and microstructure on the work hardening of a Cr Mo Si steel. Mater. Sci. Eng. 1987, 92, L5–L8.
- Dong, D.; Liu, Y.; Yang, Y.; Li, J.; Ma, M.; Jiang, T. Microstructure and dynamic tensile behavior of DP600 dual phase steel joint by laser welding. Mater. Sci. Eng. A 2014, 594, 17–25.
- Huh, J.; Huh, H.; Lee, C.S. Effect of strain rate on plastic anisotropy of advanced high strength steel sheets. Int. J. Plast. 2013, 44, 23–46.
- Anderson, D.; Winkler, S.; Bardelcik, A.; Worswick, M.J. Influence of stress triaxiality and strain rate on the failure behavior of a dual-phase DP780 steel. Mater. Des. 2014, 60, 198–207.
- Kim, J.-H.; Kim, D.; Han, H.N.; Barlat, F.; Lee, M.-G. Strain rate dependent tensile behavior of advanced high strength steels: Experiment and constitutive modeling. Mater. Sci. Eng. A 2013, 559, 222–231.
- Tarigopula, V.; Langseth, M.; Hopperstad, O.S.; Clausen, A.H. Axial crushing of thin-walled high-strength steel sections. Int. J. Impact Eng. 2006, 32, 847–882.
- Das, A.; Ghosh, M.; Tarafder, S.; Sivaprasad, S.; Chakrabarti, D. Micromechanisms of deformation in dual phase steels at high strain rates. Mater. Sci. Eng. A 2017, 680, 249–258.
- Das, A.; Biswas, P.; Tarafder, S.; Chakrabarti, D.; Sivaprasad, S. Effect of Strengthening Mechanism on Strain-Rate Related Tensile Properties of Low-Carbon Sheet Steels for Automotive Application. J. Mater. Eng. Perform. 2018.
- Sato, K.; Yu, Q.; Hiramoto, J.; Urabe, T.; Yoshitake, A. A method to investigate strain rate effects on necking and fracture behaviors of advanced high-strength steels using digital imaging strain analysis. Int. J. Impact Eng. 2015, 75, 11–26.
- Oliver, S.; Jones, T.B.; Fourlaris, G. Dual phase versus TRIP strip steels: Microstructural changes as a consequence of quasi-static and dynamic tensile testing. Mater. Charact. 2007, 58, 390–400.
- Gündüz, S.; Tosun, A. Influence of straining and ageing on the room temperature mechanical properties of dual phase steel. Mater. Des. 2008, 29, 1914–1918.
- Berbenni, S.; Favier, V.; Lemoine, X.; Berveiller, M. Micromechanical modeling of the elastic-viscoplastic behavior of polycrystalline steels having different microstructures. Mater. Sci. Eng. A 2004, 372, 128–136.
- Queiroz, R.R.U.; Cunha, F.G.G.; Gonzalez, B.M. Study of dynamic strain aging in dual phase steel. Mater. Sci. Eng. A 2012, 543, 84–87.
- Kim, S.B.; Huh, H.; Bok, H.H.; Moon, M.B. Forming limit diagram of auto-body steel sheets for high-speed sheet metal forming. J. Mater. Process. Technol. 2011, 211, 851–862.
- Bhattacharya, D. Modern Niobium Microalloyed Steels for the Automotive Industry. In HSLA Steels 2015, Microalloying 2015 Offshore Engineering Steels 2015; John Wiley & Sons, Inc.: New York, NY, USA, 2015; pp. 71–83.
More
