Murciano-Granadina goat is one of the oldest and most representative livestock breeds of Spain. There are some references to its existence dating back to the fifteenth century, especially with respect to the Granadina population (Rodero et al. 1992). The first modern reference to the breed is dated in 1893 (Aragó 1893) but it considered Murciana and Granadina, whose names derivate from the Spanish provinces in which they were raised, as two separate breeds, a situation that was maintained until the first official recognition of the Spanish breeds in 1933. According to Aparicio (1947) both Murciana and Granadina breeds are modern evolutions of the European Capra aegagrus goat branch, so that they are very close to each other from an evolutionary point of view, but still they hold important genetic differences as it has been highlighted by the tests carried out with molecular markers by Martínez et al. (2010), differences which could support their recognition as independent breeds. Anyway, the integration of these two original breeds into a single racial entity was strictly an administrative decision took in the seventies during the past century. In those years, the Spanish government decided to follow the international recommendation to fusion close breeds in order to obtain higher census that permitted to extend the intensity of selection and the consequent bigger genetic progress. Today this decision is severely criticized because it meant the erosion of the Granadina population, leading it near extinction, in spite of remarking the important adaptive capacity of this population to the altitude (more than 2500 m) and the heat and hydric stress. Presently, the new extensification of management systems and the effects of climatic change make the Granadina genotypes very demanded, which show the best performances under hard conditions.
- Goats
- autochthonous
- Spain
- Breed
1. Introduction
Note:All the information in this draft can be edited by authors. And the entry will be online only after authors edit and submit it.
1. Introduction
The inclusion of new technologic advances in breeding programs gradually evolved from the implementation of traditional phenotypic selection to genomic selection methods through single nucleotide polymorphisms (SNPs). The study of the association of SNPs may allow identification of which gene sequences may associate with goat milk production, quality, and composition, as well as cheesemaking properties [1–3]. As a result, geneticists are able to identify and select those individuals with superior genetic potential [1,2].
The genes comprising the casein complex are located within a 250-kb segment on chromosome 6 in the goat [4]. Concretely, SNPs have been reported to act as genetic units, which are closely bonded through epistatic relationships [5] and transmitted as haplotypes [6]. It is the relationship among the genetic polymorphisms of the casein complex (α
, β, α
, and κ-casein genes) with the aforementioned characteristics of productive interest that shapes one of the most interesting complexes to study from an economic perspective [7].
Although the close association between casein genes, casein variants, and milk production traits has been frequently considered, the consideration of casein haplotype variants rather than the coding of a single gene or SNPs, as suggested by several authors, may maximize the understanding of heritable mechanisms and their implication on the expression of functional traits related to milk production [8,9].
The selection of one desirable allele over the rest normally implies the simultaneous selection and frequency increase of epistatically linked alleles, which in turn may not have a favorable effect on milk production traits and their components [10]. The approaches that are regularly followed to perform association analyses [11] normally overlook this genetic epistatic effects change during lactation [12], which renders the study of genetic association inefficient.
Furthermore, previous studies have suggested the expression of casein genes may change across the different phases of lactation in dairy animals [13,14]. This finding potentially implies the fact that the epistatic relationships between the polymorphisms within the genes comprised in the casein complex may change in time and combinedly promote changes in the expression of milk yield and composition along the lactation [15]. As a result, when the regulation of the expression of a certain casein gene has a detrimental effect on milk yield and quality, the remaining genes may positively adjust to compensate for such a negative effect [16].
Such evolution across lactation and the strong dependence of qualitative and quantitative dairy performance on the shape of the lactation curve [11] and its parameters (slope of the initial rise of the curve, peak yield, time to peak, lactation persistency, and length as suggested by López, et al. [17]) of the lactation curve shape may be potential selection criteria to consider when the aim is to maximize the profitability of goat milk performance.
The wide interindividual variation in terms of the lactation curve shape (peak yield and persistency) described by individuals may be conditioned by a multifactorial genetic and nongenetic basis [11]. Concretely, the genetically conditioned fraction of these traits [18] may be supported by the findings by Strucken et al. [15], who reported that lactation curve parameters provide a higher power to screen the whole genome for the region whose effect changes during lactation.
Revealing which genetic units may be responsible for the higher productive success though the modelling of the lactation curve may translate in a higher final profitability of milk as a product.
Although several linear and non-linear functions have been used to describe the relationship between daily milk yield and days in milk (DIM) in dairy animals [19], Ali–Schaeffer polynomials may be preferable in genotyping and genetic evaluation studies [20] aiming at modelling for milk yield and composition, while parabolic functions have been suggested to overcome other models when somatic cell count cycles are modelled [21]. These models have been reported to overcome the remaining possibilities when researchers are compelled to use reduced samples, or which require the modelling of individual lactation curves, provided their greater ability to capture inter and intra individual variability and predictability.
2. Milk Yield and Composition Association with Potential Combinations of αS1- and αS2-Casein Loci Haplotypic Sequences
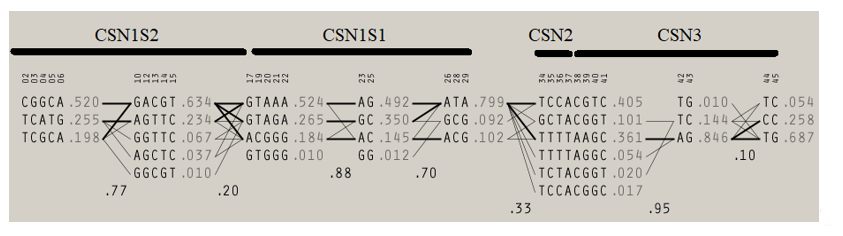
Table 2 shows results of Bayesian inference of ANOVA to detect significant difference in average milk yield, protein, fat, dry matter, lactose, and somatic cell counts and curve shape parameters for milk yield and each of the aforementioned components across casein complex haplotypes. Statistically significant (p < 0.05) differences were found for milk yield and all components, but among the curve shape parameters (peaks and persistence), only average protein percentage peak reported significant differences across casein complex haplotypes. Table S3 shows the descriptive statistics for milk yield and components across all the haplotypes detected within the casein complex in Murciano-Granadina goats. When the haplotypic sequence found at the αS1-casein locus is considered, four different haplotypic groups can be determined. A map of the linkage disequilibrium relationships across casein complex loci is shown in Figure 1.
2. Milk Yield and Composition Association with Potential Combinations of αS1- and αS2-Casein Loci Haplotypic Sequences

Linkage disequilibrium map across casein complex loci (CSN1S1, locus for αS1-casein; CSN1S2, locus for αS2-casein; CSN2 locus for β-casein; and CSN3, locus for κ-casein). Accessed from Pizarro Inostroza et al. [5].
| Trait | Parameter | Groups | Sum of Squares | df | Mean Square | F | Sig. | Bayes Factor |
|---|---|---|---|---|---|---|---|---|
| Milk Yield | Peak | Between | 69,689.375 | 86.000 | 810.342 | 0.545 | 0.958 | 0.000 |
| Within | 22,301.205 | 15.000 | 1486.747 | |||||
| Persitence (b1) | Between | 1.822 | 86.000 | 0.021 | 0.608 | 0.921 | 0.000 | |
| Within | 0.523 | 15.000 | 0.035 | |||||
| Persitence (b2) | Between | 0.000 | 86.000 | 0.000 | 0.000 | |||
| Within | 0.000 | 15.000 | 0.000 | |||||
| Kg | Between | 18,562.178 | 86.000 | 215.839 | 17.316 | 0.001 | 120,000,000 | |
| Within | 37,643.494 | 3020.000 | 12.465 | |||||
| Fat | Peak | Between | 177,982.014 | 86.000 | 2069.558 | 0.818 | 0.729 | 0.000 |
| Within | 37,941.157 | 15.000 | 2529.410 | |||||
| Persitence (b1) | Between | 5.985 | 86.000 | 0.070 | 1.208 | 0.355 | 0.000 | |
| Within | 0.864 | 15.000 | 0.058 | |||||
| Persitence (b2) | Between | 0.000 | 86.000 | 0.000 | 0.998 | 0.539 | 0.000 | |
| Within | 0.000 | 15.000 | 0.000 | |||||
| % | Between | 1024.046 | 86.000 | 11.908 | 11.52 | 0.001 | 178,000,000 | |
| Within | 3120.806 | 3020.000 | 1.033 | |||||
| Protein | Peak | Between | 11,785.747 | 86.000 | 137.044 | 3.142 | 0.008 | 0.001 |
| Within | 654.156 | 15.000 | 43.610 | |||||
| Persitence (b1) | Between | 0.490 | 86.000 | 0.006 | 1.630 | 0.144 | 0.000 | |
| Within | 0.052 | 15.000 | 0.003 | |||||
| Persitence (b2) | Between | 0.000 | 86.000 | 0.000 | 0.000 | |||
| Within | 0.000 | 15.000 | 0.000 | |||||
| % | Between | 253.694 | 86.000 | 2.950 | 16.951 | 0.001 | 311,000,000 | |
| Within | 525.565 | 3020.000 | 0.174 | |||||
| Dry Matter | Peak | Between | 243,045.970 | 86.000 | 2826.12 | 1.089 | 0.452 | 0.000 |
| Within | 38,915.155 | 15.000 | 2594.34 | |||||
| Persitence (b1) | Between | 8.013 | 86.000 | 0.093 | 1.330 | 0.274 | 0.000 | |
| Within | 1.051 | 15.000 | 0.070 | |||||
| Persitence (b2) | Between | 0.000 | 86.000 | 0.000 | 0.661 | 0.882 | 0.000 | |
| Within | 0.000 | 15.000 | 0.000 | |||||
| % | Between | 1823.530 | 86.000 | 21.204 | 13.804 | 0.001 | 382,000,000 | |
| Within | 4638.983 | 3020.000 | 1.536 | |||||
| Lactose | Peak | Between | 3683.784 | 86.000 | 42.835 | 1.238 | 0.334 | 0.000 |
| Within | 518.983 | 15.000 | 34.599 | |||||
| Persitence (b1) | Between | 0.164 | 86.000 | 0.002 | 0.906 | 0.634 | 0.000 | |
| Within | 0.032 | 15.000 | 0.002 | |||||
| Persitence (b2) | Between | 0.000 | 86.000 | 0.000 | 0.000 | |||
| Within | 0.000 | 15.000 | 0.000 | |||||
| % | Between | 90.587 | 86.000 | 1.053 | 14.50 | 0.001 | 78,800,000 | |
| Within | 219.336 | 3020.000 | 0.073 | |||||
| Somatic cell counts | Peak | Between | 201,479,119.002 | 86.000 | 2,342,780.45 | 0.374 | 0.998 | 0.000 |
| Within | 93,871,863.089 | 15.000 | 6,258,124.21 | |||||
| Persitence (b1) | Between | 9,286,148,083,739 | 86.000 | 107,978,466 | 0.569 | 0.945 | 0.000 | |
| Within | 2,847,041,628,535 | 15.000 | 189,802,775 | |||||
| ×103 sc/mL | Between | 1,735,786,503.91 | 86.000 | 20,183,564 | 22.388 | 0.001 | 457,000,000 | |
| Within | 2,722,657,222.52 | 3020.000 | 901,542.13 |
Bayesian inference for one-way ANOVA to determine the differences in the mean for milk yield and components and curve parameters through best fitting models across casein haplotypes in Murciano-Granadina goats.
|
Trait |
Parameter |
Groups |
Sum of Squares |
df |
Mean Square |
F |
Sig. |
Bayes Factor |
|
Milk Yield |
Peak |
Between |
69,689.375 |
86.000 |
810.342 |
0.545 |
0.958 |
0.000 |
|
Within |
22,301.205 |
15.000 |
1486.747 |
|||||
|
Persitence (b1) |
Between |
1.822 |
86.000 |
0.021 |
0.608 |
0.921 |
0.000 |
|
|
Within |
0.523 |
15.000 |
0.035 |
|||||
|
Persitence (b2) |
Between |
0.000 |
86.000 |
0.000 |
0.000 |
|||
|
Within |
0.000 |
15.000 |
0.000 |
|||||
|
Kg |
Between |
18,562.178 |
86.000 |
215.839 |
17.316 |
0.001 |
120,000,000 |
|
|
Within |
37,643.494 |
3020.000 |
12.465 |
|||||
|
Fat |
Peak |
Between |
177,982.014 |
86.000 |
2069.558 |
0.818 |
0.729 |
0.000 |
|
Within |
37,941.157 |
15.000 |
2529.410 |
|||||
|
Persitence (b1) |
Between |
5.985 |
86.000 |
0.070 |
1.208 |
0.355 |
0.000 |
|
|
Within |
0.864 |
15.000 |
0.058 |
|||||
|
Persitence (b2) |
Between |
0.000 |
86.000 |
0.000 |
0.998 |
0.539 |
0.000 |
|
|
Within |
0.000 |
15.000 |
0.000 |
|||||
|
% |
Between |
1024.046 |
86.000 |
11.908 |
11.52 |
0.001 |
178,000,000 |
|
|
Within |
3120.806 |
3020.000 |
1.033 |
|||||
|
Protein |
Peak |
Between |
11,785.747 |
86.000 |
137.044 |
3.142 |
0.008 |
0.001 |
|
Within |
654.156 |
15.000 |
43.610 |
|||||
|
Persitence (b1) |
Between |
0.490 |
86.000 |
0.006 |
1.630 |
0.144 |
0.000 |
|
|
Within |
0.052 |
15.000 |
0.003 |
|||||
|
Persitence (b2) |
Between |
0.000 |
86.000 |
0.000 |
0.000 |
|||
|
Within |
0.000 |
15.000 |
0.000 |
|||||
|
% |
Between |
253.694 |
86.000 |
2.950 |
16.951 |
0.001 |
311,000,000 |
|
|
Within |
525.565 |
3020.000 |
0.174 |
|||||
|
Dry Matter |
Peak |
Between |
243,045.970 |
86.000 |
2826.12 |
1.089 |
0.452 |
0.000 |
|
Within |
38,915.155 |
15.000 |
2594.34 |
|||||
|
Persitence (b1) |
Between |
8.013 |
86.000 |
0.093 |
1.330 |
0.274 |
0.000 |
|
|
Within |
1.051 |
15.000 |
0.070 |
|||||
|
Persitence (b2) |
Between |
0.000 |
86.000 |
0.000 |
0.661 |
0.882 |
0.000 |
|
|
Within |
0.000 |
15.000 |
0.000 |
|||||
|
% |
Between |
1823.530 |
86.000 |
21.204 |
13.804 |
0.001 |
382,000,000 |
|
|
Within |
4638.983 |
3020.000 |
1.536 |
|||||
|
Lactose |
Peak |
Between |
3683.784 |
86.000 |
42.835 |
1.238 |
0.334 |
0.000 |
|
Within |
518.983 |
15.000 |
34.599 |
|||||
|
Persitence (b1) |
Between |
0.164 |
86.000 |
0.002 |
0.906 |
0.634 |
0.000 |
|
|
Within |
0.032 |
15.000 |
0.002 |
|||||
|
Persitence (b2) |
Between |
0.000 |
86.000 |
0.000 |
0.000 |
|||
|
Within |
0.000 |
15.000 |
0.000 |
|||||
|
% |
Between |
90.587 |
86.000 |
1.053 |
14.50 |
0.001 |
78,800,000 |
|
|
Within |
219.336 |
3020.000 |
0.073 |
|||||
|
Somatic cell counts |
Peak |
Between |
201,479,119.002 |
86.000 |
2,342,780.45 |
0.374 |
0.998 |
0.000 |
|
Within |
93,871,863.089 |
15.000 |
6,258,124.21 |
|||||
|
Persitence (b1) |
Between |
9,286,148,083,739 |
86.000 |
107,978,466 |
0.569 |
0.945 |
0.000 |
|
|
Within |
2,847,041,628,535 |
15.000 |
189,802,775 |
|||||
|
x103 sc/mL |
Between |
1,735,786,503.91 |
86.000 |
20,183,564 |
22.388 |
0.001 |
457,000,000 |
|
|
Within |
2,722,657,222.52 |
3020.000 |
901,542.13 |
First, a significantly higher average milk yield of 3.38 kg was found for haplotypes presenting the sequence AAGGAATTAAAAGGCCAA at the αS1-casein locus, when compared to those presenting GAGAAATCGAGAAAGCAA (2.61 kg), GAGAAATCGAGAGAGCGA (2.06 kg), and GAGGAATTAAAAGAGCAA (2.41 kg). The respective average fat percentage found for such sequences was 5.51%, 5.41%, 5.44%, and 5.16%. The average protein percentage for the same respective sequences was 3.56%, 3.53%, 3.46%, and 3.44%. The average dry matter percentage for the same sequences was 14.70%, 14.68%, 14.55%, and 14.19%, respectively. Lactose described the same trend, with the average lactose percentages being 4.97%, 4.84%, 4.83%, and 4.79%, respectively. Somatic cells counts were respectively 513.80 × 10
, 1012.63 × 10
, 1130.56 × 10
, and 1139.81 × 10
sc/mL. These sequences differed in the bases in positions 1, 4, 15, and 16 within the allelic sequence, which correspond to alleles A→G, G→A, C→G, and C→G in SNPs 19, 26, 28, and 29, respectively (→ indicates the changes in allelic sequences).
Second, for those alleles that presented the common sequence of GAGGAATTAAAAGAGCAA for αS1-casein, the highest average milk yield (2.86 kg) was reported when the αs2-casein locus carried the haplotypic sequence TCGCGGCCAAGACCGAGG, followed by those carrying the sequence TCGCGATCGAGACCGAGC (2.68 kg) and CCGGGGCCAAGGCCAAGG (1.88 kg). The average protein percentage for these sequences was 3.65%, 3.56%, and 3.51%, respectively, while the average percentage of dry matter for the same sequences was 14.72%, 14.52%, and 14.30%. The average lactose percentages found were respectively 4.90%, 4.79%, and 4.78%. These sequences differed in the bases in positions 1, 4, 13, and 15, within the allelic sequence, which correspond to alleles T→C, C→G, A→G, and G→A in SNPs 2, 3, 10, and 12, respectively (→ indicates the changes in allelic sequences). Milk yield decreased by almost around 1 kg when any of the alleles changed to G or A.
Third, for the haplotypes carrying the GAGAAATCGAGAGAGCGA sequence at the αS1-casein locus, milk yield differed depending on the sequence present in αS2-casein. Haplotypes presenting the TCGCGGCCAAGGCCAAGG sequence at the αS2-casein locus reported an average milk yield of 2.40 kg and progressively decreased when the sequence changed to TTCCGATCGAGACCGACC (2.39 kg), TTCCAATTGGGACCGGCC (1.89 kg), or TTCCGATCGAGACCGGCC (1.47 kg). the results for fat reported the inverse situation, with the aforementioned sequences being associated with average percentages of 5.07%, 5.14%, 5.64%, and 5.88%, respectively, while for average protein percentages, these were 3.99%, 3.57%, 3.53%, and 3.42%, respectively. Average dry matter percentages were respectively 15.43%, 14.83%, 14.25%, and 14.17%. Lactose average percentages were TTCCGATCGAGACCGACC (4.97%), TTCCGATCGAGACCGGCC (4.83%), TTCCAATTGGGACCGGCC (4.79%), and TCGCGGCCAAGGCCAAGG (4.75%), respectively. Somatic cell counts for the same sequences were as follows TTCCGGCCAAGACCGAGG (456.83 × 10
sc/mL), TCGCGGCCAAGGCCAAGG (506.16 × 10
sc/mL), CCGGGGCCAAGGCCAAGG (847.15 × 10
sc/mL), and TTCCGATCGAGACCGGCC (1860.49 × 10
sc/mL). The progressively higher milk yields occurred when C, G, G, C, A, G, and A were present in SNPs 2, 3, 4, 5, 6, 10, and 12 and the GG polymorphism at SNP 17.
Fourth, when the haplotypic sequence GAGGAATTAAAAGAGCAA at the αS1-casein locus was followed by the sequence TTCCGGCCAAGACCGAGG (3.40 kg) of the αS2-casein locus, a significantly higher milk yield was found when compared to other sequences TTCCGATCGAGACCGGCC (1.64 kg), TCGCGGCCAAGGCCAAGG (2.17 kg), and CCGGGGCCAAGGCCAAGG (2.43 kg), respectively. The average fat percentage for the aforementioned sequences was 5.51%, 5.42%, 5.36%, and 5.29, respectively, with the sequence reporting the lowest average percentage of fat simultaneously being the one reporting the highest milk yield as well (TTCCGGCCAAGACCGAGG). This pattern repeated for the average protein and dry matter percentages as follows: 3.18% protein/14.38% dry matter (TTCCGGCCAAGACCGAGG), 3.42% protein/13.97% dry matter (CCGCGGCCAAGGCCAAGG), 3.45% protein/14.19% dry matter/4.77% lactose/940.29 × 10
sc/mL (CCGGGGCCAAGGCCAAGG), 3.57% protein/13.93% dry matter/1278.90 × 10
sc/mL (TCGCGGCCAAGACCGAGG), 3.63% protein/14.38% dry matter/917.33 × 10
sc/mL (TTCCGATCGAGACCGGCC), and 3.67% protein/14.57% dry matter/4.79% lactose/1981.14 × 10
3. Milk Yield and Composition Association with Potential Combinations of αS1- and β-Casein Loci Haplotypic Sequences
sc/mL (TCGCGGCCAAGGCCAAGG). The sequences differed as some presented the alleles C, G, G, C, A, G, A, and G at SNPs 2, 3, 4, 5, 6, 10, 12, and 17, respectively.
3. Milk Yield and Composition Association with Potential Combinations of αS1- and β-Casein Loci Haplotypic Sequences
When the αS1-casein sequence GAGAAATCGAGAAAGCAA was associated to the sequence GGGATCTC of the β-casein locus, a higher milk yield was reported (2.45 kg) in comparison to the sequence GGGACCCC (2.34 kg). For these sequences, the percentage of fat reported was as follows: GGGACCCC (5.48%), GGAACCCC (5.45%), and GGGATCTC (5.29%) while the average percentages of protein were GGGACCCC (3.61%), GGAACCCC (3.56%), and GGGATCTC (3.78%). Average dry matter percentages were GGAACCCC (14.85%), GGGATCTC (14.46%), and GGGACCCC (14.77%), respectively. The sequence GGGACCCC presented an average lactose percentage of 4.88%, contrasting the slightly lower percentage of 4.80% reported for GGGATCTC, while the somatic cell counts were GGGACCCC (760.15 × 10
sc/mL) and GGGATCTC (645.96 × 10
sc/mL). Similarly, when the αS1-casein sequence GAGAAATCGAGAGAGCGA was associated with the β-casein locus sequence GGGATCTC (2.63 kg), there was an increase in milk yield, which, however, reduced the average fat/protein/dry matter percentages when followed by the β-casein locus sequence GGGGCCCC (2.03 kg), which parallelly decreased with the increase in milk yield as follows: GGGATCTC (4.91% fat/3.50% protein/13.95% dry matter/4.86% lactose/1148.89 × 10
sc/mL), GGGGCCCC (5.56% fat/3.97% protein/15.19% dry matter/4.59% lactose/959.09 × 10
sc/mL), and GGAATCTC (5.82% fat/3.63% protein/15.13% dry matter), respectively. The last combination corresponds to the combination of the αS1-casein sequence GAGGAATTAAAAGAGCAA with the β-casein sequences GGGGCCCC for which the milk yield reported was 2.96 kg, GGGACCCC (3.73 kg), GGGATCTC (2.90 kg), and GAGACCCC (3.31 kg). A negative correlation was found between milk yields and fat/protein/dry matter percentages, which parallelly decreased with the increase in milk yield as follows: GGGATCTC (6.21% fat/3.43% protein/14.90% dry matter), GGGACCCC (5.02% fat/3.35% protein/14.02% dry matter/744.33 × 10
sc/mL), GGGGCCCC (5.44 % fat/3.50% protein/13.96% dry matter/1255.74 × 10
sc/mL), and GAGACCCC (5.13% fat/3.52% protein/14.25% dry matter/788.10 × 10
4. Milk Yield and Composition Association with Potential Combinations of αS1- and κ-Casein Loci Haplotypic Sequences
sc/mL), respectively. The sequence GGAATCTC was associated with an increased average lactose percentage of 4.88% in comparison to the rest. The aforementioned sequences differed in the change of the alleles A→G, A→G, T→C and T→C at SNPs 34, 35, 36, and 37.
4. Milk Yield and Composition Association with Potential Combinations of αS1- and κ-Casein Loci Haplotypic Sequences
A wide variability was found in regards to the clusters of sequences for αS1-casein that were combined with those of κ-casein. Still, when the cluster characterized by the αS1-casein sequence GAGAAATCGAGAAAGCAA was combined with the κ-casein sequence TTCCCCAA.-.-GGTTCC (2.85 kg), milk yield increased significantly. The later sequence presented the alleles C, C, A, .-, G, and T, in contrast to the others, which presented T, T, T, AATC, A, and G at SNPs 39, 40, 41, 42, 43, and 44, respectively. Other haplotypes described the same variability. For instance, for the haplotypes clustered together considering the αS1-casein sequence GAGAAATCGAGAGAGCGA, it was not possible to define a clear trend in the association with milk yield, although statistically significant differences were found. As for the rest of the haplotypic sequences found in other loci of the casein complex, for κ-casein haplotypic sequences TTTTTTTTAATCAATCAAGGCC (6.07% fat/3.87% protein), TGCCTCAA.-.-GGTGTC (5.55% fat/3.33% protein), TTTCTCTA.-AATCGATGCC (5.33% fat/3.60% protein), and TTCCCCAA.-.-GGTTCC (5.12% fat/3.13% protein), the same negative correlation between average milk yield and fat/protein percentage was found.
In this widely variable context, when the sequence for the αS1-casein GAGGAATTAAAAGAGCAA was associated with the κ-casein sequence TTTCTCTA.-AATCGATGCC, milk yield slightly increased (2.49 kg) in comparison to when it was associated with the sequence TGTCTTTA.-AATCGAGGTC (2.20 kg). The sequences differed in regards to the presence of the alleles T, C, and C for SNPs 38, 40, and 44. Parallelly, the κ-casein sequences TTCCCCAA.-.- GGTTCC were associated with average fat contents of 5.39%, TTTCTCTA.-AATCGATGCC (4.91%), and TGTCTTTA.-AATCGAGGTC (5.08%), respectively, when the configuring alleles were instead G, T, and T for SNPs 38, 40, and 44. The great variability found in the case of average protein and dry matter percentages does not allow identification of association trends across haplotypes when κ-casein sequences are considered. Although a wide variability was also found for the average lactose percentage, the κ-casein sequence TTCCCCAA.-.-GGTTCC was associated with a slightly higher average percentage of lactose (4.87%) than that reported for the sequence TTTCTCTA.-AATCGATGCC (4.68%). The two sequences differed in regards to the presence of the alleles C, C A, .-,A, and T at SNPs 39, 40, 41, and 42. The same situation was found for the somatic cell counts, where a decreasing trend in a widely variably context was found. For instance, for the sequence TTCCCCAA.-.-GGTTCC, the somatic cell counts were 519.03 × 10
sc/mL; for TTTTTTTTAATCAATCAAGGCC, they were 1080.97 × 10
sc/mL; and for TTTCTCTA.-AATCGATGCC, they were 2025.01 × 10
sc/mL. Structural differences were found based on the presence of alleles C, C, A, .-, G, and T at SNPs 39, 40, 41, 42, 43, and 44.
References
- Caravaca, F.; Ares, J.L.; Carrizosa, J.; Urrutia, B.; Baena, F.; Jordana, J.; Badaoui, B.; Sànchez, A.; Angiolillo, A.; Amills, M. Effects of α s1-casein (CSN1S1) and κ-casein (CSN3) genotypes on milk coagulation properties in Murciano-Granadina goats. Dairy Res. 2011, 78, 32–37.
- Rychtářová, J.; Sztankoova, Z.; Kyselova, J.; Zink, V.; Štípková, M.; Vacek, M.; Štolc, L. Effect of DGAT1, BTN1A1, OLR1, and STAT1 genes on milk production and reproduction traits in the Czech Fleckvieh breed. Czech J. Anim. Sci 2014, 59, 45–53.
- Pizarro Inostroza, M.; Landi, V.; Navas González, F.; León Jurado, J.; Martínez Martínez, A.; Fernández Álvarez, J.; Delgado Bermejo, J. Non-parametric association analysis of additive and dominance effects of casein complex SNPs on milk content and quality in Murciano-Granadina goats. Anim. Breed. Genet. 2020, 137, 407–422.
- Martin, P.; Szymanowska, M.; Zwierzchowski, L.; Leroux, C. The impact of genetic polymorphisms on the protein composition of ruminant milks. Nutr. Dev. 2002, 42, 433–459.
- Pizarro Inostroza, M.G.; Landi, V.; Navas González, F.J.; León Jurado, J.M.; Martínez Martínez, M.d.A.; Fernández Álvarez, J.; Delgado Bermejo, J.V. Non-parametric analysis of casein complex genes epistasis and their effect on phenotypic expression of milk yield and composition in Murciano-Granadina goats. Dairy Sci. 2020, 103, 8274–8291.
- Yahyaoui , M.H.; Coll, A.; Sanchez, A.; Folch, J.M. Genetic polymorphism of the caprine kappa casein gene. Dairy Res. 2001, 68, 209–216.
- Martin, C.; Morgavi, D.; Doreau, M. Methane mitigation in ruminants: From microbe to the farm scale. Animal 2010, 4, 351–365.
- Boettcher, P.; Caroli, A.; Stella, A.; Chessa, S.; Budelli, E.; Canavesi, F.; Ghiroldi, S.; Pagnacco, G. Effects of casein haplotypes on milk production traits in Italian Holstein and Brown Swiss cattle. Dairy Sci. 2004, 87, 4311–4317.
- Caroli, A.; Chiatti, F.; Chessa, S.; Rignanese, D.; Bolla, P.; Pagnacco, G. Focusing on the goat casein complex. Dairy Sci. 2006, 89, 3178–3187.
- Sacchi, P.; Chessa, S.; Budelli, E.; Bolla, P.; Ceriotti, G.; Soglia, D.; Rasero, R.; Cauvin, E.; Caroli, A. Casein haplotype structure in five Italian goat breeds. Dairy Sci. 2005, 88, 1561–1568.
- Atashi, H.; Salavati, M.; De Koster, J.; Ehrlich, J.; Crowe, M.; Opsomer, G.; Gplus, E.C.; Hostens, M. Genome-wide association for milk production and lactation curve parameters in Holstein dairy cows. Anim. Breed. Genet. 2020, 137, 292–304.
- Ning, C.; Wang, D.; Zheng, X.; Zhang, Q.; Zhang, S.; Mrode, R.; Liu, J.-F. Eigen decomposition expedites longitudinal genome-wide association studies for milk production traits in Chinese Holstein. Sel. Evol. 2018, 50, 1–10.
- Bionaz, M.; Loor, J.J. Identification of reference genes for quantitative real-time PCR in the bovine mammary gland during the lactation cycle. Genom. 2007, 29, 312–319.
- Berget, I.; Martens, H.; Kohler, A.; Sjurseth, S.; Afseth, N.; Narum, B.; Ådnøy, T.; Lien, S. Caprine CSN1S1 haplotype effect on gene expression and milk composition measured by Fourier transform infrared spectroscopy. Dairy Sci. 2010, 93, 4340–4350.
- Strucken, E.; Bortfeldt, R.; De Koning, D.; Brockmann, G. Genome‐wide associations for investigating time‐dependent genetic effects for milk production traits in dairy cattle. Genet. 2012, 43, 375–382.
- Leroux, C.; Le Provost, F.; Petit, E.; Bernard, L.; Chilliard, Y.; Martin, P. Real-time RT-PCR and cDNA macroarray to study the impact of the genetic polymorphism at the alpha s1-casein locus on the expression of genes in the goat mammary gland during lactation. Nutr. Dev. 2003, 43, 459–469.
- López, S.; France, J.; Odongo, N.; McBride, R.; Kebreab, E.; AlZahal, O.; McBride, B.; Dijkstra, J. On the analysis of Canadian Holstein dairy cow lactation curves using standard growth functions. Dairy Sci. 2015, 98, 2701–2712.
- Arnal, M.; Robert-Granié, C.; Larroque, H. Diversity of dairy goat lactation curves in France. Dairy Sci. 2018, 101, 11040–11051.
- France, J.; Kebreab, E. Mathematical Modelling in Animal Nutrition; CABI: Wallingford, UK, 2008.
- Andonov, S.; Ødegård, J.; Boman, I.A.; Svendsen, M.; Holme, I.J.; Ådnøy, T.; Vukovic, V.; Klemetsdal, G. Validation of Test-Day Models for Genetic Evaluation of Dairy Goats in Norway. Dairy Sci. 2007, 90, 4863–4871.
- Ferrell, J.E.; Tsai, T.Y.-C.; Yang, Q. Modeling the Cell Cycle: Why Do Certain Circuits Oscillate? Cell 2011, 144, 874–885.