This entry used a publically available dataset to perform in silico analysis using different bioinformatics tools (PathwayConnector, PathWalks, DyNet). The DEGs were identifed for the pre-symptomatic and symptomatic HD stages.
This work used a publically available dataset to perform in silico analysis using different bioinformatics tools (PathwayConnector, PathWalks, DyNet). The DEGs were identifed for the pre-symptomatic and symptomatic HD stages.
The CACNA1I gene was the mostly highly rewired node among pre-symptomatic and symptomatic HD network. Prominent molecular pathways for each HD stage were then obtained, and metabolites related to each pathway for both disease stages were identified. The transforming growth factor beta (TGF- ) signaling (pre-symptomatic and symptomatic stages of the disease), calcium (Ca2+) signaling (pre-symptomatic), dopaminergic synapse pathway (symptomatic HD patients) and Hippo signaling (pre-symptomatic) pathways.
The CACNA1I gene was the mostly highly rewired node among pre-symptomatic
and symptomatic HD network. Prominent molecular pathways for each HD stage were then obtained, and metabolites related to each pathway for both disease stages were identified. The transforming growth factor beta (TGF- ) signaling (pre-symptomatic and symptomatic stages of the disease), calcium (Ca2+) signaling (pre-symptomatic), dopaminergic synapse pathway (symptomatic HD patients) and Hippo signaling (pre-symptomatic) pathways.
The genes, pathways and metabolites identified for each HD stage can provide a better understanding of the mechanisms that become altered in each disease stage. Our results can guide the development of therapies that may target the altered genes and metabolites of the perturbed pathways, leading to an improvement in clinical symptoms and hopefully a delay in the age of onset.
The genes, pathways and
metabolites identified for each HD stage can provide a better understanding of the mechanisms that
become altered in each disease stage. Our results can guide the development of therapies that may
target the altered genes and metabolites of the perturbed pathways, leading to an improvement in
clinical symptoms and hopefully a delay in the age of onset.
- Huntington's Disease
- Bioinformatics analysis
- Metabolites
- Pathways
- Re-wiring
Note:All the information in this draft can be edited by authors. And the entry will be online only after authors edit and submit it.
1. Introduction
Huntington’s disease (HD), which was first described in 1872 by Dr. George Huntington [1], is a rare, progressive and devastating neurodegenerative disease with autosomal dominant inheritance [2]. The medium spiny neurons of the basal ganglia of the central nervous system play a role in executive function, behavior and motor control as well as undergo neuronal degeneration [3].
HD is caused by a CAG trinucleotide repeat on the huntingtin (HTT) gene that is located on exon 1 of chromosome 4. The huntingtin protein (HTT) is encoded by the HTT gene [4]. The HTT gene is located in a repeated DNA fragment that consists of cytosine-adenine-guanine (CAG) which is repeated multiple times repeat [4].
The number of CAG repeats is the main predictor for age of onset and disease severity in HD [3]. In healthy individuals, the CAG trinucleotide is repeated normally between 10–35 times [3]. Individuals that have between 36–39 CAG repeats may or may not develop HD, meaning that there is reduced penetrance. However, individuals with 40 or more CAG repeats will always develop the signs and symptoms of HD [3].
The typical age of onset for HD is approximately 40 years, and the average life expectancy is 17 years after symptom onset [5][6][5,6]. Clinical characteristics include: (i) movement impairment such as chorea, (ii) an involuntary twitching movement and incoordination, (iii) cognitive impairment such as lapse in short-term memory and (iv) behavioral impairment such as depression, personality changes and psychosis. As the disease progresses, the involuntary movements become more prominent [5]. Clinical characteristics of HD patients are evaluated using the Unified Huntington’s Disease Rating Scale (UHDRS), which evaluates (i) motor function, (ii) cognition, (iii) behavior and (iv) functional abilities [5].
HD is a monogenetic and incurable disease and at the same time its molecular manifestations remain highly complex and involve multiple cellular processes, genes, and metabolites, which needs to be investigated to understand HD pathology. Systems bioinformatics (SB) allows the integration of different biological omics data to better understand the biological pathways, mechanisms, genes and metabolites involved in HD and lead to possible therapeutic treatments and biomarker discovery.
SB is an interdisciplinary field which combines the research fields of systems biology and bioinformatics. SB allows the integration of biological data across the omics categories such a genomics, transcriptomics, proteomics, metabolomics, lipidomics, epigenomics and several types of omics data [7].
A major approach in this direction is the generation and construction of biological networks representing each level of omics data and their integration in a layered network that permits the exchange of information between and within the layers. The goal is to reveal synergistic relationships among numerous factors rather than explore each entity individually. This data integration approach results in the construction of highly complex molecular interaction networks. The biological data, obtained through large-scale omics analysis can provide a better understanding into biological mechanisms and pathways and how a dysfunction in these mechanisms and pathways can cause the disease [7]. Furthermore, the emerging importance of biological network-based approaches, allows for potential biological and clinical applications by suggesting an intuitive and trustworthy approach to explore the biological and molecular complexity of a disease of interest [8].
The metabolome is defined as the complete set of small chemical molecules found within a biological samples (urine, cerebrospinal fluid (CSF), serum, plasma), tissues and cells. Changes and interactions in gene and protein expression and the environment are directly revealed in the metabolome making it more chemically and physically complex than the genome, transcriptome and proteome. Metabolites are affected by the upstream influence of the genome, proteome, environmental and lifestyle factors, as well as medication and underlying diseases [9].
Metabolomics is an omics category focused in the study of metabolites. Metabolites are defined as small biological and low molecular weight (<1500 Da) compounds, they are the end-products of metabolism [10]. There are two categories of metabolites, the primary metabolites which are directly involved in the growth, reproduction and development of the cell these include amino acids, sugars and lipids and the secondary metabolites which are indirectly involved in the growth, reproduction and development of the cell such as drugs. The investigation of metabolites allows the identification of metabolic pathways that become activated or dysfunctional in patients. Identification of such disease specific metabolites can eventually result in HD biomarkers [10].
2. Differentially Expressed Genes in Pre-Symptomatic and Symptomatic HD Patients
The top 150 over and top 150 under expressed genes, therefore a total of 300 genes were identified respectively for each group of HD patients. The DEGs for the pre-symptomatic and symptomatic HD patients, in comparison to controls, are shown in Table S1 and Table S2 respectively. DEGs that are highlighted through our pipeline and have also been already associated with HD based on the bibliography, are highlighted in Table S3. Specifically, we annotate their role in pathophysiological mechanisms such as neuro-inflammation, apoptosis, anti-oxidants and Ca2+ dysregulation that are involved in HD.
3. Gene Co-Expression Networks of Pre-Symptomatic and Symptomatic HD Patients
The gene co-expression networks containing the DEGs for controls versus pre-symptomatic and versus symptomatic HD patients are illustrated in (Figure 1). Blue nodes represent the genes present in pre-symptomatic HD patients, orange nodes represent genes present in symptomatic HD patients and green nodes represent genes found in both the pre-symptomatic and symptomatic HD patients. Similarly, blue, orange and green edge colour represent co-expressions observed in pre-symptomatic, symptomatic and both HD stages respectively. Additionally, network topology analysis revealed a more tightly connected co-expression network for the pre-symptomatic HD patients compared to the symptomatic, as shown by the differences in the degree, betweenness, coreness and closeness distributions in Figure 1b–e.
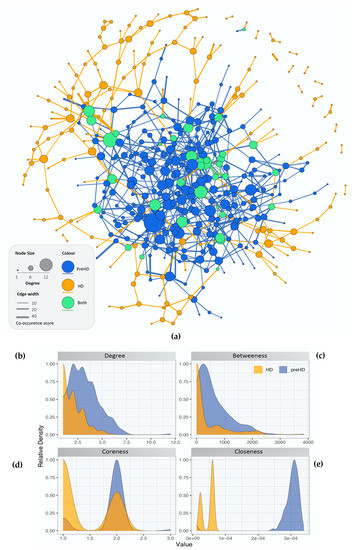
Figure 1. Network topological analysis of the gene co-expression. (a) Gene co-expression networks for controls versus pre-symptomatic and controls versus symptomatic HD. Blue nodes represent: the genes involved in pre-symptomatic HD, orange nodes represent: the genes involved in the symptomatic HD stage and green nodes represent the genes which appear in both HD networks. Edge colour represents co-expression in the respective groups (either or both HD stages) while edge thickness represents co-occurrence score (b–e) Distribution of the calculated centralities for the pre-symptomatic and symptomatic HD networks, i.e., (b) Degree (c) Betweenness (d) Coreness and (e) Closeness.
4. Network Rewiring between Gene Co-Expression Networks of Pre-Symptomatic and Symptomatic HD Patients Using DyNet
The gene co-expression networks for the pre-symptomatic and symptomatic HD networks were used to identify the most re-wired nodes between the pre-symptomatic and symptomatic HD networks using the DyNet Cytoscape plug-in [11]. The central reference network is an overlapping visualization view consisting of the pre-symptomatic and symptomatic HD networks as illustrated in (Figure 2). The most highly re-wired node identified based on the Dn (DyNet re-wiring) score as seen in (Figure 2) and drawn as a square node, was the calcium voltage-gated channel subunit alpha 1 I (CACNA1I). In our data we identified the CACANA1I gene to be significant with a p-value of 1.96E-05 and logFC 2.744 in pre-symptomatic HD patients. The CACNA1I gene encodes the protein CACNA1I, which is a member of a sub-family of Ca2+ channels. The following voltage-gated Ca2+ channel is involved in Ca2+ signalling in neurons [https://www.gehttps://www.genecards.org/], [12], anecards.org/], [12]Supplementary Table S4 shows the presence or absence of genes indicated by true or false in the pre-symptomatic and symptomatic networks.
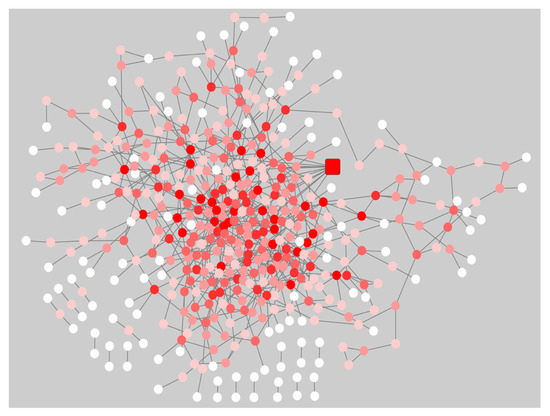
Figure 2. Central reference network of the pre-symptomatic and symptomatic HD network using the Cytoscape plug-in DyNet. Dark red nodes: Most highly re-wired nodes, Medium red: Highly re-wired nodes, Light red: Least most re-wired nodes and White nodes: No re-wiring. The square node indicates the CACNA1I gene, which was the most highly re-wired node based on the DyNet re-wiring score.
A Venn diagram [https://bioinfogp.cnb.csic.es/tools/venny/], was used to identify, the DEGs and rewired genes common between the pre-symptomatic and symptomatic HD stages. The Venn Figure 3, identified, the AF198444 gene to be common between the rewired genes and DEGs symptomatic HD. Ten common genes such as CNTN6, DEK, LTN1, MST4, ZFYVE16, CEP135, DCAKD, MAP4K3, NUPL1 and RBM15 were identified between the DEGs for pre-symptomatic and DEGs for symptomatic HD. Some of the biological functions identified for the above-mentioned genes, include ubiquitin protein ligase activity, ATP binding, adenyl ribonucleotide, protein serine/threonine kinase activity, purine ribonucleotide triphosphate binding, ubiquitin-protein transferase activity, protein kinase activity and RNA binding (Table S5). Additionally, twenty-two common genes such as CACNA1I, DNAJB14, EPS8L3, HSDL2, SNRPD3, SOX12, ACLY, ATF2, BAG5, ERBB4, FOCAD, GRAMD1C, LIN7C, MIR22, MTHFR, NABP1, NRG2, OTC, PRAMEF12, SLC30A10, STAG2 and Y16709 were identified between the rewired and DEGs of pre-symptomatic. Some of the biological pathways identified include, phosphatidylinositol-4,5-bisphosphate 3-kinase activity, phosphatidylinositol bisphosphate kinase activity, cyclic adenosine monophosphate (cAMP) response element binding protein binding, protein tyrosine kinase activity, voltage-gated ion channel activity involved in regulation of postsynaptic membrane potential, voltage-gated calcium channel activity, manganese ion transmembrane transporter activity and numerous additional pathways in Table S6. Furthermore, from our studied we identified the genes of SP3 and PCNP from the DEGs symptomatic HD and CAPZA1 from the DEGs pre-symptomatic HD. The following three genes, were previous identified by [13] as biomarkers for HD.
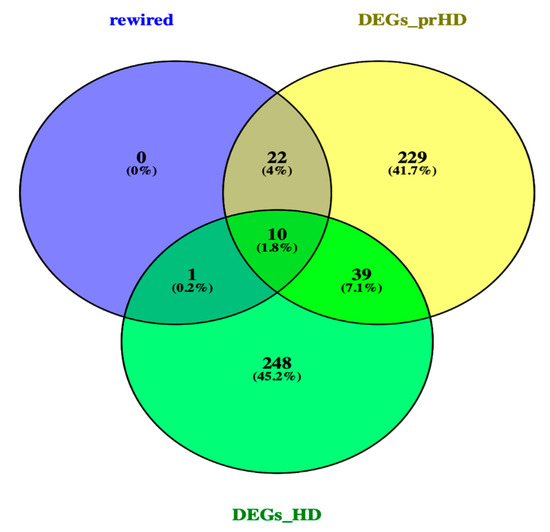
Figure 3. Venn diagram of rewired genes and DEGs of pre-symptomatic and symptomatic HD. Venn diagram illustrates the number of common genes between the rewired genes and DEGs of the two HD stages.
The DEGs and re-wired genes obtained from DyNet were separately used as input for enrichment analysis in the EnrichR web-tool [14] for pre-symptomatic and symptomatic HD cases as well as the rewired network, to identify the common enriched pathways and genes among the co-expression networks and the re-wired HD network. The common pathways between the pre-symptomatic, symptomatic HD networks and the re-wired network were selected based on the top ranking score.
Some of the common pathways identified between the pre-symptomatic and the re-wired network include: glycosaminoglycan degradation, citrate acid cycle, ErbB signaling pathway, adherens junctions, Ca2+ signalling and arginine biosynthesis. Common pathways identified between the symptomatic and the rewired network include the endocytosis and proteasome pathways.
5. PathwayConnector Clustering of Pathways Identifed for Pre-Symptomatic and Symptomatic HD Patients
We further identified the HD- related pathways for the pre-symptomatic and symptomatic HD stages using PathwayConnector [15][15]. The pathways for each stage are shown in Table S7 and Table S8 respectively.
After enrichment analysis, mapping onto the Kyoto Encyclopedia of Genes and Genomes (KEEG) reference network and the construction of the complementary pathway-to-pathway networks for the pre-symptomatic and symptomatic HD stages, clustering was then implemented to group the final set of HD-related pathways into clusters.
6 clusters were recognized for the pre-symptomatic HD stage and 3 clusters for the symptomatic HD stage, clustering of pathways is based on the network property of edge-betweenness which defined as the number of shortest paths which go through an edge in a network [16]. The clusters are indicated by the different coloured circles and backgrounds for the pre-symptomatic and symptomatic stages respectively Figure 4.
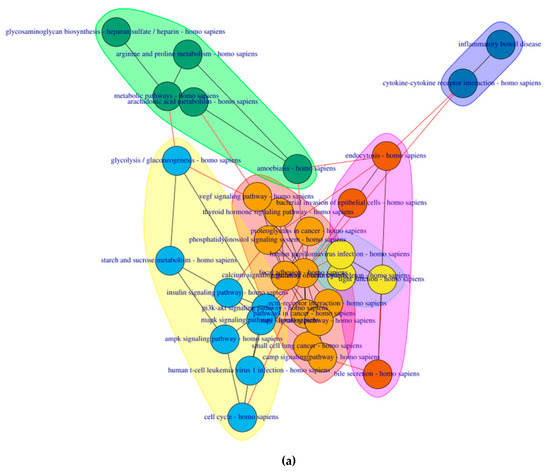
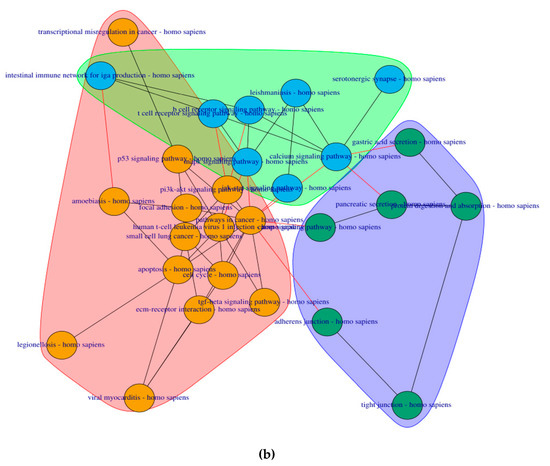
Figure 4. Cluster of connected pathways for pre-symptomatic and symptomatic HD using PathwayConnector (a) Clusters of pathways in the pre-symptomatic HD stage. There is a total of six clusters, each shaded in a different color. (b) Three clusters of pathways in the symptomatic HD stage.
References
- Bates, G.P.; Dorsey, R.; Gusella, J.F.; Hayden, M.R.; Kay, C.; Leavitt, B.R.; Nance, M.; Ross, C.A.; Scahill, R.I.; Wetzel, R.; et al. Huntington disease. Nat. Rev. Dis. Primers 2015, 1, 15005.
- Johri, A.; Beal, M.F. Antioxidants in Huntington’s disease. Biochim. Biophys. Acta—Mol. Basis Dis. 2012, 1822, 664–674.
- Manoharan, S.; Guillemin, G.J.; Abiramasundari, R.S.; Essa, M.M.; Akbar, M.; Akbar, M.D. The Role of Reactive Oxygen Species in the Pathogenesis of Alzheimer’s Disease, Parkinson’s Disease, and Huntington’s Disease: A Mini Review. Oxid. Med. Cell. Longev. 2016, 2016, 1–15.
- Walker, F.O. Huntington’s disease. Semin. Neurol. 2007, 27, 143–150.
- Roos, R.A.C. Huntington’s disease: A clinical review. Orphanet J. Rare Dis. 2010, 5, 40.
- Tabrizi, S.J.; Langbehn, D.R.; Leavitt, B.R.; Roos, R.A.C.; Durr, A.; Craufurd, D.; Kennard, C.; Hicks, S.L.; Fox, N.C.; Scahill, R.I.; et al. Biological and clinical manifestations of Huntington’s disease in the longitudinal TRACK-HD study: Cross-sectional analysis of baseline data. Lancet Neurol. 2013, 8, 791–801.
- Oulas, A.; Minadakis, G.; Zachariou, M.; Sokratous, K.; Bourdakou, M.M.; Spyrou, G.M. Systems Bioinformatics: Increasing precision of computational diagnostics and therapeutics through network-based approaches. Brief. Bioinform. 2019, 20, 806–824.
- Fiscon, G.; Conte, F.; Farina, L.; Paci, P. Network-based approaches to explore complex biological systems towards network medicine. Genes 2018, 9, 437.
- Nalbantoglu, S.; Abu-Asab, M.; Suy, S.; Collins, S.; Amri, H. Metabolomics-Based Biosignatures of Prostate Cancer in Patients Following Radiotherapy. OMICS. A J. Integr. Biol. 2019, 23, 214–223.
- Alonso, A.; Marsal, S.; Julià, A. Analytical Methods in Untargeted Metabolomics: State of the Art in 2015. Front. Bioeng. Biotechnol. 2015, 5, 23.