Your browser does not fully support modern features. Please upgrade for a smoother experience.
Please note this is a comparison between Version 1 by Elisa Casaglia and Version 2 by Peter Tang.
Rapid eye movement (REM) sleep without atonia (RSWA) is the polysomnographic (PSG) hallmark of REMrapid eye movement (REM) sleep behavior disorder (RBD), a feature essential for the diagnosis of this condition.
- REM sleep behavior disorder
- REM sleep without atonia
- polysomnography
- neurophysiology
- electroencephalography
- transcranial magnetic stimulation
- vestibular evoked myogenic potentials
1. Introduction
For the International Classification of Sleep Disorders 3rd Edition (ICSD-3) [1], rapid eye movement (REM) sleep behavior disorder (RBD) is a parasomnia manifested by vivid, often frightening dreams accompanied by simple or complex motor behaviors during REM sleep. Patients seem to “enact their dreams” with their behaviors, probably mirroring the dream content [2]. Idiopathic (or isolated) RBD (iRBD) is an established early manifestation of a neurodegenerative disease, especially synucleinopathy [3]. RBD can be found in a large proportion of both children and adults with narcolepsy, representing a form of REM sleep motor behavior dyscontrol [4][5][4,5], and it seems to be a phenotype distinct from iRBD, with less marked sex predominance, more elementary and less complex movements and less violent behavior in REM sleep, younger age of onset, and orexin deficiency (a feature of narcolepsy type 1) [6][7][6,7].
The polysomnographic (PSG) hallmark of RBD is decreased muscle atonia during REM sleep, also called REM sleep without atonia (RSWA), because of increased electromyographic (EMG) activity during this stage, and this is a feature essential for the diagnosis of this condition, which is thus based on both clinical and laboratory findings [1]. The search for reliable biomarkers of RBD and its evolution into an overt synucleinopathy is a very lively field of interest, with many studies being published [8]. However, RSWA remains the most important neurophysiological aspect, being necessary for the diagnosis of RBD [9].
2. REM Sleep Network and REM Atonia Neurophysiopathology
Knowledge about the neural circuitry underling REM sleep physiology and mechanisms causing RSWA mostly arises from animal, post-mortem, and radiological studies. Brainstem lesions due to neurodegeneration, demyelination, tumors, or ischemic injury may cause RSWA and lead to secondary RBD [10][11][12][13][10,11,12,13].
Early animal studies showed that a state characterized by muscle atonia and rapid eye movement persists following decortication, or brainstem transections rostral to the pons in Jouvet’s “pontine cat” [14]. In addition, the sublaterodorsal tegmental nucleus (SLD), also called the subcoeruleus nucleus (SubC), contains many neurons that show tonic firing selective to the paradoxical (or REM) sleep (PS) state, thus called “PS-on” neurons [15]. Although initial studies indicated that the nature of SLD or SubC PS-on neurons was cholinergic [16], further research demonstrated that vesicular glutamate transporter 2 (vGlut2), a specific marker of glutamatergic neurons, was expressed in c-Fos-positive neurons localized in the SLD or SubC after PS hypersomnia [17]. Moreover, genetic inactivation of glutamatergic transmission in SLD or SubC neurons induces a 30% decrease in PS quantities and the occurrence of RBD, confirming the glutamatergic nature of SLD or SubC neurons generating PS [18]. Tract-tracing data also revealed that SLD or SubC glutamatergic PS-on neurons send descending projections to the gamma-amyno-butyric acid (GABA) and glycinergic neurons located in the nucleus raphe magnus, as well as the ventral alpha gigantocellular and lateral paragigantocellular reticular nuclei, inducing muscle atonia, but not to the intralaminar thalamus neurons known to mediate the activation of the cortex during REM sleep [18]. Conversely, cholinergic and noncholinergic neurons, located in the SLD or SubC, pedunculopontine, and laterodorsal tegmental nuclei, and glutamatergic neurons in the reticular formation projecting to the thalamus and hypothalamus (that seem to be firing both during waking and PS) are believed to play a role in cortical activation during REM sleep. Concerning the limbic cortical structures, only the dentate gyrus, anterior cingulate, and retrosplenial and medial entorhinal cortices seem to be activated during PS [19].
Recent findings suggest that the onset of a REM sleep episode might be due to a complex and still largely unknown mechanism implicating the activation of PS-on melanin-concentrating hormone and GABAergic neurons in the lateral hypothalamus [20]. This would remove the GABAergic tone of PS-off neurons located in the ventrolateral part of the periaqueductal gray (vlPAG) and the adjacent dorsal part of the deep mesencephalic nucleus (dDPMe), which gate PS by tonically inhibiting the PS-on neurons of the SLD or SubC during wakefulness and slow-wave sleep [21][22][21,22], combined with the continuous presence of a glutamatergic input. PS-on GABAergic neurons localized in the lateral hypothalamus, dorsal paragigantocellular nuclei, and vlPAG also seem to inactivate the PS-off orexin and aminergic neurons during REM sleep [23]. Conversely, the activation of arousal systems, reciprocally inhibiting the GABAergic PS-on neurons, might determine the exit from a REM sleep state [19], allegedly forming a “flip-flop” switch model for REM sleep.
REM sleep atonia (see Figure 1) is basically due to both the inhibition and decreased activation [24] of cranial and spinal skeletal motor neurons, which exhibit a tonic hyperpolarization during physiological REM sleep [25]. In fact, blockage of both the GABA and glycine motor neuron receptors prevents muscle paralysis during REM sleep [26]. During REM sleep, cranial and spinal motor neurons are very likely to be inhibited by the GABA and glycinergic neurons located in the ventromedial medulla (VMM). Additionally, the spinal motor neurons seem to also be inhibited by the spinal interneurons [26][27][26,27]. Moreover, decreased or lost glutamatergic, noradrenergic, dopaminergic, and hypocretinergic activity may contribute to reduce motor neuron excitability, thus strengthening muscle atonia during REM sleep [28][29][30][28,29,30]. The VMM and spinal interneurons are under the direct control of a group of glutamatergic neurons located within a small reticular region of the pontine tegmentum, namely the SLD or SubC, which act as an REM sleep generator and controller (REM-on cells), which is thought to be necessary and sufficient for generating REM sleep atonia [13][31][32][33][13,31,32,33]. SLD or SubC glutamatergic REM-on cells and VMM GABA and glycinergic neurons constitute the main REM atonia circuitry [34].
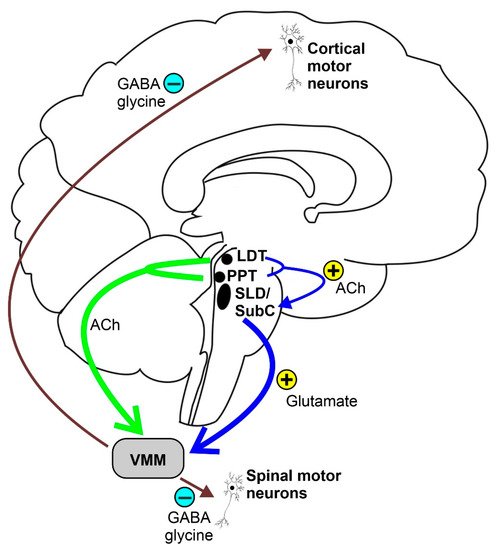
Figure 1. Schematic representation of the REM sleep atonia circuitry. Ach = acetylcholine, LDT = laterodorsal tegmental nucleus, PPT = pedunculopontine nucleus, SLD = sublaterodorsal tegmental nucleus, SubC = subcoeruleus nucleus, and VMM = ventromedial medulla.
3. REM Sleep without Atonia (RSWA)
3.1. Polysomnographic Features
Physiological REM sleep is characterized by complete muscle atonia with a markedly decreased amplitude for the EMG signal. As said above, RSWA is the neurophysiological and polysomnographic hallmark of RBD, and it is represented by a persistent muscle tone during REM sleep, resulting in either sustained (tonic) excessive activity during REM sleep in the chin EMG, intermittent (phasic) excessive activity during REM sleep in the chin or limb EMG, or both. The tonic and phasic components of RSWA can be present and isolated from each other or in combination, such as bursts of phasic EMG activity superimposed on a tonically increased muscle tone. According to the latest American Academy of Sleep Medicine (AASM) scoring manual [35][41], a 30-s epoch of REM sleep is defined as tonic when at least 50% of its duration contains a chin EMG with an amplitude greater than the minimum amplitude observed in non-REM sleep. On the other hand, the same scoring manual defines the phasic components of RSWA as excessive transient muscle activity bursts on the chin and limb EMG channels lasting 0.1–5.0 s with an amplitude at least 4 times as high as the background EMG activity. Moreover, a 30-s REM sleep epoch, subdivided into 3-s mini-epochs, is considered to have excessive phasic EMG activity when at least 50% of the 3-s mini-epochs contain bursts of transient EMG activity [35][41].
RSWA must be differentiated from increased muscle tone related to other different activities (artifacts), such as respiratory arousals, snoring, limb movements, and body movements. Furthermore, RSWA can be triggered or exacerbated by different drugs, such as tricyclic antidepressants, selective serotonin reuptake inhibitors, monoamine oxidase inhibitors, mirtazapine, venlafaxine, and betablockers. However, further studies are needed to assess cause–effect relationships [36][37][38][39][40][41][42,43,44,45,46,47]. Although the quantification of RSWA is mandatory for the diagnosis of RBD, both the AASM scoring manual and the ICSD-3 do not provide established cut-off values for RSWA, nor do they say how many tonic phasic epochs are needed to define RSWA [1][35][1,41].
3.2. Visual Scoring
Different visual scoring methods to detect and quantify RSWA have been developed and validated. However, there is no consensus on which method is more efficient or which muscle group is better suited to identify or quantify RSWA and distinguish RBD from healthy subjects. It is important to note that here,in the researchersis paper, we refer to phasic or tonic EMG activations during REM sleep that should not be confused with the phasic or tonic subtypes of REM sleep, usually identified on the basis of the presence or absence of eye movement activity during this sleep stage.
The first and the most widely used visual method for scoring RSWA was developed in 1992 by Lapierre and Montplaisir [42][48], here referred to as the “Montreal” method. According to this method, a 20-s REM sleep epoch is defined as tonic when sustained chin EMG lasts more than 50% of the epoch duration, with an amplitude at least twice the background EMG activity or greater than 10 µV. The percentage of tonic REM sleep epochs defines the tonic EMG density. Phasic activity is defined as bursts of EMG activity with an amplitude exceeding 4 times the background and lasting 0.1–10 s. Phasic EMG activity can occur in either atonic or tonic REM sleep epochs and is scored by dividing a 20-s [42][48] or a 30-s [43][49] REM sleep epoch into 2-s mini-epochs. The percentage of 2-s mini-epochs containing phasic chin EMG activity defines the phasic chin EMG density. The authors validated this method in a population of 80 subjects with clinical diagnoses of RBD, identifying RSWA if there was a tonic EMG density ≥30% or phasic chin EMG density ≥15% [43][44][49,50].
The Barcelona Innsbruck group (SINBAR) validated their visual scoring methods in 30 RBD patients (15 iRBD and 15 associated with Parkinson’s Disease (PD)) and 30 control subjects, analyzing REM sleep EMG activity in 11 different muscles, including the mentalis muscle and the flexor digitorum superficialis muscle (FDS), bilaterally in the upper limbs [45][51]. Tonic chin EMG activity was scored in 30-s epochs only in the mentalis muscle according to the Montreal method [44][50]. Phasic EMG events were scored separately in each EMG channel in 3-s mini-epochs as bursts of EMG activity lasting 0.1–5 s with an amplitude at least twice the background. Each 3-s mini-epoch was scored as having or not having phasic EMG activity. When phasic EMG activity bursts emerged in 3-s mini-epochs with tonic EMG activity, the amplitude of the phasic activity had to be at least twice the tonic background EMG activity. Moreover, each 3-s mini-epoch was scored as having or not having any EMG activity, containing irrespectively tonic or phasic activity or a combination of them [45][51]. The SINBAR group suggested the following cut-off values with the best specificity and sensitivity to identify RBD: >16.3% of the 3-s mini-epochs containing phasic chin EMG activity, >18% of the 3-s mini-epochs having any chin EMG activity, >32% of the 3-s mini-epochs having any chin EMG activity combined with bilateral FDS phasic EMG activity, and >27% of the 30-s epochs having any chin EMG activity combined with bilateral FDS phasic EMG activity [45][51]. The latter cut-off value was suggested as the most reliable evidence-based cut-off to distinguish RBD patients from their controls in the ICSD-3 [1].
Another group developed a visual scoring method for short-duration phasic EMG activity during REM sleep, known as the phasic EMG metric (PEM), in the submentalis, tibialis anterior, and brachioradialis muscles for the identification of RBD [46][52]. The PEM was defined as the percentage of 2.5-s intervals containing any discrete bursts of EMG activity lasting ≥100 ms with an amplitude at least 4 times higher than the pre-sleep background activity. The RBD patients showed higher levels of PEM activity in the mentalis and brachioradialis muscles than their controls [46][52].
Another visual scoring method was developed by McCarter et al. [47][53] by combining the tonic, phasic, and any EMG activity in the submentalis and tibialis anterior muscles, which was validated in a cohort of 20 RBD patients with PD, 20 patients with obstructive sleep apnea, and 20 patients with snoring. The tonic EMG activity was scored in each 30-s REM sleep epoch according to the Montreal method [44][50]. Phasic and any EMG activity were scored in 3-s mini-epochs and identified as any activity lasting 0.1–14.9 s with an amplitude 4 times greater than the background [47][53]. The authors provided the following cut-off values for the definition of RSWA using 3-s mini-epochs: >15.5% phasic, 21.6% any, and 1.2% tonic submentalis EMG activity; 30.2% for phasic and any tibialis anterior EMG activity; and 37.9% phasic and 43.4% any EMG activity in the combined submentalis and tibialis anterior muscles [47][53]. However, the same authors further validated their method in a population of 45 consecutive patients, including 15 with iRBD, finding very similar RSWA diagnostic cut-off values [48][54].
Recently, a comparative study has shown a very high degree of agreement between the two visual scoring methods (i.e., the Montreal and SINBAR methods) when considering tonic or any EMG activity in a large cohort of PD patients with and without RBD [49][55].
Further larger studies are needed to assess a reliable and usable visual scoring method for quantifying RSWA in RBD or both iRBD and association with alpha-synucleinopathies and to assess which muscle groups or combinations of them are most reliable to identify RSWA.
3.3. Automatic Scoring
Visual scoring of RSWA is a time-consuming process and may be challenging even for expert scorers. Therefore, multiple efforts have been made to develop computerized methods for the quantification and detection of RSWA [50][51][65,66].
The method that, to date, counts the highest number of published articles is the so-called REM Atonia Index (RAI), proposed by Ferri et al. in 2008 [52][53][54][60,61,67]. It is based on the analysis of the amplitude of the rectified submentalis EMG signal in 1-s mini-epochs. Theoretically, the RAI varies from 0 (total loss of atonia) to 1 (complete atonia), and the threshold for definite RSWA is below 0.8 [53][61]. This method has shown a relatively low night-to-night variability [55][59], good sensitivity and specificity, and good correlation to the visual methods [43][49]. The RAI was validated for patients with iRBD [53][61] and PD-RBD [49][56][55,68], and it is also reliable in patients with RBD and comorbid OSA [48][54] and for the detection of RSWA in narcolepsy [57][58][69,70], including children [4].
All automatic methods described here have been reported to have acceptable sensitivity and specificity in their studies of presentation. However, their comparison showed variable performance, making it impossible to assess the optimal method [59][82], although the RAI seemed to be the most reliable in the identification of RBD. Further comparative studies on larger numbers of recordings are required to identify the most reliable algorithm in order to introduce it in the scoring guidelines for everyday clinical practice. However, automatic methods seem to perform with an accuracy comparable to that of visual methods.
4. Other Neurophysiological Features
4.1. Electroencephalography during Wakefulness and Sleep
Patients with iRBD show some electroencephalographic (EEG) features that have also been reported in neurodegenerative disorders, such as PD and dementia with Lewy bodies (DLB) [60][83]. These changes typically include diffuse EEG slowing during wakefulness, although this is more evident over the occipital scalp areas [61][84]. Notably, this cortical slowdown has been associated with cognitive decline, thus suggesting a parallel between neuropsychological and electrophysiological impairment. It should be remarked that higher absolute delta and theta power in all cortical regions were able to identify iRBD patients with a higher risk of short-term progression into alpha-synucleinopathy [61][84].
4.2. Transcranial Magnetic Stimulation
Non-invasive brain stimulation techniques, such as transcranial magnetic stimulation (TMS) and transcranial direct current stimulation, are widely used to functionally investigate the neural pathways and brain network in vivo, also providing prognostic measures and neuromodulatory activity [62][63][64][65][66][67][68][94,95,96,97,98,99,100]. Accordingly, the data from EEG and functional neuroimaging, during both wakefulness and sleep, have suggested the involvement of different transmission systems which seem to be impaired in synucleinopathy, including PD, multiple system atrophy, and DLB [69][70][101,102].
Coherently, a number of studies have been carried out to evaluate the electrophysiological pattern of cortical excitability, neural plasticity, and functional connectivity to TMS in different sleep disorders [71][72][73][74][103,104,105,106]. In particular, most of the evidence converged on changes to both short-latency intracortical inhibition (SICI) and intracortical facilitation (ICF) in patients with PD, including those in the early stages, in terms of decreased SICI and reduced ICF. Translationally, this would indicate a disinhibition and a hypofacilitation of the motor cortex that are compatible with an impaired GABA and glutamate neurotransmission, respectively [75][76][77][78][79][80][81][107,108,109,110,111,112,113].
On the contrary, to date, only two TMS studies have been performed with iRBD patients. The first [82][114] reported an impairment of the short-latency afferent inhibition (SAI) that may support the hypothesis of cholinergic dysfunction in subjects developing cognitive impairment. This result was confirmed in a second study by the same research group on patients with RBD associated to PD, which can be viewed as the correlate of a cholinergic involvement at the basis of the cognitive decline observed in these subjects [83][115]. The authors concluded that cholinergic degeneration significantly contributes to non-motor Parkinsonian features, also raising the possibility that RBD increases the risk of cognitive impairment in PD [82][114]. Taken together, these findings may help to achieve an early recognition of the cognitive decline in PD and stimulate future “TMS-targeted” treatments [69][101]. The second very recent study [84][116] found that in patients still asymptomatic for a neurodegenerative disorder, changes in ICF and, to a lesser extent, SICI might precede the onset of future neurodegeneration. Furthermore, SICI correlated with the muscle tone alteration during REM sleep, possibly supporting the proposed RBD model of retrograde influence on the cortex from the brainstem [84][116].
Overall, although still limited, TMS studies provide novel insights into the mechanisms underlying cortical dysfunction in PD and RBD and might open future therapeutic avenues. When integrated with clinical, neuroimaging, and sleep-related data, TMS findings are suggestive of an electrocortical imbalance with multiple neurotransmission pathways involved in RBD. Longitudinal studies are required to verify whether the abnormalities detected at this early stage do correlate with the clinical progression of RBD.
4.3. Vestibular Evoked Myogenicpotentials
The brainstem has been identified as a key player in the pathophysiological process leading to the development of iRBD. Vestibular evoked myogenic potentials (VEMPs) (cervical (cVEMP), masseter (mVEMP), and ocular (oVEMP) VEMPs) are a group of neurophysiological tools for the extensive and indirect assessment of the brainstem’s function along its whole length, thus also allowing the identification of subclinical brainstem abnormalities in clinically and radiologically silent regions [85][118].