Green finance is a sustainable force in promoting green development. China’s social financing structure determines the key role that green credit plays in sustainable development.Under the dual pressure of future economic downturn and huge capital gaps, it is worth exploring whether to continue promoting green credit that conforms to the long-term market mechanism. From the perspective of Chinese commercial banks, this paper analyzes whether promoting green credit is compatible with the incentives and their profit maximization goals.
- green credit
- “Two High and One Surplus”
- financial results
Abstract: Green finan
- Introduction
Ace is a sustainable force in promoting green development. China’s social financing structure determines the key role that green credit plays in sustainable development. Under the dual pressure of future economic downturn and huge capital gaps, it is worth exploring whether to continue promoting green credit that conforms to the long-term market mechanism. From the perspectivording to the Statistical Review of World Energy (70th edition) released by BP, by 2020 China’s carbon emissions will account for 30.3% of the global total [1]. The success or failure of Chinese commercial banks, this paper analyzes whether promoting green credit is compatible with the incentives and their profit maximization goals. To this end, the research in this paper is based on the following three aspects: (1) Based on financial analysis, this paper reveals the different pricing of green indusa’s energy conservation and emission reduction projects will affect the overall global carbon neutrality. On the other hand, environmental problems are difficult for many developing countries in the capital market and credit market and explains the mechanism through which green credit policies improve the operatworld to avoid during their development process. As a developing conditions of commercial banks; (2) combined with the conclusions from the literature and financial analysis, the influence of different index types on the modeling results is analyzed, and it is determined that the main reasons causing a decline in the return on assets are the excessive expansuntry with a huge economic volume, how China realizes green, low-carbon, and circular development will provide a model for the economic transformation of capital and the decline in internal resource-use efficiency; (3) a data envelopment model (more accurately, SBM-DDF) with undesirable outputs is established to dynamically analyze the operating efficiency of Chinese commercial banks, and the role of green credit in improving efficiency is studied. The main conclusions of this paper are as follows: if Chinese commercial banks increase their proportion of green credit, they can not only increase their profit scale but also improve and optimize the allocation of their internal resources, thus improving their operating efficiency. The main sample of this study comprises 43 commercial banks in China from 2007 to 2020.
1. Introduction
2. Financial Comparison between “Green” and “Two High and One Surplus” Enterprises
The main purpose of green credit policies is not only to increase the proportion of credit for green projects, but also to reduce the loans to “Two High and One Surplus” enterprises. Changing the credit structure of commercial banks is reflected in the proportion of these two types of corporate loans. Financial analysis is the most important link in the loan approval process of commercial banks. Inspired by this, we will select samples to compare the financial situation and debt financing costs of the above two types of enterprises and will analyze the possible net effect brought by the changes in the credit structure of commercial banks. Considering the availability of financial information and the representativeness of the samples, this paper takes the public industry index for the sample selection. The CSI Environmental Protection Index was selected to represent the green industry, and the textile, paper making, mining, steel, and chemical fiber indexes represent the “Two High and One Surplus” industries (the CSI Environmental Protection security codes are: 000827, Wind CSRC Textile 883114.WI, Paper making (Shenwan) 801143.SI, AMAC mining H11031.CSI, AMAC Steel H30058.CSI, and AMAC chemical fiber H30055.CSI, respectively). According to the Key Evaluation Indicators for the Implementation of Green Credit issued by the China Banking Regulatory Commission in 2014 (Schedule 4 in the Key Evaluation Indicators for Green Credit Implementation provides a reference directory of the “Two High and One Surplus” industries, which is in use today) and the public information of commercial banks regarding “Two High and One Surplus” loans, the above five industries cover the main “Two High and One Surplus” industries. According to the financial analysis of the above six categories of the index components (in Figure 1), it was found that, compared to the “Two High and One Surplus” industries, the environmental protection industry is better, but its financing costs are high.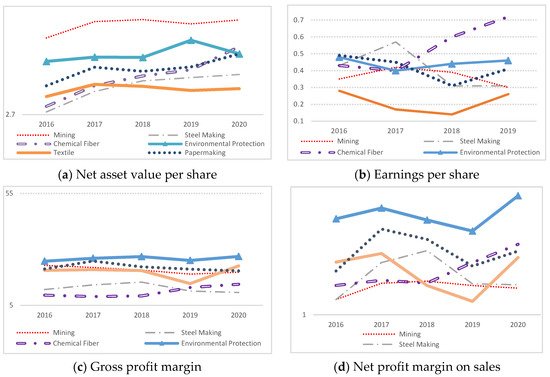
2.1. Financial Indicator Analysis
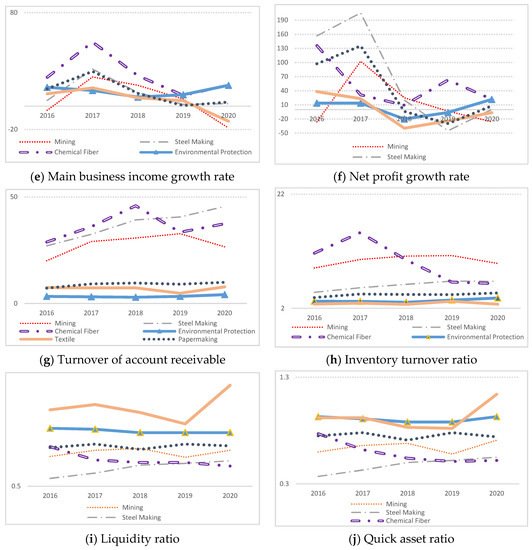
From the perspective of industry prospects, the environmental protection industry is bound to be the industry with the largest policy support in the future, and its product market is also developing rapidly. Both the gross profit margin and the net profit margin of sales have steadily ranked at the top of the six studied industries. Since 2017 especially, there has been a trend of widening the gap between other industries. By 2020, compared to the net profit margin of the “Two High and One Surplus” industries, which is generally below 7%, the ratio for the environmental protection industry is as high as 12.26%, and the growth rate of the two indicators is also rising steadily. Therefore, the profitability of the environmental protection industry is obviously better than that of the “Two High and One Surplus” industries. In terms of asset liquidity, regardless of whether the liquidity ratio or the quick ratio is being considered, the environmental protection industry has performed well, second only to the textile industry. The environmental industry suffers from weaknesses in operating-capacity measures such as inventory turnover (which is the ratio of the operating costs to the average inventory balance) and accounts receivable turnover (which is the ratio of the net sales revenue to the average accounts receivable balance). The low ratio of these two ratios indicates that the environmental protection industry has not yet formed a favorable position in the competition between it and the downstream of the industrial chain, and its considerable profit margin may mainly come from upstream cost control.2.2. Comparison of Financing Costs
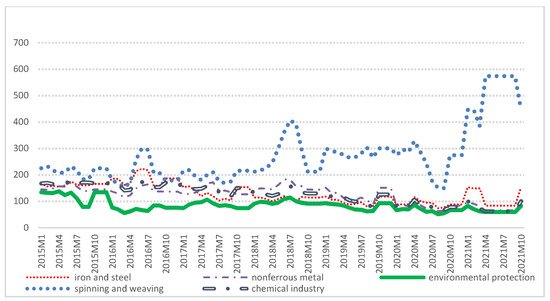
This paper also analyzes the credit financing costs of the above six industries. The ratio of interest expense to interest-bearing debt in financial statements (interest-bearing debt is calculated by multiplying the published total debt by the ratio of the interest-bearing debt) indicates the level of credit financing costs (for Chinese enterprises, the majority of the interest expense comes from credit behavior). As seen from Figure 2, the credit financing costs of the environmental protection industry are much higher than those of the “Two High and One Surplus” industries, but the credit spread of its industrial debt is much lower than that of the latter (Figure 3). Zhou Hong et al. [12] found that non-financial enterprises with more social responsibilities enjoy lower financing costs in the bond market, and similar conclusions also appear in the capital market [13][14][15][16]. In contrast, Goss and Roberts [17] studied corporate financing data in the United States and found that enterprises with more social responsibilities could obtain cheaper bank financing.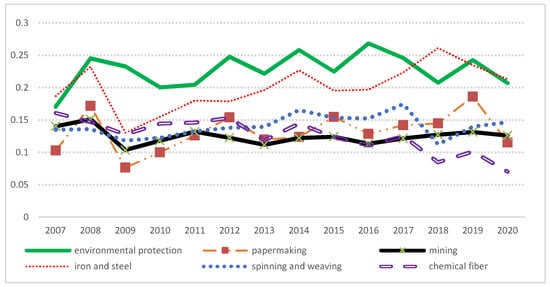
Howethe latecomers. Some scholars estimate that in order to achieve the goal of “carbon peak”, the whole country needs to invest an additional CNY 3–4 trillion every year, with the fiscal revenue only meeting 10–15% of the capital gap [2,3], and inver, sthis mismatch between risk and return is undoubtedly beneficial to commercial banksments should mainly rely on social financing.
Basedy on the above analysis, we propose Hypothesis 1:
Hypothesis 1 (H1). Increasing the proportion of green credit will increase the operating profits of commercial banks.
- Do Green Credit Policies Boost Profits?
Ithe end of 2020, bank the last section, thecredit financial data for green industries and the “Two High and One Surplus” industries were compared, and the reasons for the differences between these two types of industries were analyzed to build a theoretical basis for howng still accounted for 61% of total social financing. Therefore, green credit policies affect the asset management of commercial banks. However, according to the literature, relevant empirical analyses have failed to find a relatively consistent answer to the question of whether increasingis the most important force affecting green finance in China. In fact, CIB Research estimates that green credit can have positive effects on commercial banks. This paper will continue to try to explain the differences in the conclusions from the literature through empirical analysis and will put forward inferences based on facts.
4.1. Description of the Data, Variables, and Models
Theaccounts for more than 90% of all green financing. (As of the first half of study period was from 2007 to 2020 and included 2016019, the first year of green finance in China; the global financial crisis in 2008; and the COVID-19 outbreak in 2019. Samplecredit balance of China’s 21 major banks included 43 types of large state-owned commercial banks, national joint-stock commercial banks, urban commercial banks, and rural commercial banks (including non-listed banks). During the sample period, the selected banks were very representative in terms of the proportion of deposit balance (69.2–80.5%) and loan balance (71.4–74.7%) for the whole industry. From the perspective ofwas CNY 10.6 trillion, and the balance of domestic green bonds was only CNY 708.78 billion. The bank mainly issued green financial bond funds to issue green credit data, as of 2016 . Excluding the green credit balance of the sample banks accounted for 77% ofinancial bonds, the balance of the whole industry (the CBRC has only releasednon-financial enterprise green credit statistics from 2013 to 2016). The relevant financial data,bonds was only CNY 293.96 billion, less than 3% of the green credit, and operational data from commercial banks were collected manually from their official websites and from their annual reports and social responsibility reports.
4.2. Different Models Have Different Results
Th scale. The balances of the other green financing scales were esmpirical analyses that have been carried out in the literature use the relative index—return on total assets (ROA) or return on equity (ROE)—as the explained variable. The value of the relative index is easily affected by the financing behavior of commercial banks. For example, capital expansion increases the denominator of the relative index. In order to further confirm that, this paper will compare the modeling resultaller. (Source: http://greenfinance.xinhua08.com/a/20191227/1905011.shtml (accessed on 16 March 2022))). On the other hand, since the beginning of the 21st century, China has faced the problem of environmental pollution during the process of the absolute index and the relative index, respectivelycountry’s development. The explained variable of the absolute index model is the natural logarithm of net profit, and the core explanatory variable is the natural logarithm of green credit. The relative index model corresponds to return on total assets (or return on equity) and the ratio of green credit corresponds to the total loan scale. The control variables include macro indicators, such as GDP, interest rates, and exchange rates, and industrial indicators, such as the average net interest margin, market concentration, asset size, age (from the beginning of its establishment), and income cost ratio (operating efficiency). The descriptive statistics of these variables are in Table 1. Using the F Test, it can be found that the F statistics in Table 2 (line “F-test”) significantly reject the null hypothesis that there is no fixed effect; so, the fixed-effect model is superior to the mixed-effect model. Using the Hausman test (“Hausmangovernment has always emphasized environmental protection and sustainable development and has frequently introduced policies for industrial structure adjustments, but these policies have always achieved poor results [4–7]. In essence, the massive development of high energy consumption and heavy-pollution industries has benefited from large inflows of credit funds (based on the bank loan data of the listed enterprises, Liu Xiliang and Wen Shuyang (p v2019) alue)”), it iso found that the fixed-effect models are mostly superior to the random-effect models. Therefore, the fixed-effect model of individual characteristics is established as follows:
|
(1) |
|
|
(2) |
The is “six of the top ten industries with the amount of credit are highly polluting industries, and the avexplained variablerage emission of the relative index model, namely the ROA or ROE; corresponds to the explained variable of the absolute index model, namely the natural logarithm of net profit. and are the natural logarithm of green credit and the proportop ten industries with the amount of loan is about twice that of other industries”) [8,9]. The unbalanced allocation of green credit in the total loan, respresources objectively. . and are random disturbance terms. and are individual fixed effects.
Table 1. Desc promotes the continuous expansion of industriptive statistics.
|
Variable |
Variable Declaration |
Obs |
Mean |
SD |
Min |
Max |
|
ROA |
Return on total assets, % |
552 |
0.98 |
08.2 |
0.12 |
1.76 |
|
ROE |
Return on equity, % |
557 |
19.19 |
8.49 |
1.51 |
49.25 |
|
LnNP |
Logarithm of net profit, CNY 100 million |
573 |
4.19 |
1.77 |
−0.46 |
8.06 |
|
GreenLoanRate |
Green credit ratio, % |
368 |
3.74 |
4.08 |
06.0 |
29.37 |
|
GreenRateLnAsset |
Green credit ratio × Log of total assets |
368 |
38.55 |
45.17 |
0.50 |
328.64 |
|
LnGreenLoan |
Log of green credit, CNY 100 million |
368 |
5.15 |
2.24 |
0.47 |
9.82 |
|
GDP |
The local GDP growth rate, % |
602 |
8.86 |
3.25 |
−5.00 |
17.40 |
|
LnReGDP |
Log of the actual local GDP; CNY 100 million |
602 |
11.26 |
1.60 |
7.97 |
13.45 |
|
MarketShare |
The bank’s local market share (by deposits), % |
590 |
4.70 |
4.29 |
06.0 |
17.72 |
|
Age |
Age (from the date of establishment), year |
602 |
18.52 |
10.63 |
0 |
69 |
|
IfListed |
Listed or not, Yes: 1 and No: 0 |
602 |
09.4 |
00.5 |
0 |
1 |
|
INIM |
Average net interest margin of banking industry |
471 |
10.28 |
2.58 |
4.30 |
39.10 |
|
E |
Exchange rate, CNY/USD |
602 |
6.66 |
08.3 |
6.14 |
7.61 |
|
Evar |
Volatility of exchange rate (standard deviation) |
602 |
0.11 |
07.0 |
0.004 |
07.2 |
Aes with shimple comparison of the empirical results (Table 2) shows that the conclusions drawn by the relative indicator model (Model 1–2) and the absolute indicator model (Model 7–9) are quite different. Under the relative indicator model, the increase igh rates of energy consumption and pollution and aggravates the environmental pollution and environmental costs incurred on the proportion of green credit inhibits the financial performance of commercial banks, while the conclusion drawn by the absolute indicator model is just the opposite. This contrast may be leath towards economic growth. Therefore, the environmental problems caused by the rapid expansion of the total assets (denominator) in the relative index. Before 2007, only 7 of the 43 banks in the sample had been listed. The vast majority of Chinese commercial banks were listed in succession during the samplindustrial structure [10,11] can be attributed to the “financial mismatch” status of credit resources.
The preriod. The business scale of Chinese commercial banks is largely constrained by the asset management of the regulatory authorities. Whenfore, green development must rely on optimizing the function of the financing channel of the stock market is opened, commercial banks resolve the asset management constraints one after another by expanding the share capital to further promote the expansion of the asset scale. During the sample period, the average annual growth rate of the net assets of the sample banks was as high as 27.46%, while the corresponding growth rate of the net profits was only 18%. On the one hand, rapid capital expansion has diluted the return on average assets, causing the total profit and the proportion of green credit in China’sal allocation of resources, and green credit will be the most key link. In fact, the Chinese government has taken full action. For example, financial institutions, especially commercial banks, are asked to disclose environmental information, with banking industry in this special period to increase while causing the return on average assets and net assets to decline. On the other hand, the excessive expansion of assets and the scale of business may lead to a decline in the operating efficiency of commercial banks (this argument will be proved below).
Cofinancial institutions being required to regularly disclose financial information on their social and environmental responsibilities and on their support for energy conservation and emission reduction as well as to consideritang the interactive influence oftly refine their own asset scale (Model 3), the financial effect of the proportion of statistical standards for green credit is differentiated: banks with a lower asset scale than average (CNY 810.1 billion) are more likely to realize the positive effects of nformation. In terms of financial discounts for eligible green credit, green credit. On the one hand, under certain conditions, green credit policies are conducive to alleviating the decline in operating efficiency caused by the excessive capital expansion of Chinese co and green bonds should become eligible collateral for re-lending by commercial banks. On the other hand, it has been proven that sample selection plays an important role in the model results. Different studies in the literature have selected different sample individuals and sample periods, and the average asset size of those selected samples has also been different, causing different conclusions to be drawn.
Table 2. Regress Local governments are also rolling out policies to support green finance. For example, Zhejiang province took the lead by issuing the Guiding Opinions on Financial Suppon results for the different types of index models.
|
(1) |
ROA |
(2) |
ROA |
(3) | ROA |
(4) ROE |
(5) ROE |
(6) LnNP |
(7) LnNP |
(8) LnNP |
||
|
GreenLoanRate |
−0.0184 *** |
−0.0073 *** |
0.0899 *** |
−0.3313 *** |
−0.1458 * |
|
|
|
|
GreenRateLnAsset |
|
|
−0.0099 *** |
|
|
|
|
|
|
LnGreenLoan |
|
|
|
|
|
0.316 *** |
0.107 *** |
0.0520 *** |
|
GDP |
|
0.0257 *** |
|
|
0.646 *** |
|
0.0274 ** |
|
|
MarketShare |
|
|
−0.0231 ** |
|
|
|
|
0.108*** |
|
Age |
|
|
|
|
|
|
0.119 *** |
|
|
IfListed |
|
|
|
|
|
|
|
|
|
INIM |
|
|
|
|
|
|
−0.0448 *** |
|
|
E var |
|
|
|
|
|
|
−0.790 *** |
|
|
LnReGDP |
|
|
|
|
|
|
|
1.570 *** |
|
E |
|
−0.2784 *** |
|
|
|
|
|
−0.344 *** |
|
Constant |
1.0168 *** |
2.63 *** |
1.110 *** |
0.2942 *** |
14.43 *** |
3.327 *** |
2.247 *** |
−12.11 *** |
|
Observations |
368 |
368 |
368 |
368 |
368 |
368 |
337 |
368 |
|
R-squared |
0.0767 |
0.489 |
0.117 |
0.0716 |
0.337 |
0.545 |
0.683 |
0.816 |
|
Number of id |
43 |
43 |
43 |
43 |
43 |
43 |
41 |
43 |
|
F-Test |
11.09 |
15.32 |
10.75 |
55.58 |
72.42 |
47.43 |
52.57 |
55.84 |
|
Hausman (p value) |
0.0017 |
0.0112 |
0.0000 |
0.5514 |
0.3379 |
0.0000 |
0.0000 |
0.0000 |
Robrt to Achieve Peak Carbon Neust t-statistics in parentheses. *** p < 0.01, ** p < 0.05, * p < 0.1.
4.3. Cost Margin of Green Credit
According rality, esto the above analysis, the excessive capital expansion of Chinese commercial banks may lead to a decline in operating efficiency. Increasinglished a positive list of credit supports for green credit not only improves the operating profits, but also alleviates the problems caused by excessive capital expansion to a certain extent. In order to further verify and explore the relationship between green credit policies and the operation efficiency of commercial banks, this paper studies whether and how increasing green credit affects the operation of commercial banks by establishing elastic green credit models and input and output from the perspective of internal resource utilization efficiency:
|
(3) |
, and low-carbon development, and set up “zero carbon” pilot units and low-carbon industrial parks. In addition, a series of measures have been introduced, such as setting up carbon accounts for key enterprises and public insthe input variable, represents the management costs; the number of employees and the number of business outlets are selected as the corresponding input variables, which are the explained variables taken from the natural logarithm. is the logarithm of the amount of green credit, represents a seritutions with carbon emissions and fostering regional environmental rights trading markets. Since 2016, Xiamen has offered different degrees of the control variables, and is the random interference term. In order to compare the costs and benefits of green credit, the natural logarithm of the net profit is added tincentives, loan discounts, and risk-sharing compensation to the explained variable. In this paper, the individual fixed effect was used for regression analysis.
Tfinancial industry based on the results of Model 9–11(in Table 3) support the view tcale of green credit.
Thate “an increase in the proportion oessence of green credit will increase business costs”. Many scholars, such as He Dexu and Zhang Xuelan [46], believe that green credit increases the management costs incurred by project identificis to solve the externalities of the environment and finance for the green transformation in the credit process of commercial banks, such as via project evaluation by external experts and targeted staff training, etc. Model 9 verifies this view. Model 10 and Model 11 show that increasing the amount of green credit not only significantly increases the management cost, but also promotes increasing the number of staff and outlets. Specifically, when theof the economy. Its role in environmental protection is self-evident, and the relevant economic research focuses more on the market mechanism of green credit ratio increases by 1%, costs rise by an average of 0.05%. Compared to the increase in cost. In the short term, green credit also significantly improves net profit, and the coefficient is slightly higher than the increase in cost, which indicates that the increase in green credit business may bring income to commercial banks that is twice the increase in cost. This further shows that green credit businesses are more efficient in using cost inputs than traditional credit businesses.
Table 3. Regressdevelopment policies will have a certain impact on the national economy, especially in some traditional industries with high levels of pollution and energy consumption. For developion of green credit on costs and profit.
|
(8) |
LnNP |
(9) |
LnAdminCost |
(10) |
LnStaff |
(11) |
LnBranch |
|
LnGreenLoan |
0.0520 *** |
0.0641 *** |
0.0506 *** |
0.0491 *** |
|
MarketShare |
0.108 *** |
0.0998 *** |
0.114 *** |
0.115 *** |
|
LnReGDP |
1.570 *** |
1.241 *** |
0.810 *** |
0.868 *** |
|
E |
−0.344 *** |
−0.130 *** |
−0.124 *** |
−0.106 *** |
|
Constant |
−12.11 *** |
−9.738 *** |
0.368 |
3.835 *** |
|
Observations |
368 |
368 |
368 |
368 |
|
R-squared |
0.816 |
0.880 |
0.758 |
0.689 |
|
Number of id |
43 |
43 |
43 |
43 |
|
F-Test |
55.84 |
122.06 |
93.37 |
93.26 |
|
Hausman (p value) |
0.0000 |
0.0000 |
0.0000 |
0.0000 |
Robug countriest, t-statistics in parentheses. *** p < 0.01, ** p < 0.05, * p < 0.1.
So fsuch industries ar, we have proved Hypothesis 1; that is, green credit policies improve the operating profits of commercial banks. In athe pillar of their national economy in the early stages of development. Addition, it was determined that compared to general loans,ally, the role of green credit also significantly increases the cost input of commercial banks. In order to through financial leverage has further analyze the mechanism iincreased the influencing green credit policies and to combine with the conclusions that have already been obtained, this paper puts forward Hypothesis 2:
Hypothesis 2 (H2). Increasing the proportion of green credit will improve the operating efficiency of commercial banks by improving the utilization rate and allocation efficiency of internal resources.
- The Operation Efficiency of Commercial Banks
Accore of this impact. On the other hand, the global economy is under downward pressure dingue to the conclusions of Section 4, excessive capital expansion speed may lead to a decrease in the internal resource allocation efficiency of Chinese commercial banks and improving the green credit ratio not only pushes up the business costs of banks, it also createsimpact of COVID-19, while it is also being buffeted by various extreme events that have several times more profit. These findings provide market evidence for green credit policies improving the operational efficiency of commercial banks, but these findings only support this inference from the results, and there is a lack of systematic and dynamic discussion on the principles and processes. Is the rate at which the assets of commercial banks are expanding really reasonable? Is there an optimal asset size or allocation structure for internal resources? Additionally, can increasing green credit have an impact oely affected financial stability. In this context, should we strengthen our confidence and further promote economic transformation with green credit? Are green credit policy incentives compatible in the resource allocation efficiency of commercial banks? Thmarket economy? Before answers to ting these questions are the key to , we must further exploring how green credit policies affect the oclarify the market operational efficiency of commercial banks mechanism of green credit. This requires us to analyze the relationship betweenpaper studies the market logic of green credit policies and the operational efficiency of from the perspective of Chinese commercial banks, not only from the perspective of the operating results, but also from the perspective of the operating processes. In view of this, this paper will take the input–output efficiency as and tries to determine the long-term market effect of green credit from the starting point to explore the impact of changes in the proportion of of whether green credit on business efficiency and will carry out research from ais in line with the interests of commercial banks.
- Related Literature
The msore comprehensive perspective.
Here,-called green credit input–output efficienolicy refers to the concept of technical efficiency in economics; that is, under certain technical conditions, when it is impossible to increase any output without reducing other output, or it is impossible to reduce any input without increasing other input, then the input–output is technically efficient [53]. Therefore, technical efficiency refers to thea series of policies that allow commercial banks, policy banks, and other financial institutions to offer preferential interest rates for loans to enterprises or institutions that are engaged in ecological protection and the development and utilization level of the existing technology. Common influencing factors include the quality of the workersof new sources of energy and the management level. Farrell [54] useat develop and production frontier analysis to measure technical efficiency for the first time, which was widely recognized by the theoretical circle of researchers and became the basis of the efficiency measurements. The so-called production frontier refers to the maximum output set corresponding to various proportional inputs at a certain technical level. The core oe anti-pollution facilities; meanwhile, the policy also includes a high, punishment interest rate that is implemented to limit loans for the investment and working capital of new projects carried out by polluting means of production, frontier analysis, is the effective frontier, that is, analysis in and enterprises. The purpose is to guide the form of the production function. In terms of methods, it includes parametric analysis with a specific function form and a non-parametric method without a specific function form. The former is represented by stochastic frontier analysis (SFA) and parametric metafrontier analysis. The latter is represented by data envelope analysis (DEA).
DEA ilow of funds and loans into the enterprises and institutions that promote the national environmental protection cause and to appropriately withdraw from the enterprises and non-parametric analysis method that was first proposed by A. Charnes, W.W. Cooper, and E. Rhodes [55] in 1978 and was developed on the basis of evaluating relative efficiency. As a non-parametric analysis, DEA can calculate the efficiency value without setting the specific fprojects that destroy and pollute the environment to realize the “green allocation” of funds [12]. The capital allocation function form of production, which has a wide range of applications. In the process of analyzing the input–output efficiency of commercial banks, it is difficult to find an effective functional form between input (such as staff and outlets) and output (such as net profit). Therefore, this paper adopts the DEA method to analyze the operating efficiency of commercial banks (if it is a functional form, then net profit is the explained variable, and the number of employees and outlets is the explanatory variable. It should be considered whether there is an optimal proportion between employees and outlets, which often varies greatly for different types of commercial banks in different regions, and this optimof green credit means that the role of environmental governance can be carried out from the initial stages of the production process and can run through the whole production stage; that is, the incentive and restraint effect of green credit has the characteristics of initial governance and whole-cycle governance [13]. The earliest official proportion often varies over time. Therefore, insufficient degrees of freedom should be considered during parameter estimation).
Ssals for green credit date back to therman and Gold [56] were the first to apply DEA to banking efficiency, and later scholars followearly 1990s, when the United Nations Environmental Program Finance Initiative (UNEPFI) issued their methods [57–59]. A key to measuring the operational efficiency of commercial banks with DEA is to identify the inpu “Statement by Financial Institutions on the Environment and output. There are three main classification methods: production methods, asset methods, and intermediary methods. Production methods view banks as general productive enterprises. The input production Sustainable Development” [14], which stressed the need to incorporate environmental factors mainly include employees, machinery and equipment, capital, etc., and the output factors include deposits and loans. According to the intermediary method,into standard risk-assessment processes. Its main goal was to require the bank is the medium of borrowing and lending; that is, it produces the absorbed deposits as loans, and other inputs also include human resources, financial resources, material resources, and other elements. Foring industry to consider environmental factors in its management activities and to encourage the property method, the index classification is closely related to the balance sheet. The input index is the liability item, and the output is the asset item. The amount of a loan is often taken as the most important output indicator, while deposits can be classified differently. Other indicators, such as manpower, equipment assets, and capital input, generally appear in the form of input factors.
The DEA model iivate sector to invest in environmentally beneficial technologies and services. The Equator Principles, advocated for by the World Bank Group, provide a framework for environmental and social-risk ass essentially a target optimization problem under a given constraint. As a modern enterprise, the ultimate goal is undoubtedly to pursue profit maximization rather than to maximize the loan amount. In fact, commercial banks expand the size of depositsment in project financing, including the risk classification of different types of projects, and loans to maximize their total profit by increasing the scale. The classification methods for deposits are the inputist topics related to environmental assessment processes, monitoring, and loans are the output, showing how commercial banks continue to consider debt management similarly to how it was considered in the 1960s and 1970s. This paper does not take loans as output and instead replaces them with net profit. Considering the importance of the asset security of commercial banks to the ffollow-up guidance. At present, 56 financial institutions around the world, including Citigroup, Standard Chartered, and HSBC, have become Equator Principle Financial system and even to the national economy, we added the non-performing loan rate as an undesirable output to the optimization target. In fact, trade-offs between safety and profitability often occur; so, coInstitutions (“EPFIs”), accounting for more than 90% of the global project financing market. By the end of 2021, nine Chinese mainland commercial bank managers and regulators need to make two-goal trade-offs. In s had incorporated the Equator Principles, which are also the practice, commercial banks have different priorities for different goals in different periods. For example, in a period when the non-performing loan ratio is lower than 1%, it is more important to improve the net profit level than to further reduce the non-performing loan ratio, while the opposite is true when the non-performing loan ratio is higher than 5%. In view of this, we considered a mal blueprint for green credit in China’s banking industry (From the Preamble of the Equator Principles, www.equator-principles.com (accessed on 16 March 2022)).
Multi-objective weight problem for dynamic intertarget trade-offs at different risk levels.
5.1. Theory and Methods
Ih of the research on green this papecr, the directional distance function (DDF) was used to measure the input–output efficiency. xedit is based on a corporate perspective. represents tChe inputs, and the outputs are divided into desirable outputinese enterprises y and non-desirable outputs b. The prode usuction possibiallity set is:
(4) |
and ty he corresponding non-radial DDF is
(5) |
,) is the ghly direction of improvement, and is the adjustment amount for the input–output that is not limited by a fixed proportion. Based on the studies related to SBM-DDF [60–62], we also dynamically set the weights w of the inputs and outputs in the objective function.It was transformed into a linear programming problem using panel data with an individual number J and time dimension Γ (assuming the same scale remuneration production mode, variable scale remuneration only needs to add convexity conditions):
(6) |
(7) |
In thpendent on external financing, and credit resources are the “blood” of enterprise development. There is a long-term “financial mismatch” in China, where financial resources are concentrated in state-owned ente above exrpression, the letter with lower indices is a scalar valueises, large enterprises, and the letter without lower indices is a vector. In accordance with the above, x, y, ahot industries [15,16], and the end b terepresent input, desirable output, and undesirable output, respectively. ,) and ,) are the adjustment directions and adjustment quantities of these three variables, respectively; , and are the relaxation variables representing the three variables, respectively; is theises with high levels of pollution and energy consumption mentioned above are mainly subject to government intervention [17,18] and credit rationing [19,20]. The green credit λ vapolue (intensity variable) of the Jth DMU at time τ.
The setticy tries to change of the efficient reference frame, namely the effective frontier, is crucial. The effective frontier is usually dividedthis “financial mismatch” phenomenon by introducing high-pollution investment into the biennial, sequential, and global frontiers in the scope of time. The main difference lies in the period range of data used to determine the effective frontier. It corresponds to the data from the previous two years and to the sequential and sample data for the whole period. In order to facilitate the efficiency comparison in different periods, this paper adopts the global SBM-DDF.
5.2. Variable Selection and Data Description
Ihigher financing constraints and by internalizing the negative externality of corporate pollution emissions, thus having a profound impact on China’s industrial pattern this pape.
Fr, a production method is adopted, and the number of employees, the number of business organizations, the fixed assets, and the other input variables are adopted as output indicators. According to the above analysis, net profit is used to replace the amount of deposits and loans as the desirable output (the larger the better), and the non-performing loan ratio is taken as the undesirable output. Considering multi-objective dynamic coordination, this paper dynamically adjusts the weight of the non-performing loan ratio and the net profit output. The weight of the net profit is set as 1, and the weight of the non-performing loan ratio is dynamically adjusted according to the actual situation. The specific method is as follows: first, work out the average value of the non-performing loan ratio for all of the sample banks each year. The dynamic weight adjustment rule of the non-performing loan ratio is as follows: if the non-performing loan ratio is less tham the implementation effect, there is a lot of evidence that green credit boosts the green and high-quality development of the economy. For enterprises in high-polluting industries, the green credit policy significantly reduces the credit financing of enterprises in heavy-polluting industries, which not only redirects the resources from low-efficiency enterprises to high-efficiency enterprises [21], but also promotes the green innovation in high-polluting enterprises [13,22]. Green credit has a significant effect on reducing the friction costs and risk coefficients in various industries [23]. On the average valueother hand, the weight is 0.2; if the ratio is greater than average, but less than 5%, then the weight is 0.6; if the ratio is greater than 5%, the weight is set to 1 (during the sample periodnational conditions result in green credit having policy effects that cause enterprises to show certain Chinese characteristics. For example, the average was 1.36%m, with a minimum of 0.76 and a maximum of 2.27%, never exceeding 5%). The descriptive statistics of these variables are in Table 4.
Table 4. Dcredit-approval features of Chinese commercial banks that emphascriptive statistics for operational efficiency analysis.
Type of Variable |
Variable |
Variable Declaration |
Mean |
Max |
Min |
SD |
Input |
Staff |
Total number of working employees |
59,047.05 |
503,082 |
775 | 118,241.16 |
|||||
|
Branch |
Total number of business outlets |
2438.59 |
24,452 |
21 |
5316.64 |
|
|
FixedAsset |
Fixed asset value, CNY 100 million |
215.90 |
2535.25 |
1.31 |
475.72 |
|
|
AdminCost |
The administrative expenses incurred (excluding asset impairment provisions), CNY 100 million |
256.15 |
1990.50 |
1.57 |
448.81 |
|
|
Desirable output |
NP |
Total net profit, CNY 100 million |
287.42 |
3176.85 |
0.63 |
573.85 |
|
Undesirable output |
wNPLR |
Dynamically adjusted non-performing loan ratio, % |
0.63 |
9.81 |
0.00 |
0.75 |
|
Efficiency measure |
Dv |
Non-radial distance from the effective boundary |
2.33 |
14.77 |
0.00 |
1.44 |
5.3. Analysis of Business Efficiency
Theize mortgages [24] cause green credit npon-radial distance was obtained. The smaller the value of the distance, the closer it is to the corresponding effective point and the higher the efficiency value. The non-radial distance between the points on the efficiency boundary was 0. For better understanding, this distance was further normalized by means of min-max normalization, resulting in an efficiency score of 0–100, with higher scores resulting inlicies to have less of an impact on highly polluting enterprises with high fixed assets [25]. Sun et al. [26] found that green credit policies can motivate Chinese enterprises to focus on front-end prevention and control rather than on terminal emission reduction.
The greater efficiency. Anotheresearch result of the SBM model is the slack variable. The slack variable is the amount of each input (or output) variables on the impact of green credit on commercial banks are divided. Many scholars believe that should be reduced (increased) when the efficiency is improved. Therefore, the smaller the slack variable of a factor isgreen credit has a positive effect on commercial banks. First, the higher the utilizimplementation efficiency of the factor is (the relaxation variable of the non-satisfactory output refers to the number of efficiencyof a green credit policy can improvements that should be reduced).
Over the sociall, as we can see in Figure 4, the operating efficiency of Chinese image of commercial banks has declined since they reached their peak in 2011.This is consistent with the previous discussion on how “excessive capital expansion leads to a decline in operating efficiency”. In 2008–2011, the efficiency scores rose rapidly as each slack variable declined (in order to increase the comparability between different slack variables, this paper represents the change rates in the slack variables. The larger the change rate, the lower the factor efficiency corresponding to the slack variable). It can be seen that the most important force leadfrom the perspectives of media attention and recognition from customers, employees, and partners. For example, more social reports on green credit [27] and the disclosure of public announcements [28] can enable commercial banks to gain more public trust by improving this wave of operational efficiency improvements is the sharp increase in net profit, which is closely related to rapid economic recovery in the post-financial crisis, and a good economy promotes the improvement of the utilization efficiency of various input factors. During the period of 2011–2017, the overall operating efficiency gradually decreased. In terms of slack variables, the efficiency of all of the inputs and outputs shows varying degrees of decline during this periodeir reputation. In contrast, there is evidence that commercial banks regard some major polluting enterprises as important loan-provision objects that will affect their green reputation, lead to the loss of high-quality customer resources, and the most obvious feature is the decline in the control efficiency of the non-performing loan ratio. All of the indicators showed a brief small rally in 2017–2019. Affected by the COVID-19 epidemic, the operating efficiency in 2020 showed a sharp decline. As seen from the figure, the most important reason for this comes from the rapid decline in net profitsresult in reductions and fluctuations in the financial performance level [29]. Second, the implantation of a green policy can reduce the environmental risks of the loan customer.
O In the olither hand, compared to other inputs, the inefficient use of fixed assets and business outlets is more prominent and has existed for a long time. Among them, the number of business outlets before 2009 was the minimum efficiency investment, which is consistent with the conclusion of the research performed by Wang Bing and Zhu Ning [63]. The rate at which personnel are utilized and the management expenses gradually converge, a phenomenon that can be explained by saying that the efficiency of management expenses is gradually determined by how efficiently employees are used. The biggest factor causing the fluctuations in the overall operating efficiency ierature, environmental risk generally includes climate risk and environmental-regulation risk. China’s current credit resources flow into industries with high energy consumption, high pollution, and excess capacity (hereinafter referred to as the “Two High and One Surplus”) [8,9]; this process makes the substantial adjustments in net profit, followed by the non-performing loan ratio.
From the pervalue of the credit asspective of different typets of commercial banks(in Figure 5), the operating efficiency of large state-owned banks has risen to the highest level in the industry through a series of measures such as capital injection, bad debt stripping, shareholding reform, among other more sensitive to environmental regulations, energy price fluctuations, and market demand changes. These measures have resulted in strong national joint-stock commercial banks. In contrast, the city commercial banks cannot compete with the national banks due to the restrictions of their operating areas, and they have to compete with rural commercial banks for tight regional resources, resulting in the operating efficiency declining. Rural commercial banks have a low level of operating efficiency. The efficiency stratification of different types of banks is basically consistent with the study of Li Lifang et al. [64re is evidence that green credit can effectively reduce the probability of loan losses caused by environmental regulations [30,31]. Climate risk affects the ability for loans to be repaid by changing the business cash flow of borrowers [32]. From t
Sche perspective of commercial banks in different regions, the economic environment plays a significant role in dividing them into different efficiency categories (in Figure 6). Commercial banks in the east have the highest operating efficiency, other than national banks, and the operating efficiency of commercial banks in the central and western regions is low.
Figure 4. Average operlars with the opposite point of view believe that green credit increases business costs (Ma and Liu, 2013; Hu and Zhang, 2016) and squeezes out the “Two High and One Surplus” loating efficiency and slack variabless (Chen and Lu, 2011).
Figure 5. Operating Evefficiencies of the different types of n the decision by commercial banks.
Figure 6. O to adopt therating efficiencies of commercial banks in different regions.
- Green Credit and Bank Operating Efficiency
Wh Equator Principles will bring a doublen comparing the trends in the blow to operating efficiency of commercial banks and the proportion of green credit, the average value of green credit is easily affected by extreme values due to the limitations in the amount of information that is publicly disclosed, thus affecting the accuracy costs and profits (Scholtens and Dam, 2007). However, Maya et al. (Finger and Gavious et al., 2018) showed that most of the conclusions. As shown in the left figure below, if the proportion of green credit is simply averaged, then there is a certain negative correlation with the operating efficiency; that is, the higher the proportion of green credit is, the lower the operating efficiency of the banks is as well. In cases where the sample size is small, this simple average method is easilyse results occurred in developing countries, while the situation was reversed in developed countries. The study of Cao Junxin and Yao Bin (Cao and Yao, 2014) found that carbon emission reduction measures would reduce industry profits and affected by large values, thus resulting in wrong judgments. For example, the green the quality of bank credit ratio in industrial banks has been 3–7 times assets.
Schigheolar than the average ratio for a long time. In order to eliminate these influences, the method proposed in this paper standardizes the deviation of each bank’s s who hold a neutral view emphasize case-by-case analysis. The impact of green credit ratio in its own time series and then averages it in years to determine the average green credit ratio for each year. The same treatment is performed on the operating efficiency to obtain the average efficiency score. This processing method highlights the rising and falling trends in the data over time, smooths the influence of extreme values, and fits the average trend better. The final results are shown in Figure 7. It can be seen from the figure on the right that thon commercial banks is moderated by several factors, such as bank size: large banks have advantages such as cost amortization and customer resources and can benefit more from increasing the proportion of green credit after the standardized treatments is positively correlated with the efficiency score to a certain extent; that is, the higher the proportion of green credit, the higher the operation efficiency of the banks. A regression model is used to verify this below.
|
|
( |
a |
) Rate of green loans and efficiency |
( |
b |
) Rate of green loans and efficiency |
(simple arithmetic mean) |
(standardized by individual banks) |
Figure 7. Gree [33]. However, the research results of Zhang Lin and Lian Yonghui [34] are in contrast to this. Tong Menghua et al. [35] believe that commercial banks will lose customers due to “one-size-fits-all” carbon credit ratio and operating efficiency (trend comparison under different averaging methods).
6.1. Model and Variables
Comparedmission reduction policies and advocate for the establishment to the panel data from the mixed-effect model, the individual fixed-effect model eliminates the influence of individual characteristics that do not change the average effect in the form of difference over time and can eliminate the influence of extreme individuals without reducing the sample size. Therefore, this paper takes the f a “carbon emission reduction credit risk warning system for industrial enterprises” to ensure that commercial banks can maximize their interests when implementing green credit policies.
In terams of metio as the core explanatory variable and adopts an individual fixed-effect model to analyze the non-radial distance and each slack variable (here, the slackhods, most of the research in the literature takes the financial index of commercial banks as the explained variables decrease and the proportion of inputs and undesirable outputs and increase the proportion of desirable outputs. It can be seen that the larger the slack variable, the lower the efficiency. Therefore, if the green credit as the core explanatory variable to establish panel data linear regression coefficient. In terms of the proportion of green credit is significantly negative, it shows that increasing the amount of green credit can improve the efficiency, and vice versa):
, |
(8) |
. |
(9) |
and aexplained variables, many scholars take return on total assets as the explained variable [34,36]. Some scholares the non-radial distance and green credit ratio, respectively. representhave also used self-built comprehensive indexes as the slackexplained variables of the inputs and outputs, and and are, such as the bank competitiveness index [37] or the control variables for two modelsmprehensive evaluation index [38,39].
The and are the random interference terms. and are individual fixedlevant literature not only analyzes the positive effects. China’s supply of of green credit resources demonstrates a certain regional segmentation phenomenon [65]; that is, there is a large amount of funds clustered in some regions. Therefore, regional variables may have an impact on the operational efficiency and the policies on commercial banks from the perspectives of social responsibility and environmental risks, but also points out the negative effects of green credit ratio of commercial banks. We introduced regional GDP, regional financial depth, and regional market share into the control variables. Furthermore, individual factors such as age and asset size were added into the control policies from the aspects of increased costs and customer loss. Most research methods use return on assets or comprehensive financial indicators as the explained variables to reduce the endogeneity of the model. The descriptive statistics of theseand the core of green credit as an accounted-for explained variables are in Table 5.
Table 5. Des in a cripontive statistics (regression of green credit ratio and operating efficiency).
Variable |
Variable Declaration |
Obs |
Mean |
S |
D |
Min |
Max |
Dv |
Non-radial distance |
491 |
2.326 |
1.439 |
0 |
14.766 |
B Branch |
Slack variable of branch |
491 | ||||||
0.463 |
0.265 |
0 |
0.934 |
|||
|
B Staff |
Slack variable of staff |
491 |
0.326 |
0.212 |
0 |
0.902 |
|
B FixedAsset |
Slack variable of fixed assets; CNY 100 million |
491 |
0.53 |
0.30 |
0 |
0.96 |
|
B AdminCost |
Slack variable of management cost; CNY 100 million |
491 |
0.25 |
0.21 |
0 |
0.80 |
|
B wNPLR |
Slack variables of dynamic non-performing loan ratio; % |
491 |
0.55 |
0.30 |
0 |
0.98 |
|
B NP |
Slack variables of net profit; CNY 100 million |
491 |
0.20 |
1.06 |
0 |
14.19 |
|
GreenLoanRate |
Green credit ratio; % |
368 |
3.74 |
4.082 |
0.06 |
29.37 |
|
LnAsset |
Log of total assets; CNY 100 million |
568 |
9 |
1.741 |
5.11 |
12.72 |
|
LnReGDP |
Log of the actual GDP of the area: CNY 100 million |
602 |
11.26 |
1.604 |
7.97 |
13.45 |
|
GDP |
Regional GDP growth rate; % |
602 |
8.86 |
3.25 |
−5 |
17.4 |
|
FinInspPop |
Financial depth: the number of financial institutions per capita in the region; individual/10,000 people |
602 |
1.58 |
0.23 |
1.03 |
2.33 |
|
Age |
Age: from the date of establishment; year |
602 |
18.52 |
10.63 |
−4 |
69 |
|
MarketShare |
Market share: the bank in its region (by deposits); % |
590 |
4.70 |
4.29 |
0.06 |
17.72 |
|
PFEpGDP |
Public fiscal expenditure accounted per GDP; % |
602 |
19.61 |
5.55 |
8.74 |
40.22 |
6.2. Empirical Results
Frolled variable linearom the regression results, it can be seen that increasing the proportion of green credit in commercial banks will improve all aspects of their operating efficiency. All else being equal, each percentage point increase inseries. These rich research methods and empirical conclusions allow us not only to further explore the green credit brings commercial banks closer to the effective boundary by 0.07 units on average (Table 6). This proves that green credit policies can effectively improve the allocation efficiency of the internal resourcfinancial market mechanism and to lay a solid foundation, but also to leave space for further research, with potential avenues of commercial banks. Through the regression of theresearch including updating the data, as most of China’s green credit ratio to the slack variable (Table 7), it can be seen that during the operation of esearch data are from 2017 and are related to commercial banks, increasing the proportion of . The existing green credit can significantly improve the efficiency of all of the inputs and outputs. Among them, improvdata imperfectly disclose regulations, meaning the efficiency has the biggest effect on the net profits. All other things being equal, an average percentage point in at free disclosure exists in terms of disclosing the green credit ratio of one can promote the net profit index towards its corresponding effective standard by 3.31. Improving the efficiency of the non-performing loan ratio is also obvious, a finding that is supported by the market data of commercial banks. Thus, due to the lack-of-interruption phenomenon, it is difficult to update the data. For example, according to data from the CBRC in June 2016, the non-performing green credit ratio of 21 major banks was only 0.41%, 1.35% lower than that of other loans during the same period (http://www.cbirc.gov.cn/cn/view/pages/ItemDetail_gdsj.html?docId=22943&docType=0, accessed on 8 April 2022).
TAdditionally, 2016 represents the first year of green finance in China, and the excessive speed of capital expansion leads to Chinese commercial banks having excessive internal resources, resulting in the gradual decline of the overall operating efficiency after 2011. In essence, green credit policies increase the green credit ratio; on the one hand, they make more effective use of the excess internal resources, and on the other hand, they improve the allocation efficiency of internal resources, alleviating the problem of low operating efficiency. This proves Hypothesis 2.
Table 6. The ata from subsequent years are more meaningful. The sample size needs to be expanded. Additionally, due to limited relevant information regarding disclosure regressulation results for the green credit ratio on non-radial distances.
|
|
(1) |
(2) |
(3) |
|
Dv |
Dv |
Dv |
|
|
GreenLoanRate |
−0.0863 *** |
−0.0663 *** |
−0.0551 *** |
|
LnAsset |
|
1.063 *** |
|
|
LnReGDP |
|
−3.444 *** |
−4.833 *** |
|
FinInspPop |
|
2.919 *** |
|
|
age |
|
|
0.295 *** |
|
MarketShare |
|
|
0.218 *** |
|
Constant |
2.508 *** |
27.97 *** |
51.91 *** |
|
|
|
|
|
|
Observations |
368 |
368 |
368 |
|
R-squared |
0.055 |
0.157 |
0.232 |
|
Number of id |
43 |
43 |
43 |
|
F-Test |
8.93 |
9.07 |
11.33 |
|
Hausman (p value) |
0.000 |
0.000 |
0.000 |
Sdefects, the vast majority of the literatandaurd errors in parentheses. *** p < 0.01, ** p < 0.05, * p < 0.1.
Table 7. Regresse is limion results of the green credit ratio on the slack variables.
|
|
(1) |
(2) |
(3) |
(4) |
(5) |
(6) |
(7) |
|
B_Branch |
B_Branch |
B_Staff |
B_FixedAsset |
B_AdminCost |
B_wNPLR |
B_NP |
|
|
GreenLoanRate |
−0.0119 *** |
−0.0184 *** |
−0.0123 *** |
−0.0192 *** |
−0.00907 *** |
−0.0238 *** |
−0.0331 ** |
|
GDP |
0.0201 *** |
|
|
|
|
|
|
|
MarketShare |
0.0384 *** |
|
|
|
|
|
|
|
PFEpGDP |
|
|
|
|
|
|
0.183 *** |
|
Constant |
0.146 *** |
0.511 *** |
0.365 *** |
0.570 *** |
0.313 *** |
0.634 *** |
−3.641 *** |
|
Observations |
368 |
368 |
368 |
368 |
368 |
368 |
368 |
|
R-squared |
0.232 |
0.098 |
0.044 |
0.073 |
0.042 |
0.078 |
0.155 |
|
Number of id |
43 |
43 |
43 |
43 |
43 |
43 |
43 |
|
F-Test |
27.12 |
22.69 |
10.42 |
14.74 |
19.65 |
8.87 |
3.04 |
|
Hausman (p value) |
0.0338 |
0.000 |
0.000 |
0.000 |
0.000 |
0.000 |
0.000 |
Sed to listandared errors in parentheses. ***companies p < 0.01, ** p < 0.05, * p < 0.1.
- Discussion of Endogeneity and the Robustness Test
7.1. Discussion of Endogeneity
As there is policy space for thet disclosure of green credit data,e their data to commercial banks can choose the green credit data that they wish to publish to a certain extent. Therefore, the samples that can be collected may be from commercial banks with a high proportion of green credit, and most banks and some influential city businesses come to the market late. This potential problem leads to the possibility of endogeneity caused by a non-random sample (self-selection bias); that is,not only causes under-represented defects, but also partly explains the use of the sample selection is endogenous. Oe methods in the other hand, some important variables related to the proportion of green credit may be omitted from the model. Heckman’s two-stage methodliterature; however, different results have been achieved, and the instrumental variablethree research method are used to discuss the above two types of endogeneity problems.
Fos need to be enriched. The return non-random sample problems, this paper refers to Heckman’s [66] two-stage method and introduces the non-randomness of the sample into the original regression model in the form of a on assets or return on equity is taken as the explained variable called the inverse Mills ratio (IMR) to solve the self-selection bias problem , and its fluctuation is easily affected by changes in the regression model.
|
(10) |
|
|
(11) |
|
|
(12) |
|
|
(13) |
iasset s a dtructummy variable. If a bank publishes green credit data in that year, then the corresponding value is 1; otherwise, it is 0. is a potential factor that affects whether banks publish green credit data, including the ages of the banks, whether they are listed, and the competition statusre (for example, the return on assets decreases due to capital and stock increases). However, most of the industry. In this paper, we established a logistic model to analyze the relationship between and through the intermediatestudies in the literature do not control this variable . and are the probability density function values and the cumulative distribution function values corresponding to the fitting value, respectively, and the two are divided to calculate the inverse Mills ratio . represents the green credit ratio, and is the corresponding control variable (the same as above). and are the residual terms for the two models, respectively. and are individual fixed effects.
In, resulting in differences in the research conclusions. A single income index fails to fully describe the operation of commercial banks, while the comprehensive indicator method fails thiso paper, the instrumental variable method is used to analyze possible missing variable problems. In order to meet the relevance and externality principle of instrumental variable selection, we took the local implementation intensity of environmental protection as the direction of selection and constructed “the operating cost of grasp the phased coordination under multiple objectives (for example, when the non-performing loan ratio is low, the pursuit of the maximum return rate is a more important goal).
Thindustrial waste gas treatment facilities/sulfur dioxide emissions” as the indicator for the intensity of environmental protection implementation. Because of the rapid spillover of environmental technology, the average cost of waste gas treatment does not fluctuate much from region to region. Therefore, the ratio of the operating costs of industrial waste gas treatment facilities to sulfur dioxide emissions can reflect a region’s emission tolerance paper will make adjustments to the above points, try to explain the differences in the conclusions of previous studies, and analyze the effect of green credit on commercial banks from the two angles of financial results and operation efficiency. The lower the environmental tolerance, the greater the demand for green projects, and the higher the proportion of green credit that commercial banks in a region have. On the other handresearch in this paper mainly analyzes the theoretical analysis of the two types of innovation. (1) When analyzing the theory, there is a high correlation between the behavior of local officials and the credit structure of banks [65,67]. Government officials who are involved in promotion tournaments are limited by environmental assessment when pursuing GDP targets [68]. Therefore, the environmental tolerance of local government officials has a strong correlation with the distinct lack of research on the impact mechanism in most of the literature, with most studies establishing a regression model of the financial indicators of green credit behavior ofand commercial banks within the jurisdiction. From the perspective of externality, environmental tolerance refers to the environmental awareness of the regional government, which is hardly affected by factors related to the operation perand discussing the effects of green credit policies on the financial performance of local ccommercial banks.
As seen from the regressionmpirical results (Table 8), the inverse Mills ratio (IMR) is significant, indicating the existence of non-random sample problems. After modification, the positive effect of green credit of the model. In contrast, we have carried out a full research methodology on the operating efficiency of banks is improved (the coefficient increases from 0.0663 to 0.0692). From the perspective of the instrumental variable method (Model 4–5), environmental tolerance (OEIWGpSo2) has a certain correlation with the proportionimpact mechanism: on the one hand, it reveals that the characteristics of green credit, and endogeneity problems may underestimate the promotion effect of green credit on improving the operational efficiency of banks.
Table 8. The regress“low risk and high income”, are important mechanion results of the endogenous tests.
|
(1) |
(2) |
(3) |
(4) |
(5) |
Dv |
Dv |
Dv |
GreenLoanRate |
Dv |
GreenLoanRate |
−0.0663 *** |
−0.0692 *** |
−0.0883 *** |
|
−0.344 ** |
LnAsset |
1.063 *** |
1.447 *** |
| |||||
|
|
||||
|
LnReGDP |
−3.444 *** |
−3.392 *** |
|
|
|
|
FinInspPop |
2.919 *** |
3.697 *** |
|
|
|
|
imr |
|
2.312 ** |
|
|
|
|
MarketShare |
|
|
0.198 *** |
|
0.119 ** |
|
r |
|
|
−0.370 *** |
|
−0.350 *** |
|
OEIWGpSo2 |
|
|
|
0.0503 ** |
|
|
Constant |
27.97 *** |
21.51 *** |
2.420 *** |
3.442 *** |
3.677 *** |
|
Observations |
368 |
368 |
368 |
325 |
325 |
|
R-squared |
0.157 |
0.173 |
0.168 |
0.015 |
|
|
Number of id |
43 |
43 |
43 |
43 |
43 |
Standams ford errors in parentheses. *** p < 0.01, ** p < 0.05, * p < 0.1.
7.2. Test of Robustness
Whether meaimproving the business suring the operational efficiency tuation of commercial banks can effectively reflect objective facts is the key to determining whether. On the other hand, combined with the conclusions of this paper are reliable. During the DEA analysisin the literature and of the efficiency, the weight change rule of the objective function is set in this paper, which may afinancial analyses, different index types affect the reliability of the conclusions. Therefore, the rule will be reset to test the robustness of the modeling results, with the modeling results. Specifically, the weight of net profit is still set as 1, and the tolerance of non-performing loans is reduced: when the non-performing loan ratio is lower than the industry average, the weight is set as 1; whe pointing out that capital expansion is too fast and that the decline in the non-performing loan ratio is higher than the average but lower than 5%, the weight is set as 1.2; if it is above 5%, the weight is 1.5. The other methods remain unchanged.
Byefficiency of internal resources is the main reason cfomparing the influences of different weight setting rules on the results (Tables 7 and 9), we can see that the significance of the regression coefficient remains unchanged after the rules that have been set for the dynamic weight have changed considerably. Although the size of the coefficient is reduced to a certain extent, such changes cannot overturn the original conclusions. That is, it still proves that green credit can significantly improver the decline in asset yields and that green credit policies can help improve the “overcapacity” in commercial banks. (2) In the empirical analysis, this paper establishes a data envelope analysis model with undesirable output and dynamically analyzes the operational efficiency of commercial banks using the allocation efficiency of input and output.
Table 9. Regin China, innovatively proving the argument thression results for the robustness test (objective function reconstruction).
|
|
(1) |
(2) |
(3) |
(4) |
(5) |
(6) |
(7) |
|
B_Branch1 |
B_Branch1 |
B_Staff1 |
B_FixedAsset1 |
B_AdminCost1 |
B_wNPLR1 |
B_NP1 |
|
|
GreenLoanRate |
−0.0113 *** |
−0.0175 *** |
−0.0115 *** |
−0.0170 *** |
−0.00852 *** |
−0.0207 *** |
−0.0300 * |
|
GDP |
0.0193 *** |
|
|
|
|
|
|
|
MarketShare |
0.0342 *** |
|
|
|
|
|
|
|
PFEpGDP |
|
|
|
|
|
|
0.162 *** |
|
Constant |
0.172 *** |
0.508 *** |
0.355 *** |
0.568 *** |
0.317 *** |
0.549 *** |
−3.253 *** |
|
Observations |
368 |
368 |
368 |
368 |
368 |
368 |
368 |
|
R-squared |
0.226 |
0.098 |
0.047 |
0.063 |
0.043 |
0.095 |
0.125 |
|
Number of id |
43 |
43 |
43 |
43 |
43 |
43 |
43 |
Standardugh the utilization and efficient configuration errors in parenthesf internal resources. *** p < 0.01, ** p < 0.05, * p < 0.1.
- Financial Comparison between “Green” and “Two High and One Surplus”Enterprises
- Conclusions
- and Policy Recommendations
8.1. Conclusions
According to tThe development status, the Chinese government must further promoteain purpose of green credit policies to finance green economic development. However, in the context of a weak global economy, such economic transformation may fais not only to increase the proportion of credit for green projects, but also to reduce the risks and challenges of a further decline in the domestic economy. With such doubts, from the perspective loans to “Two High and One Surplus” enterprises. Changing the credit structure of commercial banks, this paper tries to clarify the market logic of green credit policies and explore whether green credit policies conform to the long-term market mechanism is reflected in the proportion of these two types of corporate loans.
Sect Fion 3 analyzes the financial status and credit financing costs of two types of loan customers (the enterprisesancial analysis is the most important link in the environmentloan approval protection industry and the “Two High and One Surplus” enterprises), corresponcess of commercial banks. According to a green credit policy that is based on thethe financial information of the loan customers. Ianalysis , it was found that green enterprises have a better financial status and less risk but higher credit financing costs than th, compared to the “Two High and One Surplus” enterprises. On the one hand, the pricing differences between the capital market and the credit market regarding theindustries, the environmental protection industry is better, but its financing costs of green enterprises result from the monopoly tare high.
- Do Green Credit Policies Boost Profits?
That commercial banks have in the credit market. On the other hand, commercial banks benefit from the implementations section analyzes the influence of green credit policies. Tratio on the financial comparison lays an important theoretical foundation for demonstrating how green credit policies affect the operation of indicators of Chinese commercial banks.
Section 4 closely combines previous research from the literature and the content of the first part of the paper throrough regression analysis and studies the influence of increasing the ratio of green credit to the operating results of commercial banks (namely, financial indicators)method. It is pointed out that the differences in conclusions from the literature are due to the selection of model variables. The root cause of these differences may be the rapid expansion of the capital of commercial banks in the sample period, resulting in a decline in the internal factor allocation efficiency. The empirical analysis proves that increasing the green credit ratio can increase the total profits of commercial banks and puts forward that green credit policies can solve the “overcapacity” problems that are experienced by commercial banks to a certain extent.
5.Green Credit and Bank Operating Efficiency
Section 5 analyzes the allocation efficiency of the internal resources of commercial banks from the perspective of input–output efficiency to prepare for the fourth part of the study. In terms of methods, an SBM-DEA model containing undesirable output (the non-performing loan ratio) was established, and the weights of the output variables were innovatively and dynamically coordinated. The results (Figure 4) show that the efficiency measurements for China’'s commercial banks largely conform to the economic reality, and the analysis of the slack variables effectively revealed the main reasons for the changes in the operating efficiency of commercial banks at various stages.
Section 6 uses the operating efficiency and slack 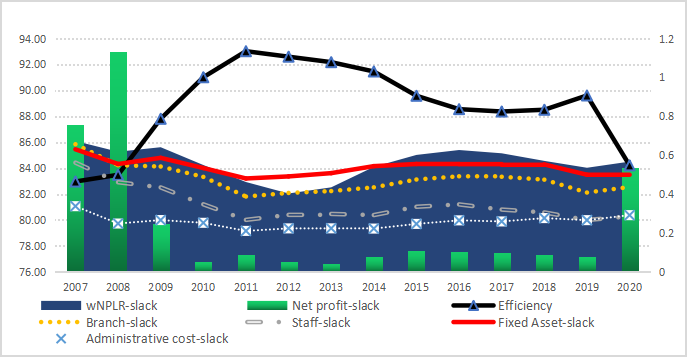
Figure 4. Avariables obtained in the third part of the paper to study the influence of increasing the proportion of green credit on the operation processes (operatinrage operating efficiency) of commercial banks. It was found that green credit policies mainly improve the overall operating efficiency of commercial banks from two aspects: (1) it improves the utilization efficiency of various internal resources, and (2) it improves the overall allocation efficiency of resources and slack variables.
At tThe end of this paper, the possible endogeneity and robustness of the model were discussed and tested. We considered possible endogeneity problems such as omitted variables and non-random samples, and instrumental variables and Heckman’s two-stage method were used to test and adjust the model. It was found that it is the model that has mild endogeneity that underestimates the promotion effect of the green credit policy on the operational efficiency of commercial banks to some extent. For a robustness test, the influence of the weight rule changes on the research conclusions was tested by objective function reconstruction, and no significant differences were found in the conclusions.
8.2. Policy Recommendations
Brough regression analysis, it is found thased on the research in this paper, we can provide the following three policy suggestions:
First, green commercial banks should continue to promote green creedit policies. This paper has proven that increasing the proportion of green credit can not only increase the net profit of commercial banks effectively and reduce the non-performing loan ratio, but it can also make full use of their internal resources and impro mainly improve the overall operating efficiency. Under the current situation of a transition in industry competition, excessive capital expansion, and a high idle rate of resources, Chinese com of commercial banks should further promote the implementation of green credit policies, improve overall asset profitability, and promote the optimal allocation of internal resources.
Second,from two aspects: from(1) the perspective of the green industry, regulatory authorities should be committed to reducing the pricing differences between different financing markets and to solving the problems of “expensive financing” of green projects in a market-oriented way. The different financing pricing for green industries in the stock market and in the credit market stems from the monopoly that commercial banks have in the credit market, and the unequal competition relationship is determined by comparing the huge volume of credit financing and equity financing. Therefore, we suggest expanding the equity financing channels of green industry so that the equity market information can be transmitted to the credit market more effectively. On the other hand, differences in financing pricing may also result from the sensitivity of different markets to information asymmetry. When financing green projects, commercial banks require a higher risk premium for uncertainty. Therefore, a credit guarantee mechanism can be designed to reduce the cost of uncertainty.
From the perspective of financeit improves the utilization efficiency of various internal resources, the government should gradually reduce green financial subsidies in coordination with supporting policies and measures. This paper has proven that the green credit policies of commercial banks are in line with their own market interests, laying a theoretical and factual basis for the withdrawal of fiscal subsidies. However, attention should be paid to the reaction of the market when withdrawing fiscal subsidies, and various policies and orderly withdrawal methods should be implemented. For example, due to the dominant position of commercial banks in green credit approval, they may transfer the cost increases caused by the abolition of fiscal discounts to enterprises applying for green credit by increasing interest rates. In this regard, regulators can provide two types of supporting measures: on the one hand, they can increase the benefits of green credit issued by commercial banks through policies, such as by supporting securing green credit; on the other hand, there should be more alternative financing channels for green projects to weaken the monopoly that commercial banks have on the financing market. At the same time, market monitoring mechanisms should be added, such as the establishment of a green credit financing index to monitor market reactions to fiscal cuts in real timend (2) it improves the overall allocation efficiency of resources.
References
- BP. Statistical Review of World Energy 2021, 70th ed.; BP: London, UK, 2021.
- Ma, J. The Evolution of and Prospect for Green Finance in China. Comp. Econ. Soc. Syst. 2016, 6, 25–32.
- Sequoiacap. Towards Zero Carbon—A Green Revolution Based on Scientific and Technological Innovation; Sequoiacap: London, UK, 2021.
- Zhou, L.A. The Incentive and Cooperation of Government Officials in the Political Tournaments an Interpretation of the Prolonged Local: Protectionism and Duplicative Investments in China. Econ. Res. J. 2004, 6, 33–40.
- Jiang, F.; Cao, J. Market Failure or Institutional Weakness—The Argument, Defect and New Development in Research of Redundant Construction Formation Mechanism. China Ind. Econ. 2009, 1, 53–64.
- Jiang, F.; Geng, Q.; Lv, D.; Li, X. Mechanism of Excess Capacity Based on China’s Regional Competition and Market Distortion. China Ind. Econ. 2012, 6, 44–56.
- Zhang, J. Research on the formation and resolution of Overcapacity in China from the perspective of industrial policy. Inq. Econ. Issues 2015, 2, 10–14.
- Dong, Q.; Wen, S.; Liu, X. Credit Allocation, Pollution, and Sustainable Growth: Theory and Evidence from China. Emerg. Mark. Financ. Trade 2019, 56, 2793–2811.
- Liu, X.; Wen, S. Should Financial Institutions be Environmentally Responsible in China? Facts, Theory and Evidence. Econ. Res. J. 2019, 54, 38–54.
- Ma, L.; Zhang, X. The Spatial Effect of China’s Haze Pollution and the Impact from Economic Change and Energy Structure. China Ind. Econ. 2014, 4, 19–31.
- Wang, M.; Huang, Y. China’s Environmental Pollution and Economic Growth. China Econ. Q. 2015, 14, 557–578.
- Zhou, H.; Jian, L.; Li, G.P. Corporate Social Responsibility and Credit Spreads on Corporate Bonds—An Empirical Study Based on China’s Public Companies. Account. Res. 2016, 5, 18–25+95.
- Dhaliwal, D.S.; Li, O.Z.; Tsang, A.; Yang, Y.G. Voluntary nonfinancial disclosure and the cost of equity capital: The initiation of corporate social responsibility reporting. Account. Rev. 2011, 86, 59–100.
- El Ghoul, S.; Guedhami, O.; Kwok, C.C.Y.; Mishra, D.R. Does corporate social responsibility affect the cost of capital? J. Bank. Financ. 2011, 35, 2388–2406.
- Li, G.; Wei, X. Definition, Measurements and Economic Consequences of Corporate Social Responsibility: A Survey on Theories of Corporate Social Responsibility. Account. Res. 2014, 8, 33–40+96.
- Li, G.; Zhang, Q.; Zhou, H. Corporate Social Responsibility and Financial Performance: Theory, Methods and Tests. Econ. Perspect. 2014, 6, 138–148.
- Goss, A.; Roberts, G.S. The impact of corporate social responsibility on the cost of bank loans. J. Bank. Financ. 2011, 35, 1794–1810.
- He, D.; Zhang, X. Reflections on some problems of carrying out green credit in China’s commercial banks. Shanghai Financ. 2007, 12, 4–9.
- Duffie, D.; Lando, D. Term structures of credit spreads with incomplete accounting information. Econometrica 2001, 69, 633–664.
- Zhou, H.; Li, G.; Lin, W. Corporate Social Responsibility and the Cost of Debt Financing: Based on the Evidence of Shanghai Stock Exchange Listed Companies Issued Bonds. In Proceedings of the 2014 Annual Conference of Environmental Accounting Committee of Accounting Society of China, Nanjing, China, 25–26 October 2014; p. 15.
- Lin, W. Analysts Forecast and Corporate Bonds Credit Spreads—Based on the Data of Chinese Corporate Bonds in 2008–2012. Account. Res. 2013, 8, 69–75.
- Gelb, D.S.; Strawser, J.A. Corporate social responsibility and financial disclosures: An alternative explanation for increased disclosure. J. Bus. Ethics 2001, 33, 1–13.
- Richardson, A.J.; Welker, M. Social disclosure, financial disclosure and the cost of equity capital. Account. Organ. Soc. 2001, 26, 597–616.
- Niu, H.; Zhang, X.; Zhang, P. Institutional Change and Effect Evaluation of Green Finance Policy in China: Evidence from Green Credit Policy. Manag. Rev. 2020, 32, 3–12.