3. Gene Mutations
Before the availability of next-generation sequencing (NGS) technologies, the mutational status of
RAS oncogenes (
NRAS and
KRAS), the two most prevalent mutated genes in MM, and of the tumor suppressor
TP53, had been explored in pPCL using traditional DNA sequencing methodologies. Two studies demonstrated a high incidence of
NRAS and
KRAS activating mutations: one of them reported these mutations at codons 12, 13, or 61 in 27% of pPCL and 15% of sPCL cases
[5][8], and in the other study
NRAS and/or
KRAS mutations were found in 50% of pPCL cases and in 55% of MM
[36][20]. Strikingly, these findings were not confirmed in a subsequent study
[16][27].
TP53 is one of the most frequently mutated genes in pPCL in all the published series, reaching frequencies of 25%
[5][16][29][8,23,27]. The proportion of cases with biallelic inactivation of
TP53 is also greater in pPCL than in MM (17–35% vs. 3–4%)
[5][16][8,27].
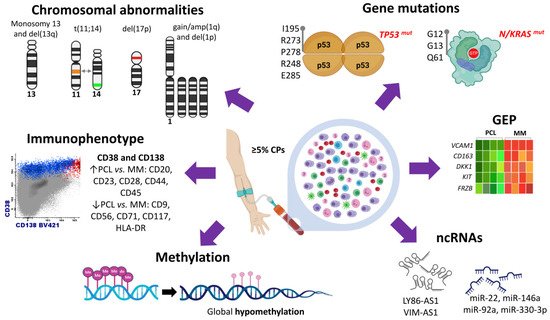
TP53 coding mutations involving 5–8 exons were found, predicting all of them a non-functional p53 protein
[5][16][8,27] (
Figure 1).
The first whole-exome sequencing (WES) analysis of pPCL revealed a highly heterogeneous mutational profile
[37][29]. Almost 2000 coding somatic non-silent variants on 1643 genes were described, with more than 160 variants per sample, although with hardly any recurrent mutations in two or more samples. Fourteen mutated genes mainly involved in cell cycle and apoptosis (
CIDEC), RNA binding and degradation (
DIS3,
RPL17), and cell-matrix adhesion and membrane organization (
SPTB,
CELA1) were considered as potential cancer driver genes in pPCL. Other studies have confirmed that the number of nonsynonymous mutations per sample is higher in pPCL than in MM
[19][36].
As in MM, activating
N/
KRAS mutations have been identified in pPCL using WES methodologies, although the proportions were significantly unequal between the two of the studies. The first study reported mutations of
KRAS and
NRAS only in two distinct samples (<10% of the pPCL). This study highlighted that
KRAS and
NRAS were three-fold less frequently mutated in pPCL compared to that observed in MM
[37][29]. On the contrary, the second study also using WES methodology found that
KRAS was the most frequently mutated gene in pPCL samples (around 39%), and mutations of
NRAS were present in 13% of pPCL
[19][36]. Using targeted NGS approaches,
KRAS mutations were detected in 17% of pPCL, 18% of sPCL, and 33% of MM, and
NRAS mutations in 4% of pPCL, 36% of sPCL, and 27% of MM
[38][30]. Apparently, the
MEK/
ERK signaling pathway was less affected by mutation events in pPCL than in sPCL and MM
[38][30].
IRF4 mutations have recently been shown to be significantly more frequent in pPCL than in MM patients (11% vs. 4%)
[22][41]. Other gene mutations commonly observed in MM have also been reported in pPCL but with different frequencies. Schinke et al. detected
DIS3 and
PRMD1 mutations in 5% and 13% of patients with pPCL, respectively, while Cifola et al. identified
DIS3 mutations in 25% of cases and no variants in the
PRMD1 gene. Both studies have described a similar incidence of
FAM46C mutation (10–12%) in pPCL patients
[19][37][29,36].
4. Transcriptome Characterization
More recently, the GEP of 41 pPCL patients has been compared to that of more than 700 newly diagnosed MM
[19][36]. In pPCL, the analysis showed overexpression of genes previously related to MM biology or prognosis, such as
PHF19 and
TAGLN2, and underexpression of the adhesion molecules
VCAM1 and
CD163, which are highly expressed in MM and have been correlated with poor survival
[39][40][51,52].
RNA-seq analysis of pPCL has also shown a specific transcriptional landscape of pPCL, as previously demonstrated by GEP using microarrays. Compared to MM, pPCL showed significantly higher expression of genes involved in G2M checkpoint and
MYC target genes and lower expression of genes involved in p53 pathway, hypoxia, and
TNF alpha signaling via
NF-κB [22][41]. In this regard, significant overexpression of
CDKN2A, CCND3, and
CCND1 genes, using quantitative RT-PCR, has been reported in PCL compared to MM samples, indicating a marked cell cycle dysregulation in the transition from MM to PCL
[41][53].
A comprehensive molecular analysis of pPCL integrating data from FISH, SNP-arrays, and GEP has revealed a strong correlation between chromosomal imbalances and transcriptional modulation. The gene dosage effect was particularly observed in those genes mapping 1q chromosome
[16][27]. In addition, the analysis of upregulated and downregulated transcripts in the gained and lost chromosomal regions, respectively, found that protein transport, translation, and biosynthesis functional categories were upregulated in pPCL cases with gained chromosomal regions, whereas RNA splicing, protein catabolic process, and regulation of apoptosis were downregulated in pPCL cases with deleted regions.
Differences between the gene expression signature of pPCL and MM could be partly attributed to the dissimilar distribution of genetic abnormalities between the two diseases. This fact prompted us to compare the transcriptome of pPCL and MM patients using samples with del(17p) and a similar cytogenetic background
[42][34]. This approach revealed that pPCL and MM were separated into two differentiated clusters despite the equivalent cytogenetic profile shared by both entities. Differentially expressed genes were mostly downregulated in pPCL, among which were genes associated with bone marrow microenvironment and bone diseases in MM, such as
DKK1,
KIT,
NCAM1, and
FRZB (
Figure 1). Interestingly, the analysis focused on isoform expression showed that dysregulation of RNA splicing machinery may be a relevant molecular mechanism underlying the biological differences between the pPCL and MM.
A similar approach has been used to ascertain the differences in the transcriptome between pPCL and MM samples harboring t(11;14)
[32][38].
BIn line with our results, this study shows that both plasma cell dyscrasias are clearly distinguishable based on the transcriptome profile despite sharing a uniform genetic background. pPCL with t(11;14) were positively associated with genes involved in
IL2-STAT5 signaling but negatively associated with the regulation of cell and cell adhesion pathways. In any case, the most relevant finding of this study was that pPCL showed a different expression pattern of the
BCL2 family genes and of the B-cell-associated genes, despite the presence of t(11;14) in both PCL and MM samples. These results suggest that the efficacy of venetoclax in pPCL and MM patients with t(11;14) may be associated with different molecular programs.
5. Non-Coding RNA Profile
Non-coding RNAs (ncRNAs) are classified as short (<200 nucleotides) and long (>200 nucleotides). The miRNAs are short ncRNAs of 19–22 nucleotides that regulate gene expression at the post-transcriptional level. Since their discovery, numerous studies have attributed a wide variety of functions for ncRNAs in the pathogenic mechanisms of MM
[43][44][45][54,55,56].
One study analyzing the expression pattern of miRNAs in pPCL
[46][26]. The analysis of 18 pPCL identified 42 upregulated and 41 downregulated miRNAs in pPCL when compared with MM samples. Moreover, seven miRNAs were found to be differentially expressed depending on the type of
IGH translocation. Three miRNAs (let-7e, miR-135a, and miR-148a) were overexpressed in PCL patients with t(4;14); three (miR-7, miR-7-1, and miR-454) underexpressed in PCL with t(14;16); and the miR-342-3p was underexpressed in PCL with t(11;14). Notably, four miRNAs, miR-22, miR-146a, miR-92a, and miR-330-3p, were found to have an impact on the survival of pPCL patients. The overexpression of miR-146a, which was associated with shorter progression-free survival (PFS) in pPCL cases, and miR-22, which was associated with longer PFS, showed a pro- and anti-survival effect, respectively, in myeloma cell lines
[46][26]. Accordingly, one study has demonstrated that MM cells stimulate the overexpression of miR-146a in mesenchymal stromal cells, resulting in more cytokine secretion and enhancing cell viability of MM cells
[47][57] (
Figure 1).
LncRNAs expression profile has also been investigated in a large cohort of PC dyscrasias, including samples from MGUS, SMM, MM, and PCL together with NPC
[48][31]. Differential expression of 160 lncRNAs between NPC and the four premalignant and malignant entities was detected. In particular, expression levels of 15 lncRNAs were progressively increased from NPC to PCL patients, while six lncRNAs showed a significant decrease in the transition from NPC and premalignant entities to more aggressive forms.
6. Methylation Patterns
The analysis of global methylation patterns in pPCL using high-density arrays has identified a global hypomethylation profile in pPCL samples
[49][33] (
Figure 1). The comparison of methylation levels between pPCL, MM, MGUS, and NPC samples revealed that genes highly methylated in NPC underwent a progressive decrease in the levels of methylation as the aggressiveness of the disease increased from MGUS to MM and pPCL. Curiously, pPCL patients showed distinct methylation profiles depending on the presence of
DIS3 gene mutations, t(11;14), and t(14;16). On the contrary, Walker et al.
[50][59] had previously found gene-specific hypermethylation of almost 2000 genes in the transition from MM to PCL, although the number of PCL cases was quite small.