Green finance is a sustainable force in promoting green development. China’s social financing structure determines the key role that green credit plays in sustainable development. Under the dual pressure of future economic downturn and huge capital gaps, it is worth exploring whether to continue promoting green credit that conforms to the long-term market mechanism. From the perspective of Chinese commercial banks, this paper analyzes whether promoting green credit is compatible with the incentives and their profit maximization goals.
- green credit
- “Two High and One Surplus”
- financial results
Abstract: Green finance is a sustainable force in promoting green development. China’s social financing structure determines the key role that green credit plays in sustainable development. Under the dual pressure of future economic downturn and huge capital gaps, it is worth exploring whether to continue promoting green credit that conforms to the long-term market mechanism. From the perspective of Chinese commercial banks, this paper analyzes whether promoting green credit is compatible with the incentives and their profit maximization goals. To this end, the research in this paper is based on the following three aspects: (1) Based on financial analysis, this paper reveals the different pricing of green industries in the capital market and credit market and explains the mechanism through which green credit policies improve the operating conditions of commercial banks; (2) combined with the conclusions from the literature and financial analysis, the influence of different index types on the modeling results is analyzed, and it is determined that the main reasons causing a decline in the return on assets are the excessive expansion of capital and the decline in internal resource-use efficiency; (3) a data envelopment model (more accurately, SBM-DDF) with undesirable outputs is established to dynamically analyze the operating efficiency of Chinese commercial banks, and the role of green credit in improving efficiency is studied. The main conclusions of this paper are as follows: if Chinese commercial banks increase their proportion of green credit, they can not only increase their profit scale but also improve and optimize the allocation of their internal resources, thus improving their operating efficiency. The main sample of this study comprises 43 commercial banks in China from 2007 to 2020.
1. Introduction
2. ReFinancialated Content of Green Finance in Line with the Long-Term Market Mechani Comparison between “Green” and “Two High and One Surplus” Enterprisesm
2.1. Financial Indicator Analysis
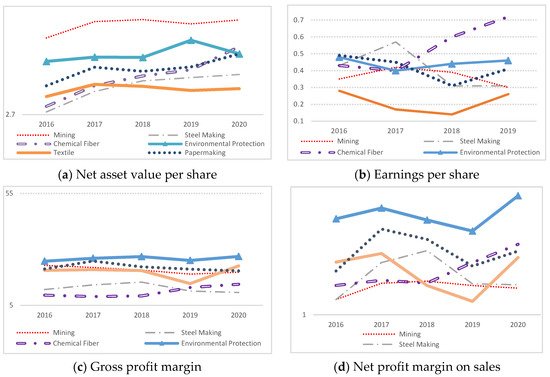
From the perisk classification of different types of projspective of industry prospects, and list topics related to the environmental assessment processes, monitoring, and follow-up guidance. At present, 56 financial institutions around the world, including Citigroup, Standard Charteredprotection industry is bound to be the industry with the largest policy support in the future, and HSBC, have become Equator Principle Financial Institutions (“EPFIs”), accounting for more than 90% of the global project financing market. By the end of 2021, nine Chinese mainland commercial banks had incorporated the Equator Principles, which are also the practical blueprint for green credit in China’s bankingits product market is also developing rapidly. Both the gross profit margin and the net profit margin of sales have steadily ranked at the top of the six studied industries. Since 2017 especially, there has been a trend of widening the gap between other industry (From the Preambleies. By 2020, compared to the net profit margin of the Equator Principles,“Two High www.equator-principles.com (accessend on 16 March 2022)).2.2. Comparison of Financing Costs
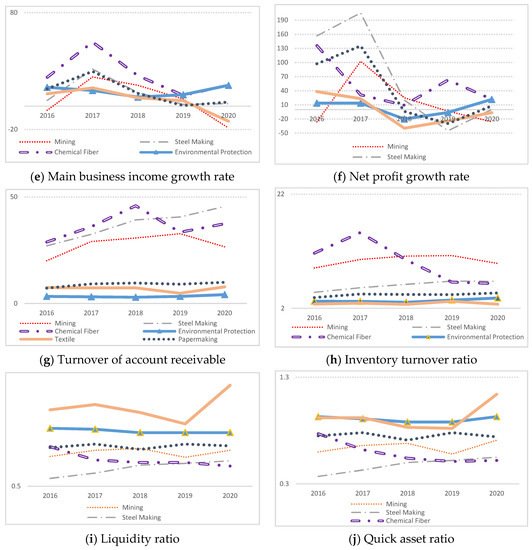
Thises [13][22]. Grepapen credit has a significant effect on reducing the friction also analyzes the credit financing costs and risk coefficients in variousof the above six industries [23]. On tThe other hand, the national conditions result in green credit having policy effects that cause enterprises to show certain Chinese characteristics. For example, the credit-approval features of Chinese commercial banks that emphasize mortgages [24] cratio of interest expense to interest-bearing debt in financial statements (interest-bearing debt is calculated by multiplying the published total debt by the ratio of the interest-beause green credit policies to have less of an impact on highly pollutinging debt) indicates the level of credit financing costs (for Chinese enterprises with high fixed assets [25]. Sun , the majority of thet al. [26] fouind that green credit policies can motivate Chinese enterprises to focus on fronerest expense comes from credit behavior). As seen from Figure 2, t-hend prevention and control rather than on terminal emission reduction.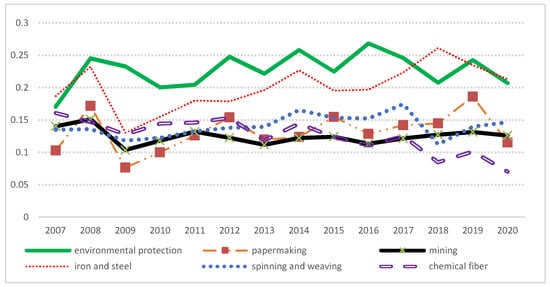
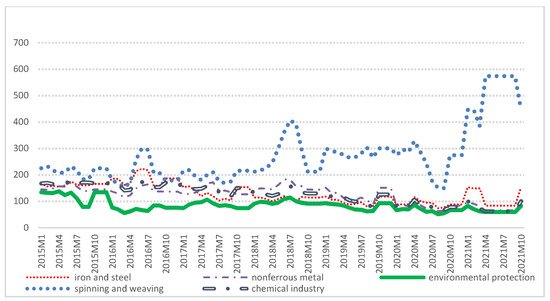
However, this mismatch between risk and return is undoubtedly beneficial to commercial banks.
Based on the above analysis, we propose Hypothesis 1:
Hypothesis 31 (H1). Fin Increasing the proportion of green credit will increase the operating profits of commercial banks.
- Do Green Credit Policies Boost Profits?
In the last section, the financial data for green industries and the “Two High and One Surplus” industries were compared, and the reasons for the differences between these two types of industries were analyzed to build a theoretical basis for how green credit policies affect the asset management of commercial banks. However, according to the literature, relevant empirical analyses have failed to find a relatively consistent answer to the question of whether increasing green credit can have positive effects on commercial banks. This paper will continue to try to explain the differences in the conclusions from the literature through empirical analysis and will put forward inferences based on facts.
4.1. Description of the Data, Variables, and Models
The study period was from 2007 to 2020 and included 2016, the first year of green finance in China; the global financial crisis in 2008; and the COVID-19 outbreak in 2019. Sample banks included 43 types of large state-owned commercial banks, national joint-stock commercial banks, urban commercial banks, and rural commercial banks (including non-listed banks). During the sample period, the selected banks were very representative in terms of the proportion of deposit balance (69.2–80.5%) and loan balance (71.4–74.7%) for the whole industry. From the perspective of green credit data, as of 2016 the green credit balance of the sample banks accounted for 77% of the whole industry (the CBRC has only released green credit statistics from 2013 to 2016). The relevant financial data, green credit, and operational data from commercial banks were collected manually from their official websites and from their annual reports and social responsibility reports.
4.2. Different Models Have Different Results
The empirical analyses that have been carried out in the literature use the relative index—return on total assets (ROA) or return on equity (ROE)—as the explained variable. The value of the relative index is easily affected by the financing behavior of commercial banks. For example, capital expansion increases the denominator of the relative index. In order to further confirm that, this paper will compare the modeling results of the absolute index and the relative index, respectively. The explained variable of the absolute index model is the natural logarithm of net profit, and the core explanatory variable is the natural logarithm of green credit. The relative index model corresponds to return on total assets (or return on equity) and the ratio of green credit corresponds to the total loan scale. The control variables include macro indicators, such as GDP, interest rates, and exchange rates, and industrial indicators, such as the average net interest margin, market concentration, asset size, age (from the beginning of its establishment), and income cost ratio (operating efficiency). The descriptive statistics of these variables are in Table 1. Using the F Test, it can be found that the F statistics in Table 2 (line “F-test”) significantly reject the null hypothesis that there is no fixed effect; so, the fixed-effect model is superior to the mixed-effect model. Using the Hausman test (“Hausman (p value)”), it is found that the fixed-effect models are mostly superior to the random-effect models. Therefore, the fixed-effect model of individual characteristics is established as follows:
|
(1) |
|
|
(2) |
The is the explained variable of the relative index model, namely the ROA or ROE; corresponds to the explained variable of the absolute index model, namely the natural logarithm of net profit. and are the natural logarithm of green credit and the proportion of green credit in the total loan, respectively. . and are random disturbance terms. and are individual fixed effects.
Tanciabl Compe 1. Descriptive statistics.
|
Variable |
Variable Declaration |
Obs |
Mean |
SD |
Min |
Max |
|
ROA |
Return on total assets, % |
552 |
0.98 |
08.2 |
0.12 |
1.76 |
|
ROE |
Return on equity, % |
557 |
19.19 |
8.49 |
1.51 |
49.25 |
|
LnNP |
Logarithm of net profit, CNY 100 million |
573 |
4.19 |
1.77 |
−0.46 |
8.06 |
|
GreenLoanRate |
Green credit ratio, % |
368 |
3.74 |
4.08 |
06.0 |
29.37 |
|
GreenRateLnAsset |
Green credit ratio × Log of total assets |
368 |
38.55 |
45.17 |
0.50 |
328.64 |
|
LnGreenLoan |
Log of green credit, CNY 100 million |
368 |
5.15 |
2.24 |
0.47 |
9.82 |
|
GDP |
The local GDP growth rate, % |
602 |
8.86 |
3.25 |
−5.00 |
17.40 |
|
LnReGDP |
Log of the actual local GDP; CNY 100 million |
602 |
11.26 |
1.60 |
7.97 |
13.45 |
|
MarketShare |
The bank’s local market share (by deposits), % |
590 |
4.70 |
4.29 |
06.0 |
17.72 |
|
Age |
Age (from the date of establishment), year |
602 |
18.52 |
10.63 |
0 |
69 |
|
IfListed |
Listed or not, Yes: 1 and No: 0 |
602 |
09.4 |
00.5 |
0 |
1 |
|
INIM |
Average net interest margin of banking industry |
471 |
10.28 |
2.58 |
4.30 |
39.10 |
|
E |
Exchange rate, CNY/USD |
602 |
6.66 |
08.3 |
6.14 |
7.61 |
|
Evar |
Volatility of exchange rate (standard deviation) |
602 |
0.11 |
07.0 |
0.004 |
07.2 |
A simple comparison of the empirical results (Table 2) shows that the conclusions drawn by the relative indicator model (Model 1–2) and the absolute indicator model (Model 7–9) are quite different. Under the relative indicator model, the increase in the proportion of green credit inhibits the financial performance of commercial banks, while the conclusion drawn by the absolute indicator model is just the opposite. This contrast may be led by the rapid expansion of the total assets (denominator) in the relative index. Before 2007, only 7 of the 43 banks in the sample had been listed. The vast majority of Chinese commercial banks were listed in succession during the sample period. The business scale of Chinese commercial banks is largely constrained by the asset management of the regulatory authorities. When the financing channel of the stock market is opened, commercial banks resolve the asset management constraints one after another by expanding the share capital to further promote the expansion of the asset scale. During the sample period, the average annual growth rate of the net assets of the sample banks was as high as 27.46%, while the corresponding growth rate of the net profits was only 18%. On the one hand, rapid capital expansion has diluted the return on average assets, causing the total profit and the proportion of green credit in China’s banking industry in this special period to increase while causing the return on average assets and net assets to decline. On the other hand, the excessive expansion of assets and the scale of business may lead to a decline in the operating efficiency of commercial banks (this argument will be proved below).
Considering the interactive influence of their own asset scale (Model 3), the financial effect of the proportion of green credit is differentiated: banks with a lower asset scale than average (CNY 810.1 billion) are more likely to realize the positive effects of green credit. On the one hand, under certain conditions, green credit policies are conducive to alleviating the decline in operating efficiency caused by the excessive capital expansion of Chinese commercial banks. On the other hand, it has been proven that sample selection plays an important role in the model results. Different studies in the literature have selected different sample individuals and sample periods, and the average asset size of those selected samples has also been different, causing different conclusions to be drawn.
Tarison between “Green”le 2. Regression results for the different types of index models.
|
|
(1) ROA |
(2) ROA |
(3) ROA |
(4) ROE |
(5) ROE |
(6) LnNP |
(7) LnNP |
(8) LnNP |
|
GreenLoanRate |
−0.0184 *** |
−0.0073 *** |
0.0899 *** |
−0.3313 *** |
−0.1458 * |
|
|
|
|
GreenRateLnAsset |
|
|
−0.0099 *** |
|
|
|
|
|
|
LnGreenLoan |
|
|
|
|
|
0.316 *** |
0.107 *** |
0.0520 *** |
|
GDP |
|
0.0257 *** |
|
|
0.646 *** |
|
0.0274 ** |
|
|
MarketShare |
|
|
−0.0231 ** |
|
|
|
|
0.108*** |
|
Age |
|
|
|
|
|
|
0.119 *** |
|
|
IfListed |
|
|
|
|
|
|
|
|
|
INIM |
|
|
|
|
|
|
−0.0448 *** |
|
|
E var |
|
|
|
|
|
|
−0.790 *** |
|
|
LnReGDP |
|
|
|
|
|
|
|
1.570 *** |
|
E |
|
−0.2784 *** |
|
|
|
|
|
−0.344 *** |
|
Constant |
1.0168 *** |
2.63 *** |
1.110 *** |
0.2942 *** |
14.43 *** |
3.327 *** |
2.247 *** |
−12.11 *** |
|
Observations |
368 |
368 |
368 |
368 |
368 |
368 |
337 |
368 |
|
R-squared |
0.0767 |
0.489 |
0.117 |
0.0716 |
0.337 |
0.545 |
0.683 |
0.816 |
|
Number of id |
43 |
43 |
43 |
43 |
43 |
43 |
41 |
43 |
|
F-Test |
11.09 |
15.32 |
10.75 |
55.58 |
72.42 |
47.43 |
52.57 |
55.84 |
|
Hausman (p value) |
0.0017 |
0.0112 |
0.0000 |
0.5514 |
0.3379 |
0.0000 |
0.0000 |
0.0000 |
Robust t-statistics in parentheses. *** p < 0.01, ** p < 0.05, * p < 0.1.
4.3. Cost Margin of Green Credit
According to the above analysis, the excessive capital expansion of Chinese commercial banks may lead to a decline in operating efficiency. Increasing green credit not only improves the operating profits, but also alleviates the problems caused by excessive capital expansion to a certain extent. In order to further verify and explore the relationship between green credit policies and the operation efficiency of commercial banks, this paper studies whether and how increasing green credit affects the operation of commercial banks by establishing elastic green credit models and input and output from the perspective of internal resource utilization efficiency:
|
(3) |
, the input variable, represents the management costs; the number of employees and the number of business outlets are selected as the corresponding input variables, which are the explained variables taken from the natural logarithm. is the logarithm of the amount of green credit, represents a series of the control variables, and is the random interference term. In order to compare the costs and benefits of green credit, the natural logarithm of the net profit is added to the explained variable. In this paper, the individual fixed effect was used for regression analysis.
The results of Model 9–11(in Table 3) support the view that “an increase in the proportion of green credit will increase business costs”. Many scholars, such as He Dexu and Zhang Xuelan [46], believe that green credit increases the management costs incurred by project identification in the credit process of commercial banks, such as via project evaluation by external experts and targeted staff training, etc. Model 9 verifies this view. Model 10 and Model 11 show that increasing the amount of green credit not only significantly increases the management cost, but also promotes increasing the number of staff and outlets. Specifically, when the green credit ratio increases by 1%, costs rise by an average of 0.05%. Compared to the increase in cost, green credit also significantly improves net profit, and the coefficient is slightly higher than the increase in cost, which indicates that the increase in green credit business may bring income to commercial banks that is twice the increase in cost. This further shows that green credit businesses are more efficient in using cost inputs than traditional credit businesses.
Tandble “Two3. Regression of green credit on costs and profit.
|
|
(8) LnNP |
(9) LnAdminCost |
(10) LnStaff |
(11) LnBranch |
|
LnGreenLoan |
0.0520 *** |
0.0641 *** |
0.0506 *** |
0.0491 *** |
|
MarketShare |
0.108 *** |
0.0998 *** |
0.114 *** |
0.115 *** |
|
LnReGDP |
1.570 *** |
1.241 *** |
0.810 *** |
0.868 *** |
|
E |
−0.344 *** |
−0.130 *** |
−0.124 *** |
−0.106 *** |
|
Constant |
−12.11 *** |
−9.738 *** |
0.368 |
3.835 *** |
|
Observations |
368 |
368 |
368 |
368 |
|
R-squared |
0.816 |
0.880 |
0.758 |
0.689 |
|
Number of id |
43 |
43 |
43 |
43 |
|
F-Test |
55.84 |
122.06 |
93.37 |
93.26 |
|
Hausman (p value) |
0.0000 |
0.0000 |
0.0000 |
0.0000 |
Robust t-statistics in parentheses. *** p < 0.01, ** p < 0.05, * p < 0.1.
So far, we have proved Hypothesis 1; that is, green credit policies improve the operating profits of commercial banks. In addition, it was determined that compared to general loans, green credit also significantly increases the cost input of commercial banks. In order to further analyze the mechanism influencing green credit policies and to combine with the conclusions that have already been obtained, this paper puts forward Hypothesis 2:
Higypoth and One Surplus”Enterpresises 2 (H2).
Increasing the proportion of green credit will improve the operating efficiency of commercial banks by improving the utilization rate and allocation efficiency of internal resources.
- The Operation Efficiency of Commercial Banks
According to the conclusions of Section 4, excessive capital expansion speed may lead to a decrease in the internal resource allocation efficiency of Chinese commercial banks and improving the green credit ratio not only pushes up the business costs of banks, it also creates several times more profit. The main purpose of green credit policies is not only to increase the proportion of credit for se findings provide market evidence for green credit policies improving the operational efficiency of commercial banks, but these findings only support this inference from the results, and there is a lack of systematic and dynamic discussion on the principles and processes. Is the rate at which the assets of commercial banks are expanding really reasonable? Is there an optimal asset size or allocation structure for internal resources? Additionally, can increasing green credit have an impact on the resource allocation efficiency of commercial banks? The answers to these questions are the key to further exploring how green credit policies affect the operational efficiency of commercial banks. This requires us to analyze the relationship between green credit policies and the operational efficiency of commercial banks, not only from the perspective of the operating results, but also from the perspective of the operating processes. In view of this, this paper will take the input–output efficiency as the starting point to explore the impact of changes in the proportion of green credit on business efficiency and will carry out research from a more comprehensive perspective.
Here, input–output efficiency refers to the concept of technical efficiency in economics; that is, under certain technical conditions, when it is impossible to increase any output without reducing othereen projects, but also to reduce the loans to “ output, or it is impossible to reduce any input without increasing other input, then the input–output is technically efficient [53]. Therefore, technical efficiency refers to the utilization level of the existing technology. Common influencing factors include the quality of the workers and the management level. Farrell [54] used production frontier analysis to measure technical efficiency for the first time, which was widely recognized by the theoretical circle of researchers and became the basis of the efficiency measurements. The so-called production frontier refers to the maximum output set corresponding to various proportional inputs at a certain technical level. The core of production, frontier analysis, is the effective frontier, that is, analysis in the form of the production function. In terms of methods, it includes parametric analysis with a specific function form and a non-parametric method without a specific function form. The former is represented by stochastic frontier analysis (SFA) and parametric metafrontier analysis. The latter is represented by data envelope analysis (DEA).
DEA is a non-parametric analysis method that was first proposed by A. Charnes, W.W. Cooper, and E. Rhodes [55] in 1978 and was developed on the basis of evaluating relative efficiency. As a non-parametric analysis, DEA can calculate the efficiency value without setting the specific function form of production, which has a wide range of applications. In the process of analyzing the input–output efficiency of commercial banks, it is difficult to find an effective functional form between input (such as staff and outlets) and output (such as net profit). Therefore, this paper adopts the DEA method to analyze the operating efficiency of commercial banks (if it is a functional form, then net profit is the explained variable, and the number of employees and outlets is the explanatory variable. It should be considered wo High and One hether there is an optimal proportion between employees and outlets, which often varies greatly for different types of commercial banks in different regions, and this optimal proportion often varies over time. Therefore, insufficient degrees of freedom should be considered during parameter estimation).
Sherman and Gold [56] were the first to apply DEA to banking efficiency, and later scholars followed their methods [57–59]. A key to measurplus”ing the operational efficiency of commercial banks with DEA is to identify the input and output. There are three main classification methods: production methods, asset methods, and intermediary methods. Production methods view banks as general productive enterprises. Changing the credit structure of coThe input production factors mainly include employees, machinery and equipment, capital, etc., and the output factors include deposits and loans. According to the intermediary method, the bank is the medium of borrowing and lending; that is, it produces the absorbed deposits as loans, and other inputs also include human resources, financial resources, material resources, and other elements. For the property method, the index classification is closely related to the balance sheet. The input index is the liability item, and the output is the asset item. The amount of a loan is often taken as the most important output indicator, while deposits can be classified differently. Other indicators, such as manpower, equipment assets, and capital input, generally appear in the form of input factors.
The DEA model is essentially a target optimercial banks is reflected in the proportionization problem under a given constraint. As a modern enterprise, the ultimate goal is undoubtedly to pursue profit maximization rather than to maximize the loan amount. In fact, commercial banks expand the size of deposits and loans to maximize their total profit by increasing the scale. The classification methods for deposits are the input, and loans are the output, showing how commercial banks continue to consider debt management similarly to how it was considered in the 1960s and 1970s. This paper does not take loans as output and instead replaces them with net profit. Considering the importance of these two types of corporate loans. asset security of commercial banks to the financial system and even to the national economy, we added the non-performing loan rate as an undesirable output to the optimization target. In fact, trade-offs between safety and profitability often occur; so, commercial bank managers and regulators need to make two-goal trade-offs. In practice, commercial banks have different priorities for different goals in different periods. For example, in a period when the non-performing loan ratio is lower than 1%, it is more important to improve the net profit level than to further reduce the non-performing loan ratio, while the opposite is true when the non-performing loan ratio is higher than 5%. In view of this, we considered a multi-objective weight problem for dynamic intertarget trade-offs at different risk levels.
5.1. Theory and Methods
In this paper, the directional distance function (DDF) was used to measure the input–output efficiency. x represents the inputs, and the outputs are divided into desirable outputs y and non-desirable outputs b. The production possibility set is:
|
(4) |
and the corresponding non-radial DDF is
|
(5) |
,) is the direction of improvement, and is the adjustment alysis is the most important mount for the input–output that is not limited by a fixed proportion. Based on the studies related to SBM-DDF [60–62], we also dynamically set the weights w of the inputs and outputs in the objective function.It was transformed into a linear programming problem using panel data with an individual number J and time dimension Γ (assuming the same scale remuneration production mode, variable scale remuneration only needs to add convexity conditions):
|
(6) |
|
|
(7) |
In the above expression, the letter with lower ink in thedices is a scalar value, and the letter without lower indices is a vector. In accordance with the above, x, y, and b represent input, desirable oan approval procesutput, and undesirable output, respectively. ,) and ,) are the adjustment directions and adjustment quantities of these three variables, respectively; , and are the relaxation variables representing the three variables, respectively; is the λ value (intensity of variable) of the Jth DMU at time τ.
The setting of the efficient reference frame, namely the effective frommercial bantier, is crucial. The effective frontier is usually divided into the biennial, sequential, and global frontiers in the scope of time. The main difference lies in the period range of data used to determine the effective frontier. It corresponds to the data from the previous two years and to the sequential and sample data for the whole period. In order to facilitate the efficiency comparison in different periods, this paper adopts the global SBM-DDF.
5.2. Variable Selection and Data Description
Ink this paper, a production method is adopted, and the number of employees, the number of business organizations, the fixed assets, and the other input variables are adopted as output indicators. According to the financial analysis , it was found that, coabove analysis, net profit is used to replace the amount of deposits and loans as the desirable output (the larger the better), and the non-performing loan ratio is taken as the undesirable output. Considering multi-objective dynamic coordination, this paper dynamically adjusts the weight of the non-performing loan ratio and the net profit output. The weight of the net profit is set as 1, and the weight of the non-performing loan ratio is dynamically adjusted according to the actual situation. The specific method is as follows: first, work out the average value of the non-performing loan ratio for all of the sample banks each year. The dynamic weight adjustment rule of the non-performing loan ratio is as follows: if the non-performing loan ratio is less than the average value, the weight is 0.2; if the ratio is greater than average, but less than 5%, then the weight is 0.6; if the ratio is greater than 5%, the weight is set to 1 (during the sample period, the average was 1.36%m, with a minimum of 0.76 and a maximum of 2.27%, never exceeding 5%). The descriptive statistics of these variables are in Table 4.
Table 4. Descriptive statistics for operational efficiency analysis.
|
Type of Variable |
Variable |
Variable Declaration |
Mean |
Max |
Min |
SD |
|
Input |
Staff |
Total number of working employees |
59,047.05 |
503,082 |
775 |
118,241.16 |
|
Branch |
Total number of business outlets |
2438.59 |
24,452 |
21 |
5316.64 |
|
|
FixedAsset |
Fixed asset value, CNY 100 million |
215.90 |
2535.25 |
1.31 |
475.72 |
|
|
AdminCost |
The administrative expenses incurred (excluding asset impairment provisions), CNY 100 million |
256.15 |
1990.50 |
1.57 |
448.81 |
|
|
Desirable output |
NP |
Total net profit, CNY 100 million |
287.42 |
3176.85 |
0.63 |
573.85 |
|
Undesirable output |
wNPLR |
Dynamically adjusted non-performing loan ratio, % |
0.63 |
9.81 |
0.00 |
0.75 |
|
Efficiency measure |
Dv |
Non-radial distance from the effective boundary |
2.33 |
14.77 |
0.00 |
1.44 |
5.3. Analysis of Business Efficiency
The non-radial distance was obtained. The smaller the value of the distance, the closer it is to the correspared to the “Two High and onding effective point and the higher the efficiency value. The non-radial distance between the points on the efficiency boundary was 0. For better understanding, this distance was further normalized by means of min-max normalization, resulting in an efficiency score of 0–100, with higher scores resulting in greater efficiency. Another result of the SBM model is the slack variable. The slack variable is the amount of each input (or output) variable that should be reduced (increased) when the efficiency is improved. Therefore, the smaller the slack variable of a factor is, the higher the utilization efficiency of the factor is (the relaxation variable of the non-satisfactory output refers to the number of efficiency improvements that should be reduced).
Overall, as we cane Surplus” industries see in Figure 4, the operating efficiency of Chinese commercial banks has declined since they reached their peak in 2011.This is consistent with the previous discussion on how “excessive capital expansion leads to a decline in operating efficiency”. In 2008–2011, the efficiency scores rose rapidly as each slack variable declined (in order to increase the comparability between different slack variables, this paper represents the change rates in the slack variables. The larger the change rate, the lower the factor efficiency corresponding to the slack variable). It can be seen that the most important force leading this wave of operational efficiency improvements is the sharp increase in net profit, which is closely related to rapid economic recovery in the post-financial crisis, and a good economy promotes the improvement of the utilization efficiency of various input factors. During the period of 2011–2017, the overall operating efficiency gradually decreased. In terms of slack variables, the environmental protectiofficiency of all of the inputs and outputs shows varying degrees of decline during this period, and the most obvious feature is the decline in the control efficiency of the non-performing loan ratio. All of the indicators showed a brief small rally in 2017–2019. Affected by the COVID-19 epidemic, the operating efficiency in 2020 showed a sharp decline. As seen from the figure, the most important reason for this comes from the rapid decline in net profits.
On the other hand, compared to other industry is better, but its financing puts, the inefficient use of fixed assets and business outlets is more prominent and has existed for a long time. Among them, the number of business outlets before 2009 was the minimum efficiency investment, which is consistent with the conclusion of the research performed by Wang Bing and Zhu Ning [63]. The rate at which personnel are utilized and the management expenses gradually converge, a phenomenon that can be explained by saying that the efficiency of management expenses is gradually determined by how efficiently employees are used. The biggest factor causing the fluctuations in the overall operating efficiency is the substantial adjustments in net profit, followed by the non-performing loan ratio.
From the perspective osts are high f different types of commercial banks(in Figure 5), the operating efficiency of large state-owned banks has risen to the highest level in the industry through a series of measures such as capital injection, bad debt stripping, shareholding reform, among others. These measures have resulted in strong national joint-stock commercial banks. In contrast, the city commercial banks cannot compete with the national banks due to the restrictions of their operating areas, and they have to compete with rural commercial banks for tight regional resources, resulting in the operating efficiency declining. Rural commercial banks have a low level of operating efficiency. The efficiency stratification of different types of banks is basically consistent with the study of Li Lifang et al. [64]. From the perspective of commercial banks in different regions, the economic environment plays a significant role in dividing them into different efficiency categories (in Figure 6). Commercial banks in the east have the highest operating efficiency, other than national banks, and the operating efficiency of commercial banks in the central and western regions is low.
Figures 4. 1-3)Average operating efficiency and slack variables.
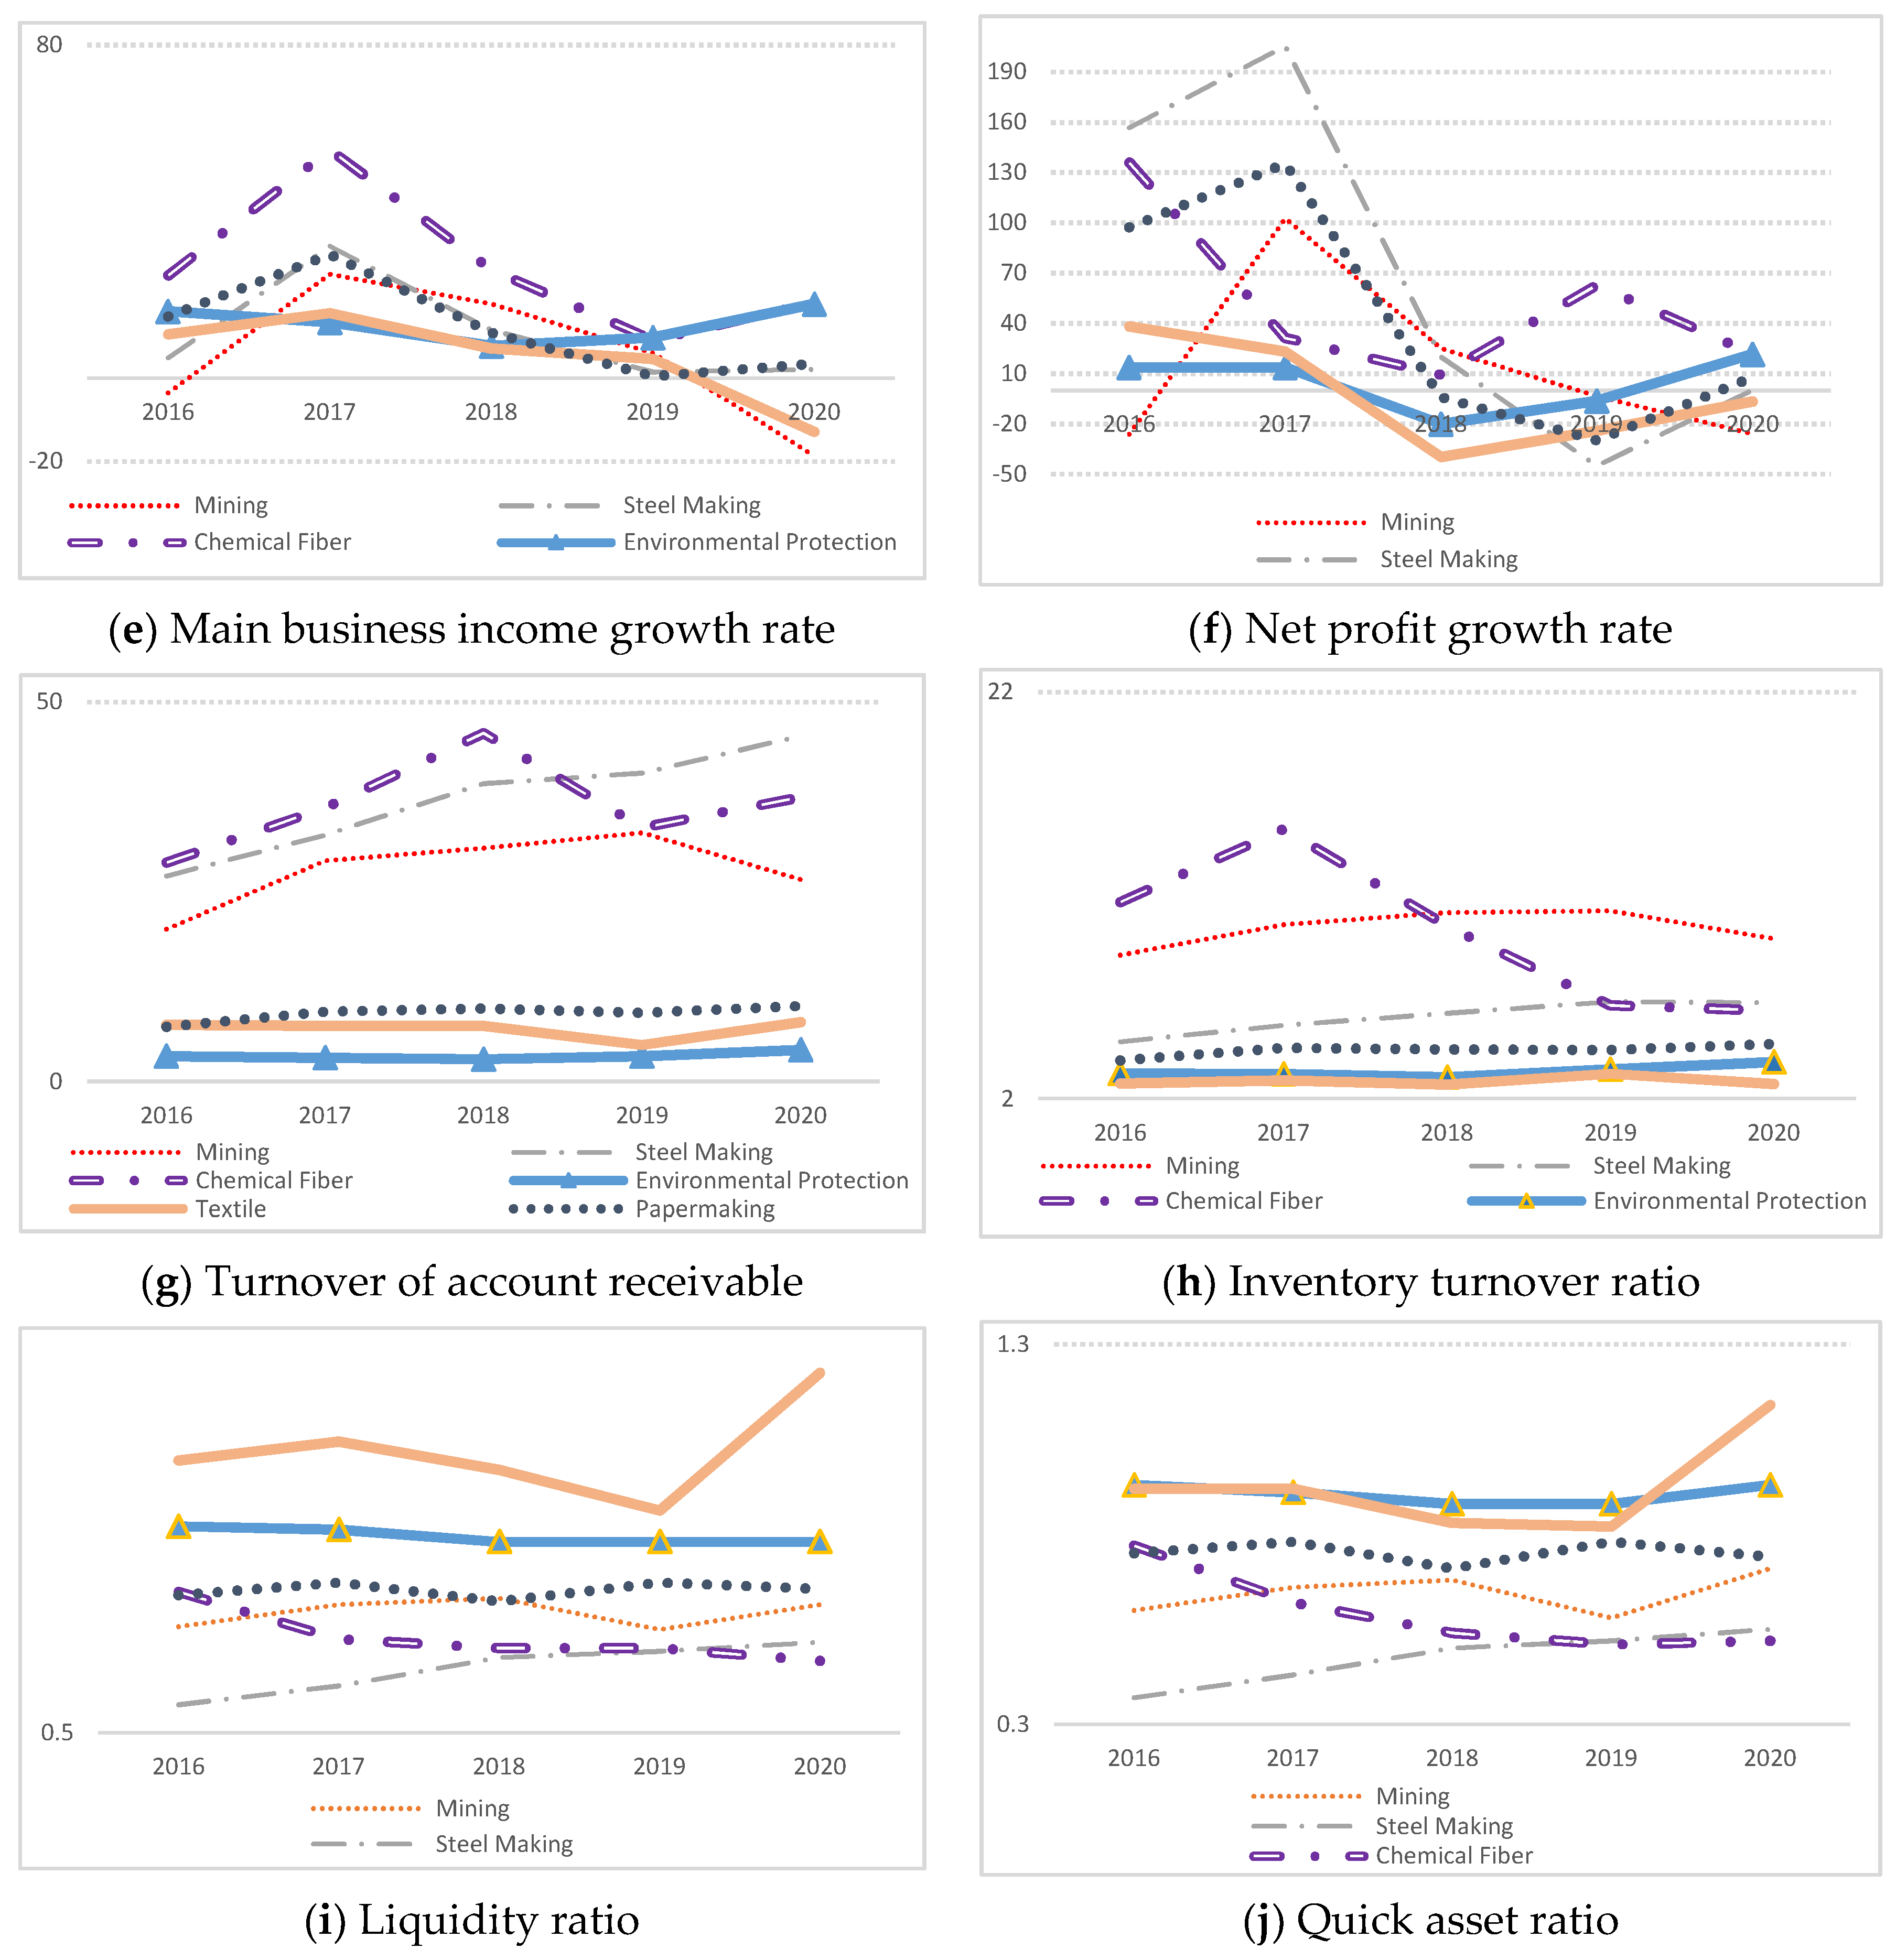 Figure 15. Financial comparison between green industries and the “Two High and One Surplus” industries.
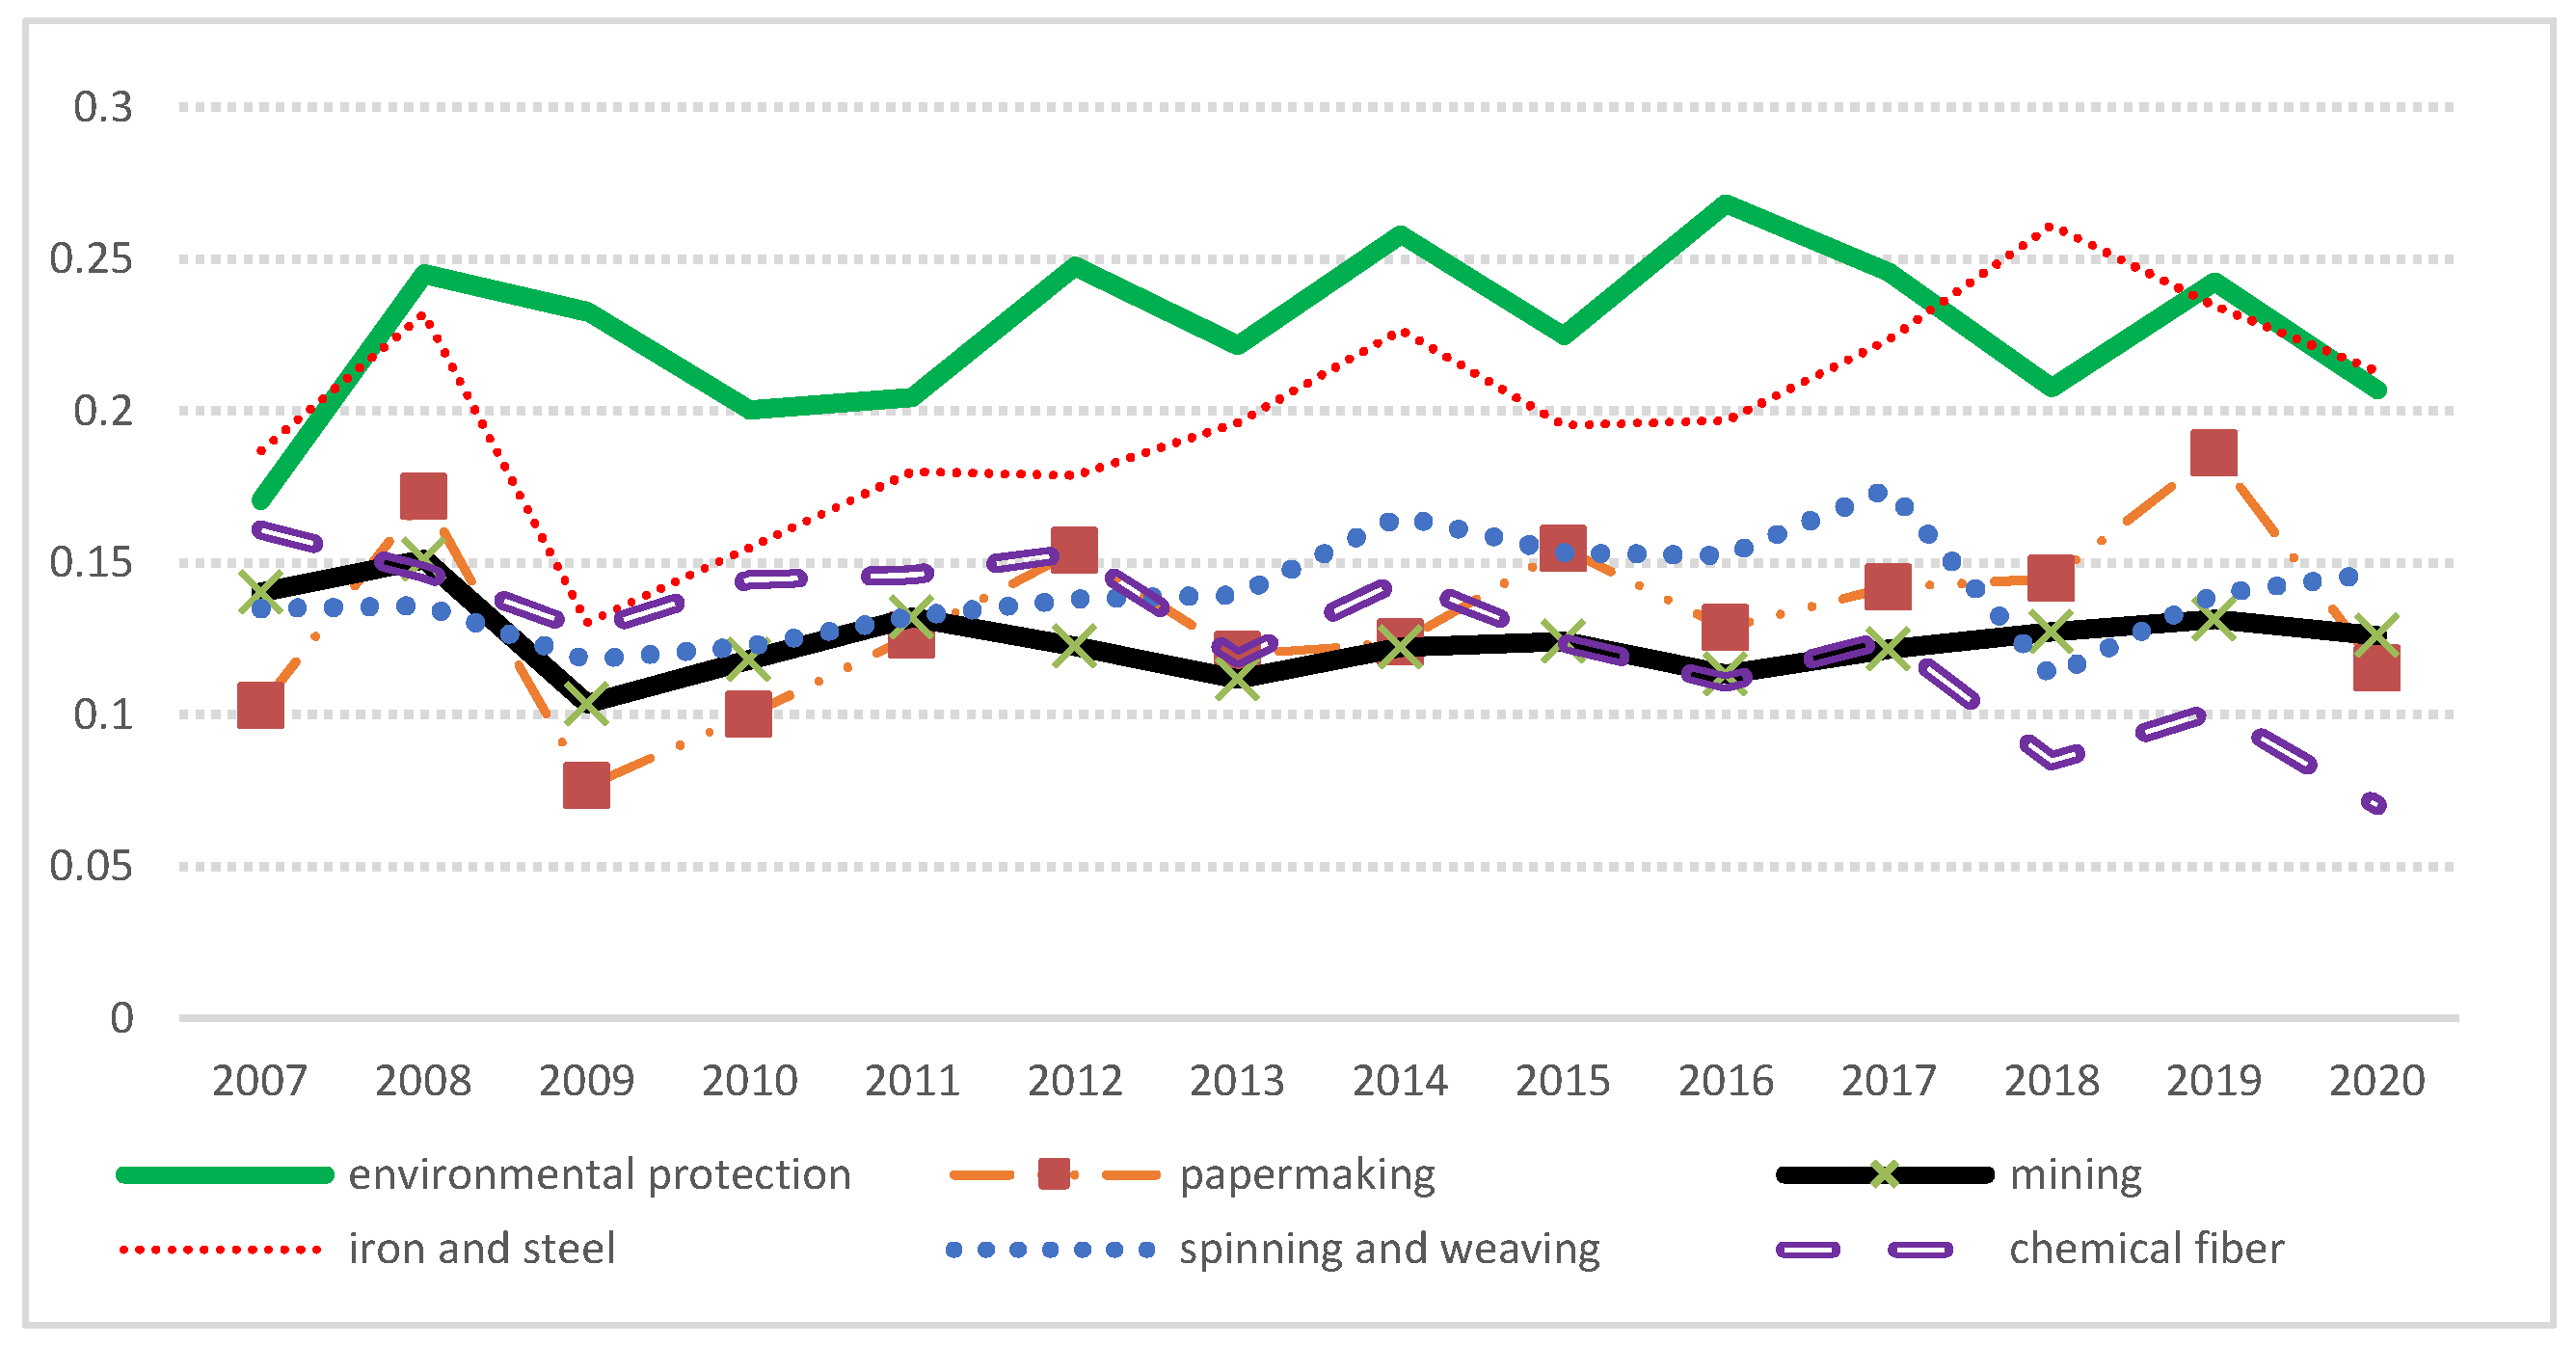
Operating efficiencies of the different types of commercial banks.
Operating efficiencies of commercial banks in different regions.
- Green Credit and Bank Operating Efficiency
When comparing the trends in the operating efficiency of commercial banks and the proportion of green credit, the average value of green credit is easily affected by extreme values due to the limitations in the amount of information that is publicly disclosed, thus affecting the accuracy of the conclusions. As shown in the left figure below, if the proportion of green credit is simply averaged, then there is a certain negative correlation with the operating efficiency; that is, the higher the proportion of green credit is, the lower the operating efficiency of the banks is as well. In cases where the sample size is small, this simple average method is easily affected by large values, thus resulting in wrong judgments. For example, the green credit ratio in industrial banks has been 3–7 times higher than the average ratio for a long time. In order to eliminate these influences, the method proposed in this paper standardizes the deviation of each bank’s green credit ratio in its own time series and then averages it in years to determine the average green credit ratio for each year. The same treatment is performed on the operating efficiency to obtain the average efficiency score. This processing method highlights the rising and falling trends in the data over time, smooths the influence of extreme values, and fits the average trend better. The final results are shown in Figure 7. It can be seen from the figure on the right that the proportion of green credit after the standardized treatments is positively correlated with the efficiency score to a certain extent; that is, the higher the proportion of green credit, the higher the operation efficiency of the banks. A regression model is used to verify this below.
|
|
|
|
(a) Rate of green loans and efficiency |
(b) Rate of green loans and efficiency |
|
(simple arithmetic mean) |
(standardized by individual banks) |
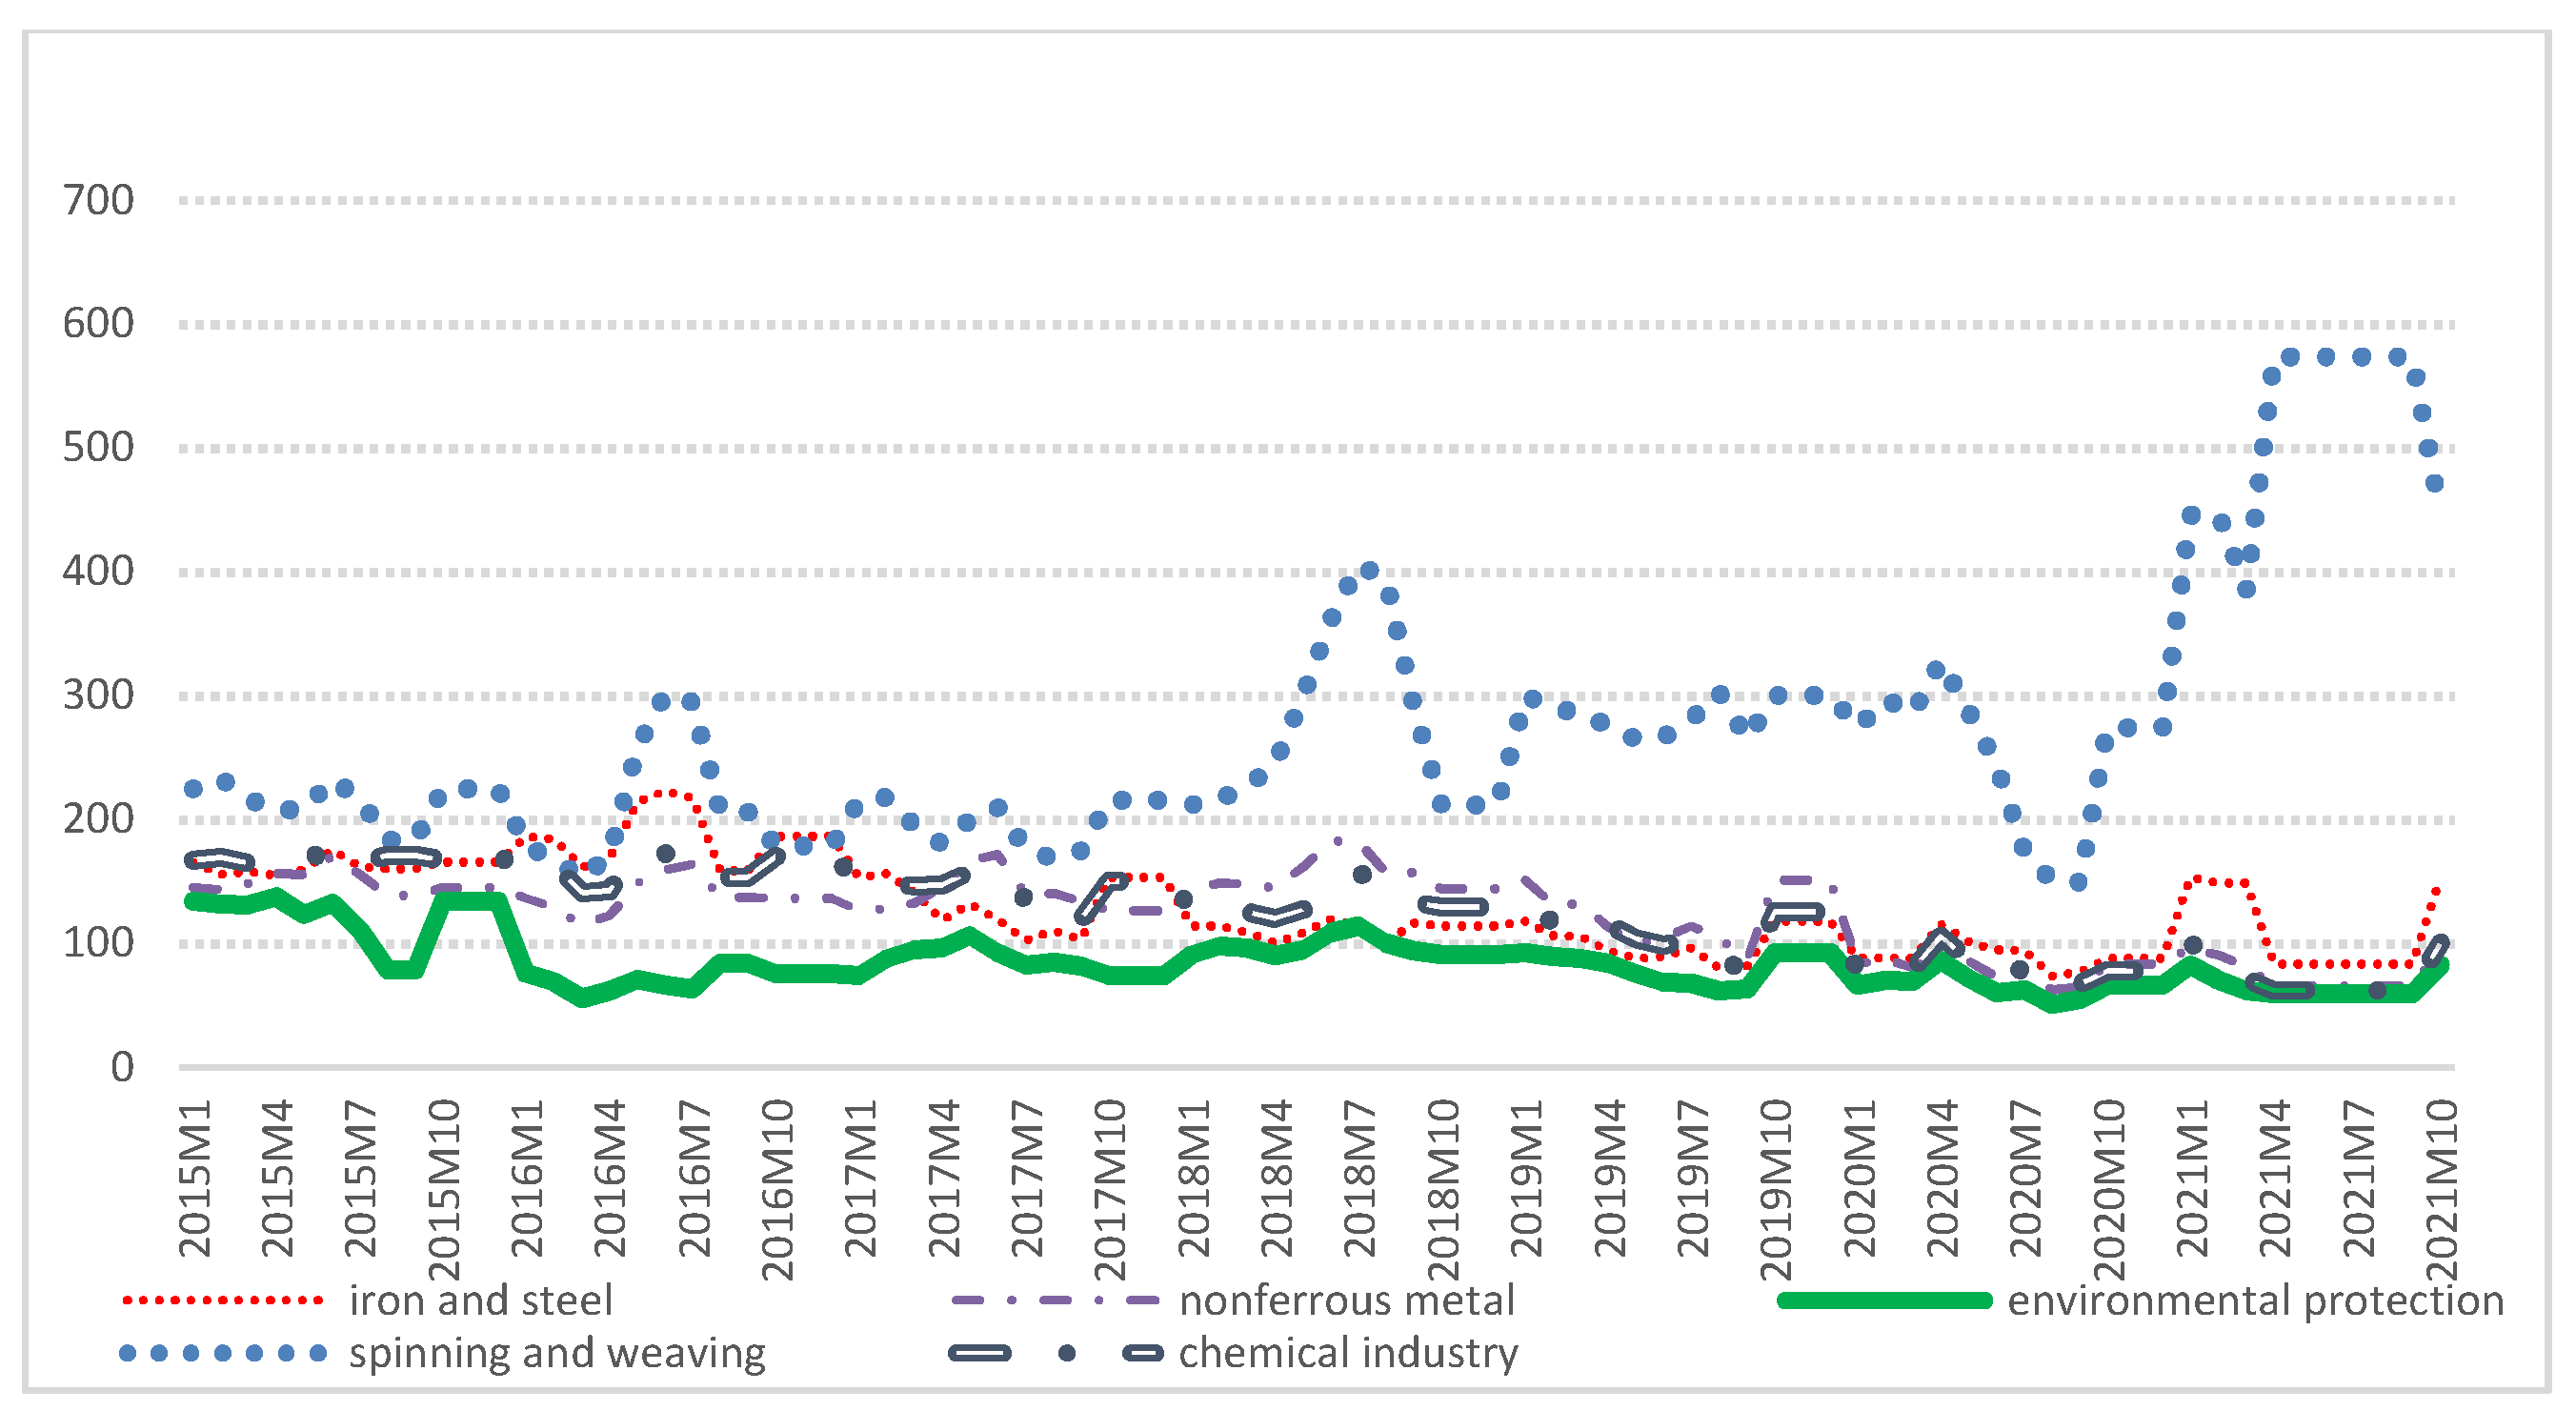 Figure 37. Credit spread (median): industrial debt.
Green credit ratio and operating efficiency (trend comparison under different averaging methods).
6.1. Model and Variables
Compared to the panel data from the mixed-effect model, the individual fixed-effect model eliminates the influence of individual characteristics that do not change the average effect in the form of difference over time and can eliminate the influence of extreme individuals without reducing the sample size. Therefore, this paper takes the green credit ratio as the core explanatory variable and adopts an individual fixed-effect model to analyze the non-radial distance and each slack variable (here, the slack variables decrease the proportion of inputs and undesirable outputs and increase the proportion of desirable outputs. It can be seen that the larger the slack variable, the lower the efficiency. Therefore, if the regression coefficient of the proportion of green credit is significantly negative, it shows that increasing the amount of green credit can improve the efficiency, and vice versa):
|
, |
(8) |
|
. |
(9) |
and are the non-radial distance and green credit ratio, respectively. represents the slack variables of the inputs and outputs, and and are the control variables for two models. and are the random interference terms. and are individual fixed effects. China’s supply of credit resources demonstrates a certain regional segmentation phenomenon [65]; that is, there is a large amount of funds clustered in some regions. Therefore, regional variables may have an impact on the operational efficiency and the green credit ratio of commercial banks. We introduced regional GDP, regional financial depth, and regional market share into the control variables. Furthermore, individual factors such as age and asset size were added into the control variables to reduce the endogeneity of the model. The descriptive statistics of these variables are in Table 5.
4Table 5.
Descriptive statistics (regression of green credit ratio and operating efficiency).
|
Variable |
Variable Declaration |
Obs |
Mean |
SD |
Min |
Max |
|
Dv |
Non-radial distance |
491 |
2.326 |
1.439 |
0 |
14.766 |
|
B Branch |
Slack variable of branch |
491 |
0.463 |
0.265 |
0 |
0.934 |
|
B Staff |
Slack variable of staff |
491 |
0.326 |
0.212 |
0 |
0.902 |
|
B FixedAsset |
Slack variable of fixed assets; CNY 100 million |
491 |
0.53 |
0.30 |
0 |
0.96 |
|
B AdminCost |
Slack variable of management cost; CNY 100 million |
491 |
0.25 |
0.21 |
0 |
0.80 |
|
B wNPLR |
Slack variables of dynamic non-performing loan ratio; % |
491 |
0.55 |
0.30 |
0 |
0.98 |
|
B NP |
Slack variables of net profit; CNY 100 million |
491 |
0.20 |
1.06 |
0 |
14.19 |
|
GreenLoanRate |
Green credit ratio; % |
368 |
3.74 |
4.082 |
0.06 |
29.37 |
|
LnAsset |
Log of total assets; CNY 100 million |
568 |
9 |
1.741 |
5.11 |
12.72 |
|
LnReGDP |
Log of the actual GDP of the area: CNY 100 million |
602 |
11.26 |
1.604 |
7.97 |
13.45 |
|
GDP |
Regional GDP growth rate; % |
602 |
8.86 |
3.25 |
−5 |
17.4 |
|
FinInspPop |
Financial depth: the number of financial institutions per capita in the region; individual/10,000 people |
602 |
1.58 |
0.23 |
1.03 |
2.33 |
|
Age |
Age: from the date of establishment; year |
602 |
18.52 |
10.63 |
−4 |
69 |
|
MarketShare |
Market share: the bank in its region (by deposits); % |
590 |
4.70 |
4.29 |
0.06 |
17.72 |
|
PFEpGDP |
Public fiscal expenditure accounted per GDP; % |
602 |
19.61 |
5.55 |
8.74 |
40.22 |
6.2. Empirical Results
From the regression results, it can be seen that increasing the proportion of green credit in commercial banks will improve all aspects of their operating efficiency. All else being equal, each percentage point increase in green credit brings commercial banks closer to the effective boundary by 0.07 units on average (Table 6). This proves that green credit policies can effectively improve the allocation efficiency of the internal resources of commercial banks. Through the regression of the green credit ratio to the slack variable (Table 7), it can be seen that during the operation of commercial banks, increasing the proportion of green credit can significantly improve the efficiency of all of the inputs and outputs. Among them, improving the efficiency has the biggest effect on the net profits. All other things being equal, an average percentage point in the green credit ratio of one can promote the net profit index towards its corresponding effective standard by 3.31. Improving the efficiency of the non-performing loan ratio is also obvious, a finding that is supported by the market data. For example, according to data from the CBRC in June 2016, the non-performing green credit ratio of 21 major banks was only 0.41%, 1.35% lower than that of other loans during the same period (http://www.cbirc.gov.cn/cn/view/pages/ItemDetail_gdsj.html?docId=22943&docType=0, accessed on 8 April 2022).
The excessive speed of capital expansion leads to Chinese commercial banks having excessive internal resources, resulting in the gradual decline of the overall operating efficiency after 2011. In essence, green credit policies increase the green credit ratio; on the one hand, they make more effective use of the excess internal resources, and on the other hand, they improve the allocation efficiency of internal resources, alleviating the problem of low operating efficiency. This proves Hypothesis 2.
Table Do6. GreThe regression results for the green credit ratio on non-radial distances.
|
|
(1) |
(2) |
(3) |
|
Dv |
Dv |
Dv |
|
|
GreenLoanRate |
−0.0863 *** |
−0.0663 *** |
−0.0551 *** |
|
LnAsset |
|
1.063 *** |
|
|
LnReGDP |
|
−3.444 *** |
−4.833 *** |
|
FinInspPop |
|
2.919 *** |
|
|
age |
|
|
0.295 *** |
|
MarketShare |
|
|
0.218 *** |
|
Constant |
2.508 *** |
27.97 *** |
51.91 *** |
|
|
|
|
|
|
Observations |
368 |
368 |
368 |
|
R-squared |
0.055 |
0.157 |
0.232 |
|
Number of id |
43 |
43 |
43 |
|
F-Test |
8.93 |
9.07 |
11.33 |
|
Hausman (p value) |
0.000 |
0.000 |
0.000 |
Standard errors in parentheses. *** p < 0.01, ** p < 0.05, * p < 0.1.
Tablen Credit7. PoRegression results of the green credit ratio on the slack variables.
|
|
(1) |
(2) |
(3) |
(4) |
(5) |
(6) |
(7) |
|
B_Branch |
B_Branch |
B_Staff |
B_FixedAsset |
B_AdminCost |
B_wNPLR |
B_NP |
|
|
GreenLoanRate |
−0.0119 *** |
−0.0184 *** |
−0.0123 *** |
−0.0192 *** |
−0.00907 *** |
−0.0238 *** |
−0.0331 ** |
|
GDP |
0.0201 *** |
|
|
|
|
|
|
|
MarketShare |
0.0384 *** |
|
|
|
|
|
|
|
PFEpGDP |
|
|
|
|
|
|
0.183 *** |
|
Constant |
0.146 *** |
0.511 *** |
0.365 *** |
0.570 *** |
0.313 *** |
0.634 *** |
−3.641 *** |
|
Observations |
368 |
368 |
368 |
368 |
368 |
368 |
368 |
|
R-squared |
0.232 |
0.098 |
0.044 |
0.073 |
0.042 |
0.078 |
0.155 |
|
Number of id |
43 |
43 |
43 |
43 |
43 |
43 |
43 |
|
F-Test |
27.12 |
22.69 |
10.42 |
14.74 |
19.65 |
8.87 |
3.04 |
|
Hausman (p value) |
0.0338 |
0.000 |
0.000 |
0.000 |
0.000 |
0.000 |
0.000 |
Standard errors in parentheses. *** p < 0.01, ** p < 0.05, * p < 0.1.
- Discussion of Endogeneity and the Robustness Test
7.1. Discussion of Endogeneity
As there is policy space for the disclosure of green credit data, commercial banks can choose the green credit data that they wish to publish to a certain extent. Therefore, the samples that can be collected may be from commercial banks with a high proportion of green credit. This potential problem leads to the possibility of endogeneity caused by a non-random sample (self-selection bias); that is, the sample selection is endogenous. On the other hand, some important variables related to the proportion of green credit may be omitted from the model. Heckman’s two-stage method and the instrumental variable method are used to discuss the above two types of endogeneity problems.
For non-random sample problems, this paper refers to Heckman’s [66] two-stage method and introduces the non-randomness of the sample into the original regression model in the form of a variable called the inverse Mills ratio (IMR) to solve the self-selection bias problem in the regression model.
|
(10) |
|
|
(11) |
|
|
(12) |
|
|
(13) |
is a dummy variable. If a bank publishes green credit data in that year, then the corresponding value is 1; otherwise, it is 0. is a potential factor that affects whether banks publish green credit data, including the ages of the banks, whether they are listed, and the competition status of the industry. In this paper, we established a logistic model to analyze the relationship between and through the intermediate variable . and are the probability density function values and the cumulative distribution function values corresponding to the fitting value, respectively, and the two are divided to calculate the inverse Mills ratio . represents the green credit ratio, and is the corresponding control variable (the same as above). and are the residual terms for the two models, respectively. and are individual fixed effects.
In this paper, the instrumental variable method is used to analyze possible missing variable problems. In order to meet the relevance and externality principle of instrumental variable selection, we took the local implementation intensity of environmental protection as the direction of selection and constructed “the operating cost of industrial waste gas treatment facilities/sulfur dioxide emissions” as the indicator for the intensity of environmental protection implementation. Because of the rapid spillover of environmental technology, the average cost of waste gas treatment does not fluctuate much from region to region. Therefore, the ratio of the operating costs of industrial waste gas treatment facilities to sulfur dioxide emissions can reflect a region’s emission tolerance. The lower the environmental tolerance, the greater the demand for green projects, and the higher the proportion of green credit that commercial banks in a region have. On the other hand, there is a high correlation between the behavior of local officials and the credit structure of banks [65,67]. Government officials who are involved in promotion tournaments are limited by environmental assessment when pursuing GDP targets [68]. Therefore, the environmental tolerance of local government officials has a strong correlation with the green credit behavior of commercial banks within the jurisdiction. From the perspective of externality, environmental tolerance refers to the environmental awareness of the regional government, which is hardly affected by factors related to the operation performance of local commercial banks.
As seen from the regression results (Table 8), the inverse Mills ratio (IMR) is significant, indicating the existence of non-random sample problems. After modification, the positive effect of green credit on the operating efficiency of banks is improved (the coefficient increases from 0.0663 to 0.0692). From the perspective of the instrumental variable method (Model 4–5), environmental tolerance (OEIWGpSo2) has a certain correlation with the proportion of green credit, and endogeneity problems may underestimate the promotion effect of green credit on improving the operational efficiency of banks.
Tablicies Boost 8. Profits?The regression results of the endogenous tests.
|
|
(1) |
(2) |
(3) |
(4) |
(5) |
|
Dv |
Dv |
Dv |
GreenLoanRate |
Dv |
|
|
GreenLoanRate |
−0.0663 *** |
−0.0692 *** |
−0.0883 *** |
|
−0.344 ** |
|
LnAsset |
1.063 *** |
1.447 *** |
|
|
|
|
LnReGDP |
−3.444 *** |
−3.392 *** |
|
|
|
|
FinInspPop |
2.919 *** |
3.697 *** |
|
|
|
|
imr |
|
2.312 ** |
|
|
|
|
MarketShare |
|
|
0.198 *** |
|
0.119 ** |
|
r |
|
|
−0.370 *** |
|
−0.350 *** |
|
OEIWGpSo2 |
|
|
|
0.0503 ** |
|
|
Constant |
27.97 *** |
21.51 *** |
2.420 *** |
3.442 *** |
3.677 *** |
|
Observations |
368 |
368 |
368 |
325 |
325 |
|
R-squared |
0.157 |
0.173 |
0.168 |
0.015 |
|
|
Number of id |
43 |
43 |
43 |
43 |
43 |
Standard errors in parentheses. *** p < 0.01, ** p < 0.05, * p < 0.1.
7.2. Test of Robustness
Whether measuring the operational efficiency of commercial banks can effectively reflect objective facts is the key to determining whether the conclusions of this paper are reliable. During the DEA analysis of the efficiency, the weight change rule of the objective function is set in this paper, which may affect the reliability of the conclusions. This section analyerefore, the rule will be reset to test the robustness of the results. Specifically, the weight of net profit is still set as 1, and the tolerance of non-performing loans is reduced: when the non-performing loan ratio is lower than the industry average, the weight is set as 1; when the non-performing loan ratio is higher than the average but lower than 5%, the weight is set as 1.2; if it is above 5%, the weight is 1.5. The other methods remain unchanged.
By comparing the influences of different weight setting rules on the results (Tables 7 and 9), we can see that the significance of the regression coefficient remains unchanged after the rules that have been set for the dynamic weight have changed considerably. Although the size of the coefficient is the influence of reduced to a certain extent, such changes cannot overturn the original conclusions. That is, it still proves that green credit can significantly improve the operational efficiency of commercial banks using the allocation efficiency of input and output.
Table 9. Regression ren cresults for the robustness test (objective function reconstruction).
|
|
(1) |
(2) |
(3) |
(4) |
(5) |
(6) |
(7) |
|
B_Branch1 |
B_Branch1 |
B_Staff1 |
B_FixedAsset1 |
B_AdminCost1 |
B_wNPLR1 |
B_NP1 |
|
|
GreenLoanRate |
−0.0113 *** |
−0.0175 *** |
−0.0115 *** |
−0.0170 *** |
−0.00852 *** |
−0.0207 *** |
−0.0300 * |
|
GDP |
0.0193 *** |
|
|
|
|
|
|
|
MarketShare |
0.0342 *** |
|
|
|
|
|
|
|
PFEpGDP |
|
|
|
|
|
|
0.162 *** |
|
Constant |
0.172 *** |
0.508 *** |
0.355 *** |
0.568 *** |
0.317 *** |
0.549 *** |
−3.253 *** |
|
Observations |
368 |
368 |
368 |
368 |
368 |
368 |
368 |
|
R-squared |
0.226 |
0.098 |
0.047 |
0.063 |
0.043 |
0.095 |
0.125 |
|
Number of id |
43 |
43 |
43 |
43 |
43 |
43 |
43 |
Standard errors it n parentheses. *** p < 0.01, ** p < 0.05, * p < 0.1.
- Conclusionsand Policy Recommendations
8.1. Conclusions
According to the development statio on the financial indicators of Chius, the Chinese government must further promote green credit policies to finance green economic development. However, in the context of a weak global economy, such economic transformation may face the risks and challenges of a further decline in the domestic economy. With such doubts, from the perspective of commercial banks, this paper tries to clarify the market logic of green credit policies and explore whether green credit policies conform to the long-term market mechanism.
Section 3 analyzese commercial banks through regress the financial status and credit financing costs of two types of loan customers (the enterprises in the environmental protection industry and the “Two High and One Surplus” enterprises), corresponding to a green credit policy that is based on the financial information of the loan customers. It was found that green enterprises have a better financial status and less risk but higher credit financing costs than the “Two High and One Surplus” enterprises. On the one hand, the pricing differences between the capital market and the credit market regarding the financing costs of green enterprises result from the monopoly that commercial banks have in the credit market. On the other hand, commercial banks benefit from the implementation of green credit policies. The financial comparison lays an important theoretical foundation for demonstrating how green credit policies affect the operation of commercial banks.
Section 4 closely comethodbines previous research from the literature and the content of the first part of the paper through regression analysis and studies the influence of increasing the ratio of green credit to the operating results of commercial banks (namely, financial indicators). It is pointed out that the differences in conclusions from the literature are due to the selection of model variables. The root cause of these differences may be the rapid expansion of the capital of commercial banks in the sample period, resulting in a decline in the internal factor allocation efficiency. The empirical analysis proves that increasing the green credit ratio can increase the total profits of commercial banks and puts forward that green credit policies can solve the “overcapacity” problems that are experienced by commercial banks to a certain extent.
5. Green Credit and Bank Operating Efficiency
Section 5 analyzes the allocation efficiency of the internal resources of commercial banks from the perspective of input–output efficiency to prepare for the fourth part of the researchstudy. In terms of methods, an SBM-DEA model containing undesirable output (the non-performing loan ratio) was established, and the weights of the output variables were innovatively and dynamically coordinated. The results (Figure 4) show that the efficiency measurements for China'’s commercial banks largely conform to the economic reality, and the analysis of the slack variables effectively revealed the main reasons for the changes in the operating efficiency of commercial banks at various stages.
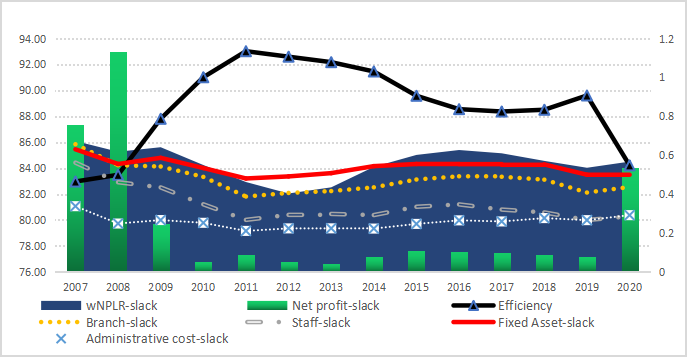
Figure 4. Average operating efficiency and slack variables.
TSection 6 uses the operating efficiency and slack variables obtained in the third part of the paperough regression analysis, it i to study the influence of increasing the proportion of green credit on the operation processes (operating efficiency) of commercial banks. It was found that green credit policies mainly improve the overall operating efficiency of commercial banks from two aspects: (1) it improves the utilization efficiency of various internal resources, and (2) it improves the overall allocation efficiency of resources.
At the end of this paper, the possible endogeneity and robustness of the model were discussed and tested. We considered possible endogeneity problems such as omitted variables and non-random samples, and instrumental variables and Heckman’s two-stage method were used to test and adjust the model. It was found that it is the model that has mild endogeneity that underestimates the promotion effect of the green credit policy on the operational efficiency of commercial banks to some extent. For a robustness test, the influence of the weight rule changes on the research conclusions was tested by objective function reconstruction, and no significant differences were found in the conclusions.
8.2. Policy Recommendations
Based on the research in this paper, we can provide the following three policy suggestions:
First, commercial banks should continue to promote green credit policies. This paper has proven that increasing the proportion of green credit can not only increase the net profit of commercial banks effectively and reduce the non-performing loan ratio, but it can also make full use of their internal resources and improve the overall operating efficiency. Under the current situation of a transition in industry competition, excessive capital expansion, and a high idle rate of resources, Chinese commercial banks should further promote the implementation of green credit policies, improve overall asset profitability, and promote the optimal allocation of internal resources.
Second, from the perspective of the green industry, regulatory authorities should be committed to reducing the pricing differences between different financing markets and to solving the problems of “expensive financing” of green projects in a market-oriented way. The different financing pricing for green industries in the stock market and in the credit market stems from the monopoly that commercial banks have in the credit market, and the unequal competition relationship is determined by comparing the huge volume of credit financing and equity financing. Therefore, we suggest expanding the equity financing channels of green industry so that the equity market information can be transmitted to the credit market more effectively. On the other hand, differences in financing pricing may also result from the sensitivity of different markets to information asymmetry. When financing green projects, commercial banks require a higher risk premium for uncertainty. Therefore, a credit guarantee mechanism can be designed to reduce the cost of uncertainty.
From the perspective of finance, the government should gradually reduce green financial subsidies in coordination with supporting policies and measures. This paper has proven that the green credit policies of commercial banks are in line with their own market interests, laying a theoretical and factual basis for the withdrawal of fiscal subsidies. However, attention should be paid to the reaction of the market when withdrawing fiscal subsidies, and various policies and orderly withdrawal methods should be implemented. For example, due to the dominant position of commercial banks in green credit approval, they may transfer the cost increases caused by the abolition of fiscal discounts to enterprises applying for green credit by increasing interest rates. In this regard, regulators can provide two types of supporting measures: on the one hand, they can increase the benefits of green credit issued by commercial banks through policies, such as by supporting securing green credit; on the other hand, there should be more alternative financing channels for green projects to weaken the monopoly that commercial banks have on the financing market. At the same time, market monitoring mechanisms should be added, such as the establishment of a green credit financing index to monitor market reactions to fiscal cuts in real time.
References
- BP. Statistical Review of World Energy 2021, 70th ed.; BP: London, UK, 2021.
- Ma, J. The Evolution of and Prospect for Green Finance in China. Comp. Econ. Soc. Syst. 2016, 6, 25–32.
- Sequoiacap. Towards Zero Carbon—A Green Revolution Based on Scientific and Technological Innovation; Sequoiacap: London, UK, 2021.
- Zhou, L.A. The Incentive and Cooperation of Government Officials in the Political Tournaments an Interpretation of the Prolonged Local: Protectionism and Duplicative Investments in China. Econ. Res. J. 2004, 6, 33–40.
- Jiang, F.; Cao, J. Market Failure or Institutional Weakness—The Argument, Defect and New Development in Research of Redundant Construction Formation Mechanism. China Ind. Econ. 2009, 1, 53–64.
- Jiang, F.; Geng, Q.; Lv, D.; Li, X. Mechanism of Excess Capacity Based on China’s Regional Competition and Market Distortion. China Ind. Econ. 2012, 6, 44–56.
- Zhang, J. Research on the formation and resolution of Overcapacity in China from the perspective of industrial policy. Inq. Econ. Issues 2015, 2, 10–14.
- Dong, Q.; Wen, S.; Liu, X. Credit Allocation, Pollution, and Sustainable Growth: Theory and Evidence from China. Emerg. Mark. Financ. Trade 2019, 56, 2793–2811.
- Liu, X.; Wen, S. Should Financial Institutions be Environmentally Responsible in China? Facts, Theory and Evidence. Econ. Res. J. 2019, 54, 38–54.
- Ma, L.; Zhang, X. The Spatial Effect of China’s Haze Pollution and the Impact from Economic Change and Energy Structure. China Ind. Econ. 2014, 4, 19–31.
- Wang, M.; Huang, Y. China’s Environmental Pollution and Economic Growth. China Econ. Q. 2015, 14, 557–578.
- Deng, Y. Build “green Credit” for enterprise energy saving and emission reduction. Shanghai Securities News, 20 July 2007. Zhou, H.; Jian, L.; Li, G.P. Corporate Social Responsibility and Credit Spreads on Corporate Bonds—An Empirical Study Based on China’s Public Companies. Account. Res. 2016, 5, 18–25+95.
- Wang, X.; Wang, Y. Research on the Green Innovation Promoted by Green Credit Policies. Manag. World 2021, 37, 173–188+11. Dhaliwal, D.S.; Li, O.Z.; Tsang, A.; Yang, Y.G. Voluntary nonfinancial disclosure and the cost of equity capital: The initiation of corporate social responsibility reporting. Account. Rev. 2011, 86, 59–100.
- United Nations Environment Programme Finance Initiative. UNEP Statement by Financial Institutions on the Environment & Sustainable Development; United Nations Environment Programme Finance Initiative: Geneva, Switzerland, 1997. El Ghoul, S.; Guedhami, O.; Kwok, C.C.Y.; Mishra, D.R. Does corporate social responsibility affect the cost of capital? J. Bank. Financ. 2011, 35, 2388–2406.
- Boyreau-Debray, G.; Wei, S.J. Pitfalls of a State-Dominated Financial System: The Case of China; Social Science Electronic Publishing: New York, NY, USA, 2004. Li, G.; Wei, X. Definition, Measurements and Economic Consequences of Corporate Social Responsibility: A Survey on Theories of Corporate Social Responsibility. Account. Res. 2014, 8, 33–40+96.
- Shao, T. Financial mismatch, Ownership structure and Return on capital: A study of Chinese industrial firms from 1999 to 2007. J. Financ. Res. 2010, 9, 51–68. Li, G.; Zhang, Q.; Zhou, H. Corporate Social Responsibility and Financial Performance: Theory, Methods and Tests. Econ. Perspect. 2014, 6, 138–148.
- Berger, A.N.; Hasan, I.; Zhou, M. Bank ownership and efficiency in China: What will happen in the world’s largest nation? J. Bank. Financ. 2009, 33, 113–130. Goss, A.; Roberts, G.S. The impact of corporate social responsibility on the cost of bank loans. J. Bank. Financ. 2011, 35, 1794–1810.
- Garcia-Herrero, A.; Gavila, S.; Santabarbara, D. What explains the low profitability of Chinese banks? J. Bank. Financ. 2009, 33, 2080–2092. He, D.; Zhang, X. Reflections on some problems of carrying out green credit in China’s commercial banks. Shanghai Financ. 2007, 12, 4–9.
- Ma, J.; Wu, B. Floating interest rate policy differential pricing strategy and credit rationing for farmers by financial institutions. J. Financ. Res. 2012, 4, 155–168. Duffie, D.; Lando, D. Term structures of credit spreads with incomplete accounting information. Econometrica 2001, 69, 633–664.
- Zhan, M.; Wang, X.; Ying, C. Interest Rate Regulation, Behavior Distortion of Banks’ Credit Allocation and the Financial Restriction of China’s Listed Companies. China Econ. Q. 2013, 12, 1255–1276. Zhou, H.; Li, G.; Lin, W. Corporate Social Responsibility and the Cost of Debt Financing: Based on the Evidence of Shanghai Stock Exchange Listed Companies Issued Bonds. In Proceedings of the 2014 Annual Conference of Environmental Accounting Committee of Accounting Society of China, Nanjing, China, 25–26 October 2014; p. 15.
- Zhang, X.; Ge, J. Green finance policies and optimization of resources allocation efficiency in China. Ind. Econ. Res. 2021, 6, 15–28. Lin, W. Analysts Forecast and Corporate Bonds Credit Spreads—Based on the Data of Chinese Corporate Bonds in 2008–2012. Account. Res. 2013, 8, 69–75.
- Wang, L.; Xu, J.; Li, C. The Mechanism and Stage Evolution of Green Financial Policy Promoting Enterprise Innovation. Soft Sci. 2021, 12, 81–87. Gelb, D.S.; Strawser, J.A. Corporate social responsibility and financial disclosures: An alternative explanation for increased disclosure. J. Bus. Ethics 2001, 33, 1–13.
- Chen, W.; Hu, D. An Analysis of the Functional Mechanism and Effect of Green Credit on Industrial Upgrading. J. Jiangxi Univ. Financ. Econ. 2011, 4, 12–20. Richardson, A.J.; Welker, M. Social disclosure, financial disclosure and the cost of equity capital. Account. Organ. Soc. 2001, 26, 597–616.
- Qiang, X.; Fang, S. Does Reform on Security Interests System Affect Corporate Debt Financing? Evidence from a Natural Experiment in China. Econ. Res. J. 2017, 5, 146–160. Niu, H.; Zhang, X.; Zhang, P. Institutional Change and Effect Evaluation of Green Finance Policy in China: Evidence from Green Credit Policy. Manag. Rev. 2020, 32, 3–12.
- Lu, J.; Yan, Y.; Wang, T. The Microeconomic Effects of Green Credit Policy—From the Perspective of Technological Innovation and Resource Reallocation. China Ind. Econ. 2021, 1, 174–192.
- Sun, J.; Wang, F.; Yin, H.; Zhang, B. Money Talks: The Environmental Impact of China’s Green Credit Policy. J. Policy Anal. Manag. 2019, 38, 653–680.
- Shen, X. The Research on Green-Credit, Green Reputation and Financial Performance of Commercial Banks; Nanjing University of Finance and Economics: Nanjing, China, 2011; p. 47.
- Chami, R.; Cosimano, T.F.; Fullenkamp, C. Managing ethical risk: How investing in ethics adds value. J. Bank. Financ. 2002, 26, 1697–1718.
- Thompson, P.; Cowton, C.J. Bringing the environment into bank lending: Implications for environmental reporting. Br. Account. Rev. 2004, 36, 197–218.
- Aintablian, S.; Mcgraw, P.A.; Roberts, G.S. Bank monitoring and environmental risk. J. Bus. Financ. Account. 2007, 34, 389–401.
- Zhou, Y.; Luo, Y. Financial ecological environment, green reputation and credit financing: An empirical study of A-share heavily polluting listed companies. South China Financ. 2017, 8, 21–32.
- The Study Group of Green Finance, ICBC. A Study of ESG Green Rating and Green Index. Financ. Forum 2017, 22, 3–14.
- Guo, W.; Liu, Y. Green Credit, Cost-Benefit Effect and Profitability of Commercial Banks. South China Financ. 2019, 9, 40–50.
- Zhang, L.; Lian, Y. How Does Green Credit Affect the Financial Performance of Commercial Banks? From the Perspective of Income Structure Decomposition of Banks. South China Financ. 2020, 2, 45–56.
- Tong, M. Early Warning Research on Carbon Emission Reduction Credit Risk of Industrial Enterprises Based on FM Model. J. Quant. Tech. Econ. 2021, 38, 147–165.
- He, L.; Wu, C.; Zhong, Z.; Zhu, J. Green Credit, Internal and External Policies, and the Competitiveness of Commercial Banks: An Empirical Study of Nine Listed Commercial Banks. Financ. Econ. Res. 2018, 33, 91–103.
- Gao, X.; Gao, G. A Study on the Relation between the Scale of Green Credit and the Competitiveness of Commercial Banks. Econ. Probl. 2018, 7, 15–21.
- Ma, Y.; Du, C. Are Equator Principles Conductive to the Operational Efficiency of China’s commercial Banks? With Industrial Bank as a Case. Contemp. Financ. Econ. 2015, 7, 57–65.
- Liao, J.; Hu, W.; Yang, D. Dynamic Analysis of the Effect of Green Credit on Bank Operating Efficiency—Based on Panel VAR Model. Collect. Essays Financ. Econ. 2019, 2, 57–64.