1. RMS and ATR-FTIR Characterization of Hard Dental Tissues
Enamel and dentin are the major components of the human dental crown, whereas dentin and cementum are present in the human dental root. Enamel represents the most mineralized tissue of the human body, with a composition up to 96–97% (by weight) inorganic matter, 2–3% water, and only 1% non-collagenous organic material
[1]. The main component of the enamel mineral phase is crystalline bundles of hydroxyapatite (HA) in a hexagonal shape; hydroxyapatite is a mineral form of calcium apatite with a chemical formula Ca
5(PO
4)
3(OH), present in teeth and bones. Enamel mineralization is crucial since a reduction in mineral content could lead to caries susceptibility and dental lesions. Moreover, variation in mineralization may manifest itself through the formation of white spot lesions (WSLs), which also impact teeth aesthetics
[2]. Dentin is a composite material containing 70% mineral components, in form of mineral nanocrystallites, and 20% protein matrix, predominantly formed by cross-linked type I collagen (90% of the whole dentin protein fraction)
[3]. Cementum is a mineralized tissue covering the entire root surface and consists of approximately 50% inorganic matrix (HA) and 50% organic matrix (collagen, predominantly type I, and non-collagenous proteins) and water
[4].
In-depth knowledge of the extent and severity of dental disorders and alterations of dental structures may provide valuable information for treatment procedures.
To It has been this extent, several authors have investigated th
at the chemical composition of human teeth in terms of decay, demineralization/remineralization processes, and disease using various analytical methods
[5][6][7][8]. Among all, RMS represents an innovative technique, allowing
the study of both inorganic and organic components. Since the spectral profile and the peaks’ position can be influenced by composition and structure
[9], thus making their interpretation challenging, the detailed analysis of the spectral bands related to the chemical composition of the different dental components is mandatory.
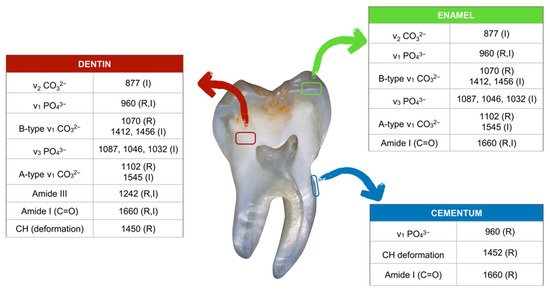
In
Figure 1, the main IR and Raman bands representative of enamel, dentin, and cementum in sound teeth are reported. Regarding enamel, the main Raman bands are assigned to phosphates (PO
43−, 960 cm
−1), and A- (CO
32−, 1102 cm
−1) and B-type (CO
32−, 1070 cm
−1) carbonate groups in HA
[10], with the latter representing the ν
1 symmetric stretching mode of CO
32− ions replacing PO
43− in the apatite lattice
[11]. Carbonate substitution affects HA in terms of solubility and reactivity
[12]. Significant changes in the intensities of these bands were found in carious lesions with respect to healthy enamel and were mainly attributed to demineralization-induced alterations of enamel crystallite morphology and/or orientation
[13][14]. It is well known that crystallinity increases when crystals are larger and/or more perfect, and when there is less substitution
[15]. Moreover, in Raman enamel spectra, a weak band at 1660 cm
−1, attributable to the amide I band and hence to the organic matrix, can be detected. The Raman spectrum of dentin is characterized by bands at 1660 cm
−1, 1450 cm
−1, and 1242 cm
−1 (attributable to collagen) and 1070 cm
−1 (CO
32−) and 960 cm
−1 (PO
43− of hydroxyapatite). Finally, cementum shows Raman bands at 960 cm
−1, and 1452 cm
−1 and 1660 cm
−1, the first assigned to the mineral component and the other two to the organic matrix
[13].
Figure 1. Main Raman (R) and IR (I) peaks of enamel, dentin, and cementum, together with the corresponding vibrational modes (ν: stretching vibration).
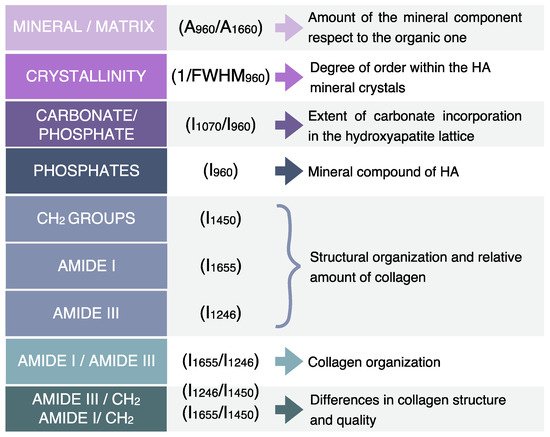
By the analysis of Raman spectra, some parameters, such as the full width at half maximum of a single band (FWHM) and band ratios obtained using the areas (A) or the intensities (I) of the most significant bands, can be calculated and used as markers to provide accurate diagnostic information related to diseases affecting dental tissues (
Figure 2). Among all, the main analyzed parameters are mineral/matrix (A
960/A
1660), crystallinity (inversely proportional to FWHM
960), P (I
960), and carbonate-to-phosphate ratio (C/P) or gradient in mineral content (GMC) (I
1070/I
960)
[16]. The mineral/matrix ratio (M/M) is related to the amount of the mineral component with respect to the organic one. It is calculated as the ratio between the area of the band at 960 cm
−1, which is the most intense mineral band of HA (attributed to phosphates), and that of the amide I band centered at 1660 cm
−1 [17]. This ratio is used to describe the mineral transitions in affected carious dentine, from the transparent zone into the normal zone
[18]. Indeed, Liu et al. found that the mineral component is higher within the sub-transparent zone than in normal and transparent zones
[18]. Crystallinity (C) is correlated with the degree of order within the mineral crystals and represents a critical component of HA, since ion substitution may introduce structural distortions. This parameter is directly proportional to the inverse of the full width at half maximum (FWHM) of the above-mentioned band centered at 960 cm
−1, meaning that a narrow band width indicates a high mineral crystallinity and vice versa
[3]. In the studies reported by Al-Obaidi et al. and Slimani et al., the degree of C was determined in enamel by measuring changes in the peaks ratio of the symmetric mode of phosphate at 960 cm
−1 over 950 cm
−1 [10][19]. The carbonate-to-phosphate ratio (C/P), or gradient in mineral content (GMC), calculated as the ratio between the intensities of the bands centered at 1070 cm
−1 and 960 cm
−1 attributed to carbonate and phosphate groups in HA, respectively, indicates the extent of carbonate incorporation in the HA lattice, and curve-fitting of the carbonate band reveals whether the carbonate has replaced hydroxide (A-type) or phosphate (B-type) in the apatite lattice. During the demineralization process, a progressive increase of C/P occurs, due to the substitution of CO
32− for PO
43− in HA (type B substitution)
[20][21]. Almhöjd et al. observed different values of this ratio in sound and carious dentine, the latter showing lower values with respect to sound dentine. In addition, the intensity of the peaks at 1246 cm
−1, 1450 cm
−1, and 1655 cm
−1 (attributed to amide III, CH
2 groups, and amide I, respectively) are employed to evaluate structural organization and relative amount of collagen. In more detail, the amide I/amide III ratio (calculated as the ratio between the area of amide I and amide III bands) is related to collagen organization, while the amide III /CH
2 and amide I/CH
2 ratios indicate differences in collagen structure and quality
[22][23].
Figure 2. Raman-derived markers for the characterization of hard dental tissues (I: intensity of the band; A: area of the band; and FWHM: full width at half maximum).
2. RMS Characterization of Dental Lesions
Hard dental tissues can be subjected to different factors that influence the normal chemical phenotype. Amelogenesis (AI) and dentinogenesis (DI) imperfectae represent a heterogeneous group of genetic conditions characterized by defects in the formation of enamel and dentin, respectively, in teeth of both dentitions
[24][25]. On the other hand, enamel and dentin mineralization can be affected, after their eruption, by different extrinsic factors, such as poor oral hygiene, alcohol and acidic beverage consumption, high intake of dietary carbohydrates, and dental trauma, all leading to early demineralization
[26]. Moreover, if these lesions are not stopped or reversed through non-invasive treatments, they can evolve from early enamel lesions to dental caries, affecting both the enamel and dentin.
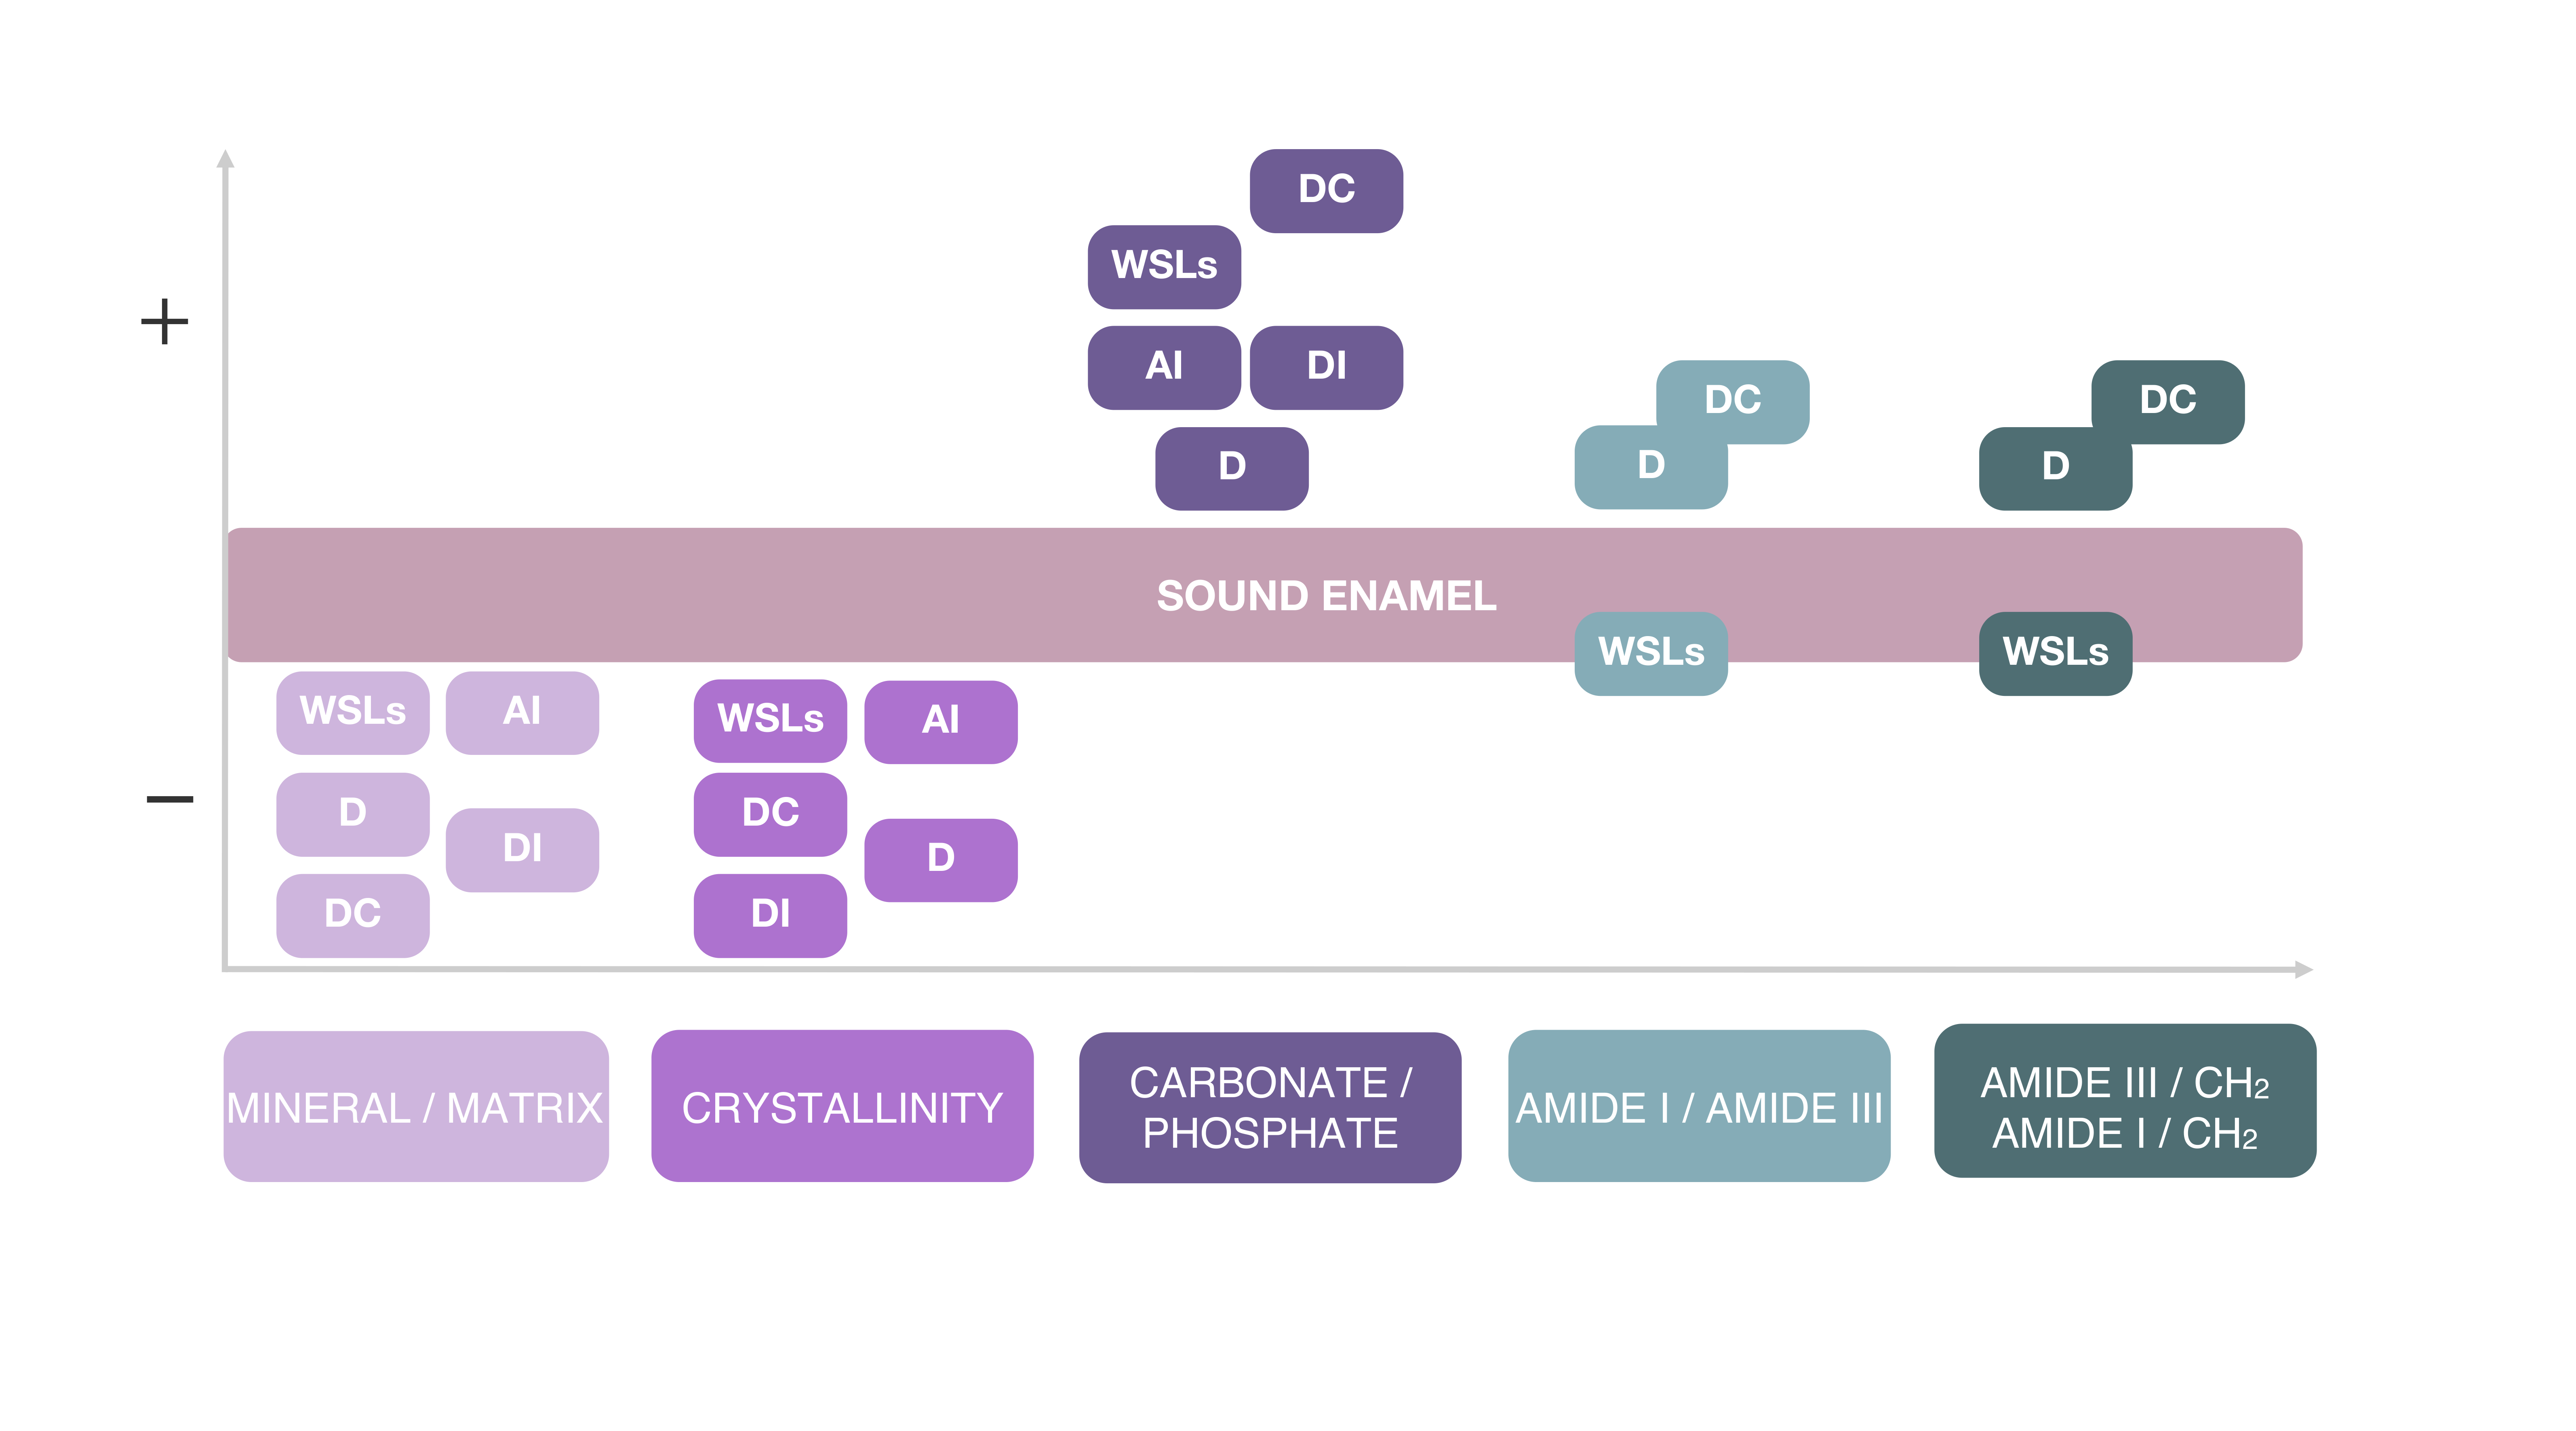
The relation between the main spectral features and the most frequent diseases of hard dental tissues is shown in Figure 34 and described in the paragraphs below.
Figure 34. Variations of the main Raman-derived spectral parameters in relation to different dental pathologies (WSLs: white spot lesions; D: dentin; DC: dental caries; AI: amelogenesis imperfecta; DI: dentinogenesis imperfecta).
2.1. RMS of Amelogenesis and Dentinogenesis Imperfectae
2.1. RMS Study of Amelogenesis and Dentinogenesis Imperfectae
The evaluation of enamel and dentin mineralization could be useful
fo
r the study of dental genetic anomalies, such as AI and DI
[27]. Wright et al. reported increased levels of protein in AI enamel, even up to 30% in some types, with respect to sound enamel; however, no significant differences were found in the carbonate content between AI and sound enamel. Moreover,
in the study of Bērziņš et al.,
it wathe authors suggested that a severely degraded AI tooth appeared to still include a small tier of highly ordered HA
[28]. In another
study, C/P was found to be significantly higher in AI teeth compared to sound teeth
[29].
FIn the case o
rf DI, dentin possesses higher peak intensities of phosphate and amide III bands than normal dentin
[30]. However, no significant differences were observed in the peak intensities of carbonate between DI and normal dentin. Additionally, C/P or GMC (carbonate-to-phosphate ratio or gradient in mineral content) was used to measure differences in relative composition, and a significant increment of GMC was found in DI-II dentin compared to normal dentin. Moreover, the ratio of amide I to amide III, relating to the organization of collagen, resulted in increased DGI-II dentin compared to normal dentin
[30].
2.2. RMS Characterization of Early Enamel Lesions
RMS is a valuable tool to detect carious lesions at an early stage of formation, since it allows for the collection of high-resolution maps and is highly sensitive to small changes in enamel composition
[10].
The first clinically visible stage of carious disease is characterized by enamel demineralization without cavitation, known as white spot lesions (WSLs). However, in the absence of effective treatment, cavitation may occur, thereby increasing the necessity of invasive restorative treatments
[31]. WSLs appear as milky white opaque spots on dental enamel. The translucency of enamel is an optical phenomenon that depends on the size of the intercrystalline spaces. In early stages, active caries require air drying to be visible, as the dissolution process of crystals at the outer enamel surface begins. Further enlargement of intercrystalline spaces results in a white patch that is visible without dryness. The effect of dehydration on enamel translucency is a result of the replacement of water content around enamel prisms with air. In a heterogeneous system, such as enamel prisms surrounded by a fluid medium, scattering occurs due to differences in the refractive indices (RI) of the two involved components. As the RI of enamel is approximately 1.65, while that of water is 1.33 and that of air is 1.00, a greater difference among RI values produces a greater scattering at the enamel/air interface
. Ko et al. and Kinoshita et al. successfully provided Raman spectral imaging characterization for early caries [32][33]. Indeed, the high spatial resolution (300 nm) makes it an excellent tool for analyzing human enamel components, enabling the detection of WSLs at an early stage of development [34]. . In order to define the levels of enamel demineralization after exposure to acid environments, some authors have analyzed the width of the bands related to phosphate vibrations (such as the band centered at 960 cm−1) [35].In
order to define the levels of ena
mel demineralization after exposure to acid environments, it has been analyzed that the width of the bands related to phosphate vibrations (such as the band centered at 960 cm−1) [35].Recentl recent study, chemical mapping of dental enamel was carried out over cross sections of specimens with natural and artificial WSLs
[10]. It was observed a severe decrease in the intensity of the PO
43− peak in the area corresponding to the body of the lesion, with respect to sound enamel. A similar trend was shown by C, which abruptly decreases in the lesion zone, while it starts to gradually increase in the intermediate zone, reaching its maximum value in sound enamel beyond the subsurface lesion. These findings are related to some alteration in crystal size and shape and, consequently, to reduced apatite perfection of the enamel prism. Finally, false color images derived from the CO
32−/PO
43− ratio, used to analyze changes in enamel inorganic components in each zone of the lesion, revealed an increase in the ratio in the lesion, in comparison to sound enamel. Hence, it can be stated that in WSLs, enamel becomes less compact due to the increase of inter-prismatic voids, and less mineralized due to the decrease in mineral density and the increase in the organic matrix content
[10].
2.3. RMS Characterization of Dental Caries
Dental caries is one of the most prevalent chronic diseases worldwide, affecting people throughout their lifetime. It is an irreversible microbial disease that affects the calcified structures of the tooth. Despite several preventive measures aiming to reduce the incidence of this pathology, such as careful dental hygiene and the addition of fluorine to drinking water, the occurrence of caries is still one of the most common diseases experienced by most individuals. It is known that the organic component can act as an inhibitor of hydroxyapatite crystals’ growth during the processes of formation and development of caries, causing organic and inorganic biochemical alterations
[18][36]. Therefore, a detailed analysis of these biochemical changes is mandatory to assess the best approach to help with remineralization of compromised dental tissue
[37].
There is a need to develop new methods able to identify the presence of enamel caries before it is detectable with routine assays. RMS may provide this by characterizing the biochemical composition of healthy and carious enamel and dentine
[38]. An in vitro
onestudy reported that polarized RMS showed a sensitivity of 97% and a specificity of 100% for the detection of caries
[32]. Moreover, another recent
one was
tudy concluded that RMS can be used as a non-contact analytical technology for in vitro studies to discriminate with high resolution the zones of carious dentin tissues by using the amide I/phosphate v1 band ratio, calculated as the ratio between the areas of the bands at 1655 cm
−1 and 960 cm
−1, related to amide I of proteins and ν1 of phosphates, respectively
[39].
PIn a previou
sls study, the polarized Raman spectra of enamel, obtained after excitation with the 785 nm laser beam, was used to calculate the depolarization ratio and polarization anisotropy for distinguishing early carious processes. In sound enamel, apatite crystals are ordered in one direction, perpendicular to the enamel surface; in the presence of caries, this ordered arrangement is altered and the structure appears more disordered with enamel crystals that are not parallel to each other. In sound enamel, the depolarization ratio is low and the polarization anisotropy is high; conversely, the first increases and the latter decreases due to disordered carious enamel structure
[40].
In the study of Buchwald et al.,
it wathe authors highlighted some differences in the intensity, position, and FWHM of the ν
1 band of phosphates at 960 cm
−1 between sound and carious enamel. The simultaneous decreases of the value of the band intensity and FWHM were associated with a lower amount of apatite crystals in carious enamel
[40]. It is important to check how these band parameters are affected by early demineralization of sound enamel under controlled conditions in order to define RMS as a reliable diagnostic tool in dentistry. Buchwald et al. observed that the values of the band position increase with enamel demineralization, and this shift to higher wavenumbers was attributed to changes in the vibrational energy of apatite crystals in demineralized enamel. These spectral modifications were also associated with a decrease in the amount of enamel phosphate and a reduction of the order of the structure
[40].
Das Gupta et al. reported RMS chemical maps of enamel and dentin caries infiltration
[41]. The enamel lesions appeared to be less mineralized due to more substituted carbonate in the crystal lattice compared to the sound enamel. When the lesion extends into the dentin, tissues have less mineral content than the sound dentin; however, many mineral apatites of caries are more crystalline and hence have less substituted carbonate in the lattice. Moreover, carious lesions have higher C than the dentin but lower C than enamel, and higher carbonate substitution in the lattice than enamel and dentin, which indicates the presence of crystals with less stoichiometric perfection in the caries lesion. In carious enamel, together with a decrease in the intensity of Raman peaks, differences in terms of band positions were also observed
[40].
During the demineralization process in dentin, the band at 960 cm
−1 becomes progressively lower, while the bands related to the organic component (amide I and amide III bands) did not show any change due to the acidic environment, thus proving that there is a progressive decrease in the fraction of the mineral phase with respect to that of the collagenous matrix
[42]. Interestingly, the remineralization process appeared to increase the relative intensity of the PO
43− bands only when dentin samples were treated in acidic solutions for less than 12 h. As the pH of the demineralizing environment was decreased to a value of 2, the Raman intensity of the phosphate bands was further reduced, and samples lost the ability to recover any mineralization after just 6 h of acidic treatment. During demineralization, a non-linear correlation was found between the M/M band ratio and C: M/M decreases with the square power of FWHM
960 [42]. The decrease in M/M at a rate faster than the linear rate let hypothesize that the main rate-controlling phenomenon for structural recovery during remineralization is the deposition of new mineral crystals
[42].