Your browser does not fully support modern features. Please upgrade for a smoother experience.
Please note this is a comparison between Version 1 by Juan Francisco García Martín and Version 2 by Peter Tang.
Olive oil is regarded as one of the healthiest food oils due to its high content in triglycerides with unsaturated acids, mainly oleic acid, and its phenolic composition. The analysis of the physico-chemical parameters of quality of olive oil is still carried out in laboratories using chemicals and generating waste, which is relatively costly and time-consuming. Among the various alternatives for the online or on-site measurement of these parameters, the available literature highlights the use of near-infrared spectroscopy (NIRS). The main features of the olive oil near infrared spectrum are illustrated in the present entry.
- chemometrics
- olive oil
- near-infrared spectroscopy
- quality parameters
1. Introduction
The International Olive Council defines olive oil as the oil obtained solely from fruits of the olive tree (Olea europaea L.), with the exclusion of oils obtained by solvents or by re-esterification procedures and any mixture with oils of another nature. As stated by this international intergovernmental organisation, the olive oils with the highest quality (so-called virgin oil oils) are those obtained ‘solely by mechanical or other physical means under conditions, particularly thermal conditions, that do not lead to alterations in the oil, and which have not undergone any treatment other than washing, decantation, centrifugation and filtration’ [1]. Virgin olive oils are classified, in turn, into extra virgin olive oils (EVOO), virgin olive oils (VOO), ordinary virgin olive oil, and lampante virgin olive oil [1][2], where EVOO is the olive oil of the highest quality. While the first three virgin olive oils are fit for consumption, lampante virgin olive oil must undergo processing prior to consumption.
The International Olive Council defines olive oil as the oil obtained solely from fruits of the olive tree (Olea europaea L.), with the exclusion of oils obtained by solvents or by re-esterification procedures and any mixture with oils of another nature. As stated by this international intergovernmental organisation, the olive oils with the highest quality (so-called virgin oil oils) are those obtained ‘solely by mechanical or other physical means under conditions, particularly thermal conditions, that do not lead to alterations in the oil, and which have not undergone any treatment other than washing, decantation, centrifugation and filtration’ [1]. Virgin olive oils are classified, in turn, into extra virgin olive oils (EVOO), virgin olive oils (VOO), ordinary virgin olive oil, and lampante virgin olive oil [1,2], where EVOO is the olive oil of the highest quality. While the first three virgin olive oils are fit for consumption, lampante virgin olive oil must undergo processing prior to consumption.
Olive oil is regarded as one of the healthiest food oils due to its high content in triglycerides with unsaturated acids, mainly oleic acid, and its phenolic composition. The former is related to a decrease in LDL-cholesterol fraction, while the latter is responsible for the antioxidant properties and the bitter taste of olive oil. Triglycerides account for almost all the saponifiable fraction of the olive oil (roughly 98 wt.%). On the contrary, the phenolic compounds belong to the unsaponifiable fraction, which represents about 2 wt.% of total olive oil. The most representative phenolic compounds in olive oils are oleuropein and hydroxytyrosol. In addition to phenolic compounds, the unsaponifiable fraction is composed of a wide variety of compounds, such as triterpenic alcohols, α-tocopherol (vitamin E), γ-tocopherol, β-carotene (precursor substance of vitamin A and responsible for the yellow–orange colour of olive oil), phytosterols, sterols, hydrocarbons, chlorophylls (responsible for the green colour of olive oil), and volatile compounds responsible for the aroma of olive oil.
Due to the current popularity of the Mediterranean diet and its use in a wide range of different recipes, the nutritional value of olive oil is internationally recognized today. EVOO is mainly used as a salad dressing and food to be eaten cold due to its flavour and taste. The rest of the edible olive oils are used mostly for cooking.
The most common physico-chemical parameters that define the quality of olive oils are the free acidity (FA), the peroxide value (PV), and the absorbency in ultraviolet (at 232 and 270 nm). These three physico-chemical parameters, along with the organoleptic characteristics (odour and taste, defects, fruity attributes, and colour), are used by producers for the determination of the quality of virgin olive oils. Notwithstanding, the International Olive Council establishes additional quality criteria for the designation of olive oils (both edible and non-edible), namely moisture and volatile matter (wt.%), insoluble impurities in light petroleum (wt.%), flash point (°C), trace metal content (mg/kg of iron and copper), fatty acid ethyl esters content (mg/kg), and biophenols content (mg/kg) [1]. Generally, olive oil producers do not regard them as quality parameters, but as composition parameters. Additional physico-chemical parameters such as oxidative stability (h), chlorophyll and carotenoid pigment profiles, and the bitterness index are often included [2]. Regarding organoleptic characteristics, the absence (EVOO) or weak presence (VOO) of sensory defects and the presence of three positive attributes, namely fruitiness, bitterness, and pungency, must be evaluated by skilled tasters.
2. Near-Infrared Spectroscopy (NIRS)
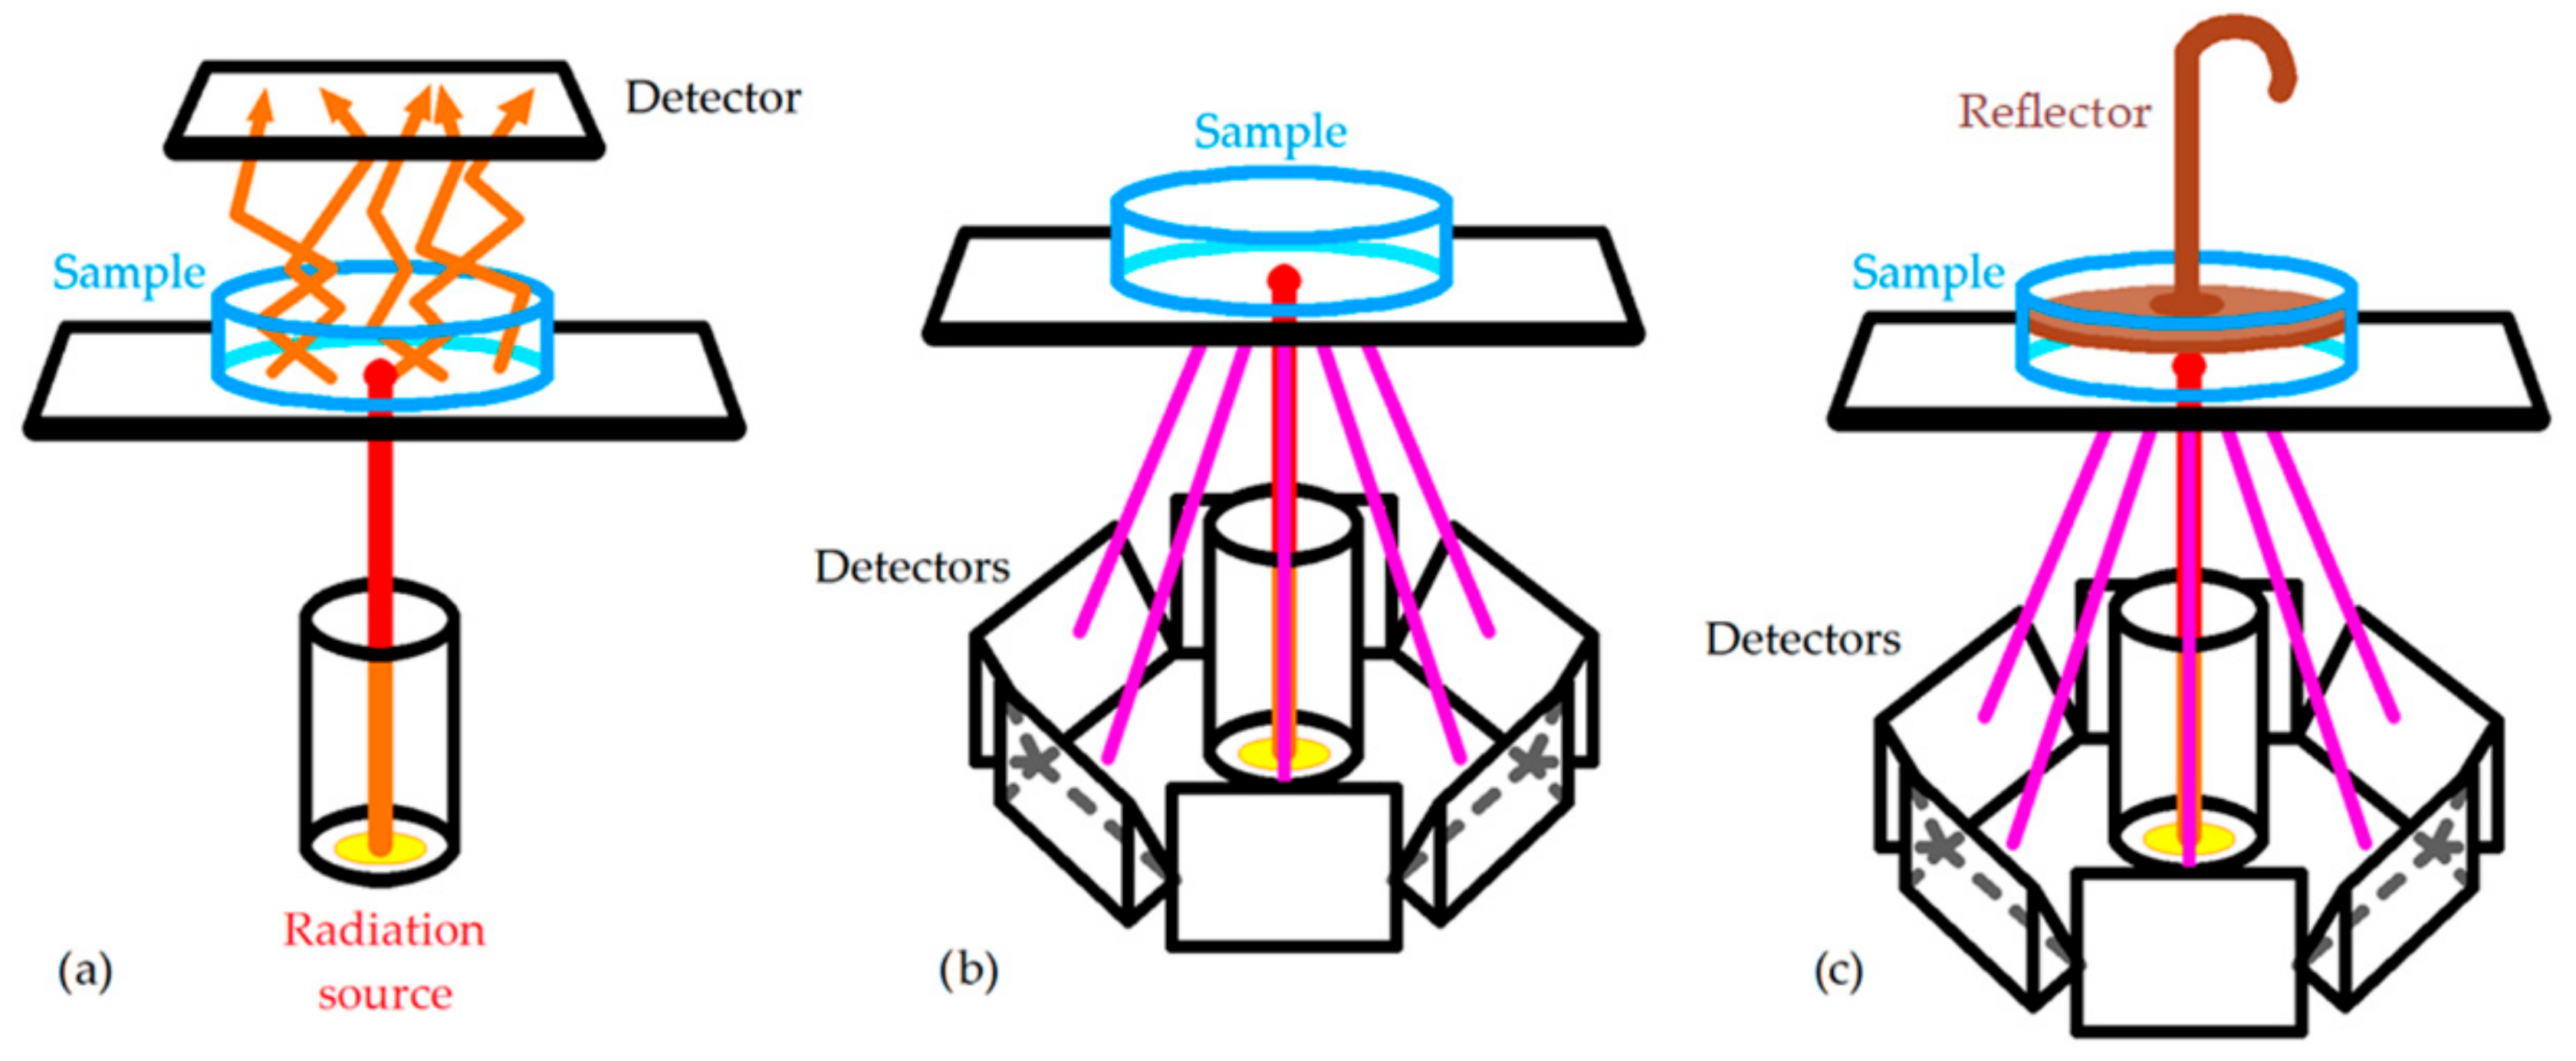
NIR spectroscopy is a vibrational spectroscopy, like Raman spectroscopy. A molecule absorbs NIR radiation (from 800 to 2500 nm) if the energy of the radiation corresponds to the energy difference between two vibrational levels and, in addition, a change occurs in the dipole moment of the molecule [3]. This is similar to what happens in the mid-infrared region. However, the bands of fundamental vibrations (Δn = ±1, where n is the vibrational quantum number) do not appear in the NIR spectrum, while absorptions due to the overtones and combination bands are observed. The overtone bands are due to Δn > ±1. Depending on the type of bonds, only the first (Δn = ±2) and second (Δn = ±3) overtones are likely to be observed. Combination bands occur only in polyatomic molecules and are due to simultaneous changes in the energy of two or more modes of vibration [3][4]. Therefore, the near-infrared spectrum is the result of the change in the molecular dipole moment during vibration. For example, the stretches of C=O in the CO2 molecule and of O–H in the water molecule, which are polar functional groups, have great absorption in the NIR spectrum [5]. Since the NIR spectrum of an analysed sample is the result of the combinations and overtones of the functional groups of its chemical constituents, the absorption peaks and bands found in the NIR spectrum are generally broad and weak. This makes NIRS more suitable for quantitative analysis than for compound identification (although NIRS can provide some information on functional groups). Hence, NIRS is regarded as a powerful analytical technique for the non-destructive, low-cost, rapid determination of compounds and parameters in food. Since NIR spectroscopy neither requires reagents nor generates waste, other advantages are providing a safe working environment and a huge potential for online measurement. An NIR spectrometer is composed of a radiation source (the most common is a tungsten–filament–fire halogen lamp with quartz window), a wavelength selector (generally a dispersive equipment), a sample holder, and a detector (generally built with semiconductors such as InGaAs and PbS). There are many sample holders depending on how the NIR spectrum is acquired [4]: transmittance, reflectance, and transflectance (2. Near-Infrared Spectroscopy (NIRS)
NIR spectroscopy is a vibrational spectroscopy, like Raman spectroscopy. A molecule absorbs NIR radiation (from 800 to 2500 nm) if the energy of the radiation corresponds to the energy difference between two vibrational levels and, in addition, a change occurs in the dipole moment of the molecule [3]. This is similar to what happens in the mid-infrared region. However, the bands of fundamental vibrations (Δn = ±1, where n is the vibrational quantum number) do not appear in the NIR spectrum, while absorptions due to the overtones and combination bands are observed. The overtone bands are due to Δn > ±1. Depending on the type of bonds, only the first (Δn = ±2) and second (Δn = ±3) overtones are likely to be observed. Combination bands occur only in polyatomic molecules and are due to simultaneous changes in the energy of two or more modes of vibration [3,4]. Therefore, the near-infrared spectrum is the result of the change in the molecular dipole moment during vibration. For example, the stretches of C=O in the CO2 molecule and of O–H in the water molecule, which are polar functional groups, have great absorption in the NIR spectrum [5]. Since the NIR spectrum of an analysed sample is the result of the combinations and overtones of the functional groups of its chemical constituents, the absorption peaks and bands found in the NIR spectrum are generally broad and weak. This makes NIRS more suitable for quantitative analysis than for compound identification (although NIRS can provide some information on functional groups). Hence, NIRS is regarded as a powerful analytical technique for the non-destructive, low-cost, rapid determination of compounds and parameters in food. Since NIR spectroscopy neither requires reagents nor generates waste, other advantages are providing a safe working environment and a huge potential for online measurement.
An NIR spectrometer is composed of a radiation source (the most common is a tungsten–filament–fire halogen lamp with quartz window), a wavelength selector (generally a dispersive equipment), a sample holder, and a detector (generally built with semiconductors such as InGaAs and PbS). There are many sample holders depending on how the NIR spectrum is acquired [4]: transmittance, reflectance, and transflectance (
Figure 1).
).
Figure 1.
Main configurations to acquire NIR spectra: (
a
) transmittance; (
b
) reflectance; (
3. Near-Infrared Spectrum of Olive Oils
The sample temperature has a great influence on the NIR radiation that it reflects and absorbs, which makes temperature a parameter of paramount importance in NIRS. For olive oils (and other oils), a sample temperature of approximately 32 °C is usually chosen [21][22][23][24][25][26][27]. At this temperature, olive oil is a homogeneous liquid, with a non-important loss of volatile compounds occurring. Therefore, the only sample preparation required in NIRS is heating and maintaining olive oil at that temperature during spectrum acquisition. On the other hand, near-infrared radiation penetrates deeper into organic samples than other electromagnetic radiations, such as ultraviolet (UV), visible, far-infrared, and mid-infrared radiations [28]. Therefore, the optical path length chosen when acquiring NIR spectra has a significant influence on the radiation absorption intensity at different wavelengths.The use of cuvettes of different path lengths for transmittance and probes for transflectance is best for homogeneous liquids, while reflectance is generally used for solid, heterogeneous samples.
FTIR (Fourier-transform infrared) spectroscopy is an analytical technique generally used to identify functional groups in organic and inorganic compounds by obtaining their infrared spectra in the range of 2500–25,000 nm [6]. FTIR spectrometers acquire infrared spectra from solid, liquid, or gaseous samples in absorption, total, attenuated, and diffuse reflectance, and photoacoustic modes [6]. The raw signal is first Fourier-transformed by the equipment. FTIR spectrometers generate a unique type of signal called an interferogram that has all of the infrared wavelengths encoded into it [7]. Some authors regard the Fourier transform as a type of wavelength selector [4]. Although it is not the most common, FTIR spectroscopy can be applied to the NIR region, i.e., FTNIR spectroscopy, resulting in a faster NIR spectra acquisition with a higher signal-to-noise ratio than conventional NIRS [8]. Some works can be found in the literature on the use of FTNIR with olive oils for quantitative or discriminating purposes [9,10,11,12,13,14].
Since the 1980s, several works have addressed the determination of the main properties of olives of interest to the farmer. An industrial development of NIRS equipment to measure the internal properties of intact olives occurred about 15 years ago, so nowadays it is easy to find commercial equipment to non-destructively measure the moisture and fat content of olives, such as the OliveScan™2 and Olivia™ equipment (FOSS, Hilleroed, Denmark), the Luminar 5030 olive and olive paste analyser (Soluciones Integrales de Laboratorio, S.L., El Casar de Talamanca, Spain), and the NIT-38 olive analyser (NIR Technology Systems, Sidney, Australia). In addition, portable NIR spectrophotometers can be purchased for roughly EUR 6,000 (e.g., Flame-NIR spectrometers, Ocean Optics, Inc., Orlando, FL, USA) and could be used at any stage of the olive oil production process. Although they have not been recognized as official methods by the International Olive Council, the determinations of fat content and moisture in olives by NIRS have been accredited as official methods by the pertinent authority of diverse countries. Notwithstanding, and despite the large available literature, such industrial development does not exist for the measurement of the quality parameters of olive oil.
At the beginning of the twentieth century, several works have addressed the use of NIRS to determine the olive oil quality’s parameters at different points in the oil extraction process in olive mills [16,17,18]. Furthermore, NIRS has been applied to design a quality control system for the identification of adulterated olive oils with other oils such as sunflower oil, corn oil, and raw olive waste [19], and to the differentiation of olive oils that belong to different denominations of origin [20]. Comprehensive reviews on these latter topics can be found elsewhere [21].
Three points within the olive oil production process seem to be the most suitable for the sampling of olive oils and the on-site determination of their quality parameters by NIRS. The first is at the exit of the horizontal decanter (2- or 3-outlet decanter). However, the samples taken at this point would be more intended for experimental purposes and the enhancement of the process (assessment of temperature of the olive oil in the decanter, etc.), and the values of the quality parameters could not match those of the oil once bottled. The second and third would be at the exit of the vertical centrifuge for oil clarification (or the sedimentation tank if available in the olive mill) and at the olive oil storage containers, respectively. Nevertheless, considering that NIRS is a rapid, non-destructive, technique that requires minimal sample preparation (no reagent) and relatively small amounts of a. sample (a few mL of olive oil), experts consider that the most suitable location for the NIRS equipment would be at the bottling plant. In this way, after filling a bottle with olive oil, a small sample would be immediately taken and its NIR spectrum acquired, which would provide the actual values of the quality parameters of the olive oil contained in the bottle. This would also speed up and make the olive oil labelling process more precise, as long as the International Olive Council (or the national quality bureaus) accepts NIRS as an official method for the determination of the olive oil’s quality parameters.
However, such types of online proposals have not been, or have been installed only to a limited extent, in olive mills. This is because the development of robust mathematical models is the key to the industrial application of NIRS for online monitoring. These models, previously obtained by using chemometrics, could be the starting point for designing and installing an online tool for the determination of the quality parameters of olive oil on process lines at olive mills, but a full-scale application requires a huge number of samples, not only from the different varieties of olives that the olive mill works with but also over several harvestings in order to develop mathematical models that can be used in a production context. In addition, the chemometric tools of NIRS equipment should provide self-learning model calibration systems. That is to say, the just-acquired spectra directly from the oils in the process line should be automatically included in the calibration data set to strengthen the models by expanding the data sets over time [16]. In this sense, FOSS annually updates the calibration models of their NIRS equipment to measure properties in intact olives and olive pastes, and customers have to pay to update their equipment if they apply for it.
3. Near-Infrared Spectrum of Olive Oils
The sample temperature has a great influence on the NIR radiation that it reflects and absorbs, which makes temperature a parameter of paramount importance in NIRS. For olive oils (and other oils), a sample temperature of approximately 32 °C is usually chosen [22,23,24,25,26,27,28]. At this temperature, olive oil is a homogeneous liquid, with a non-important loss of volatile compounds occurring. Therefore, the only sample preparation required in NIRS is heating and maintaining olive oil at that temperature during spectrum acquisition. On the other hand, near-infrared radiation penetrates deeper into organic samples than other electromagnetic radiations, such as ultraviolet (UV), visible, far-infrared, and mid-infrared radiations [29]. Therefore, the optical path length chosen when acquiring NIR spectra has a significant influence on the radiation absorption intensity at different wavelengths.
Figure 2,
3,
Figure 3,
4,
Figure 4 and
5 and
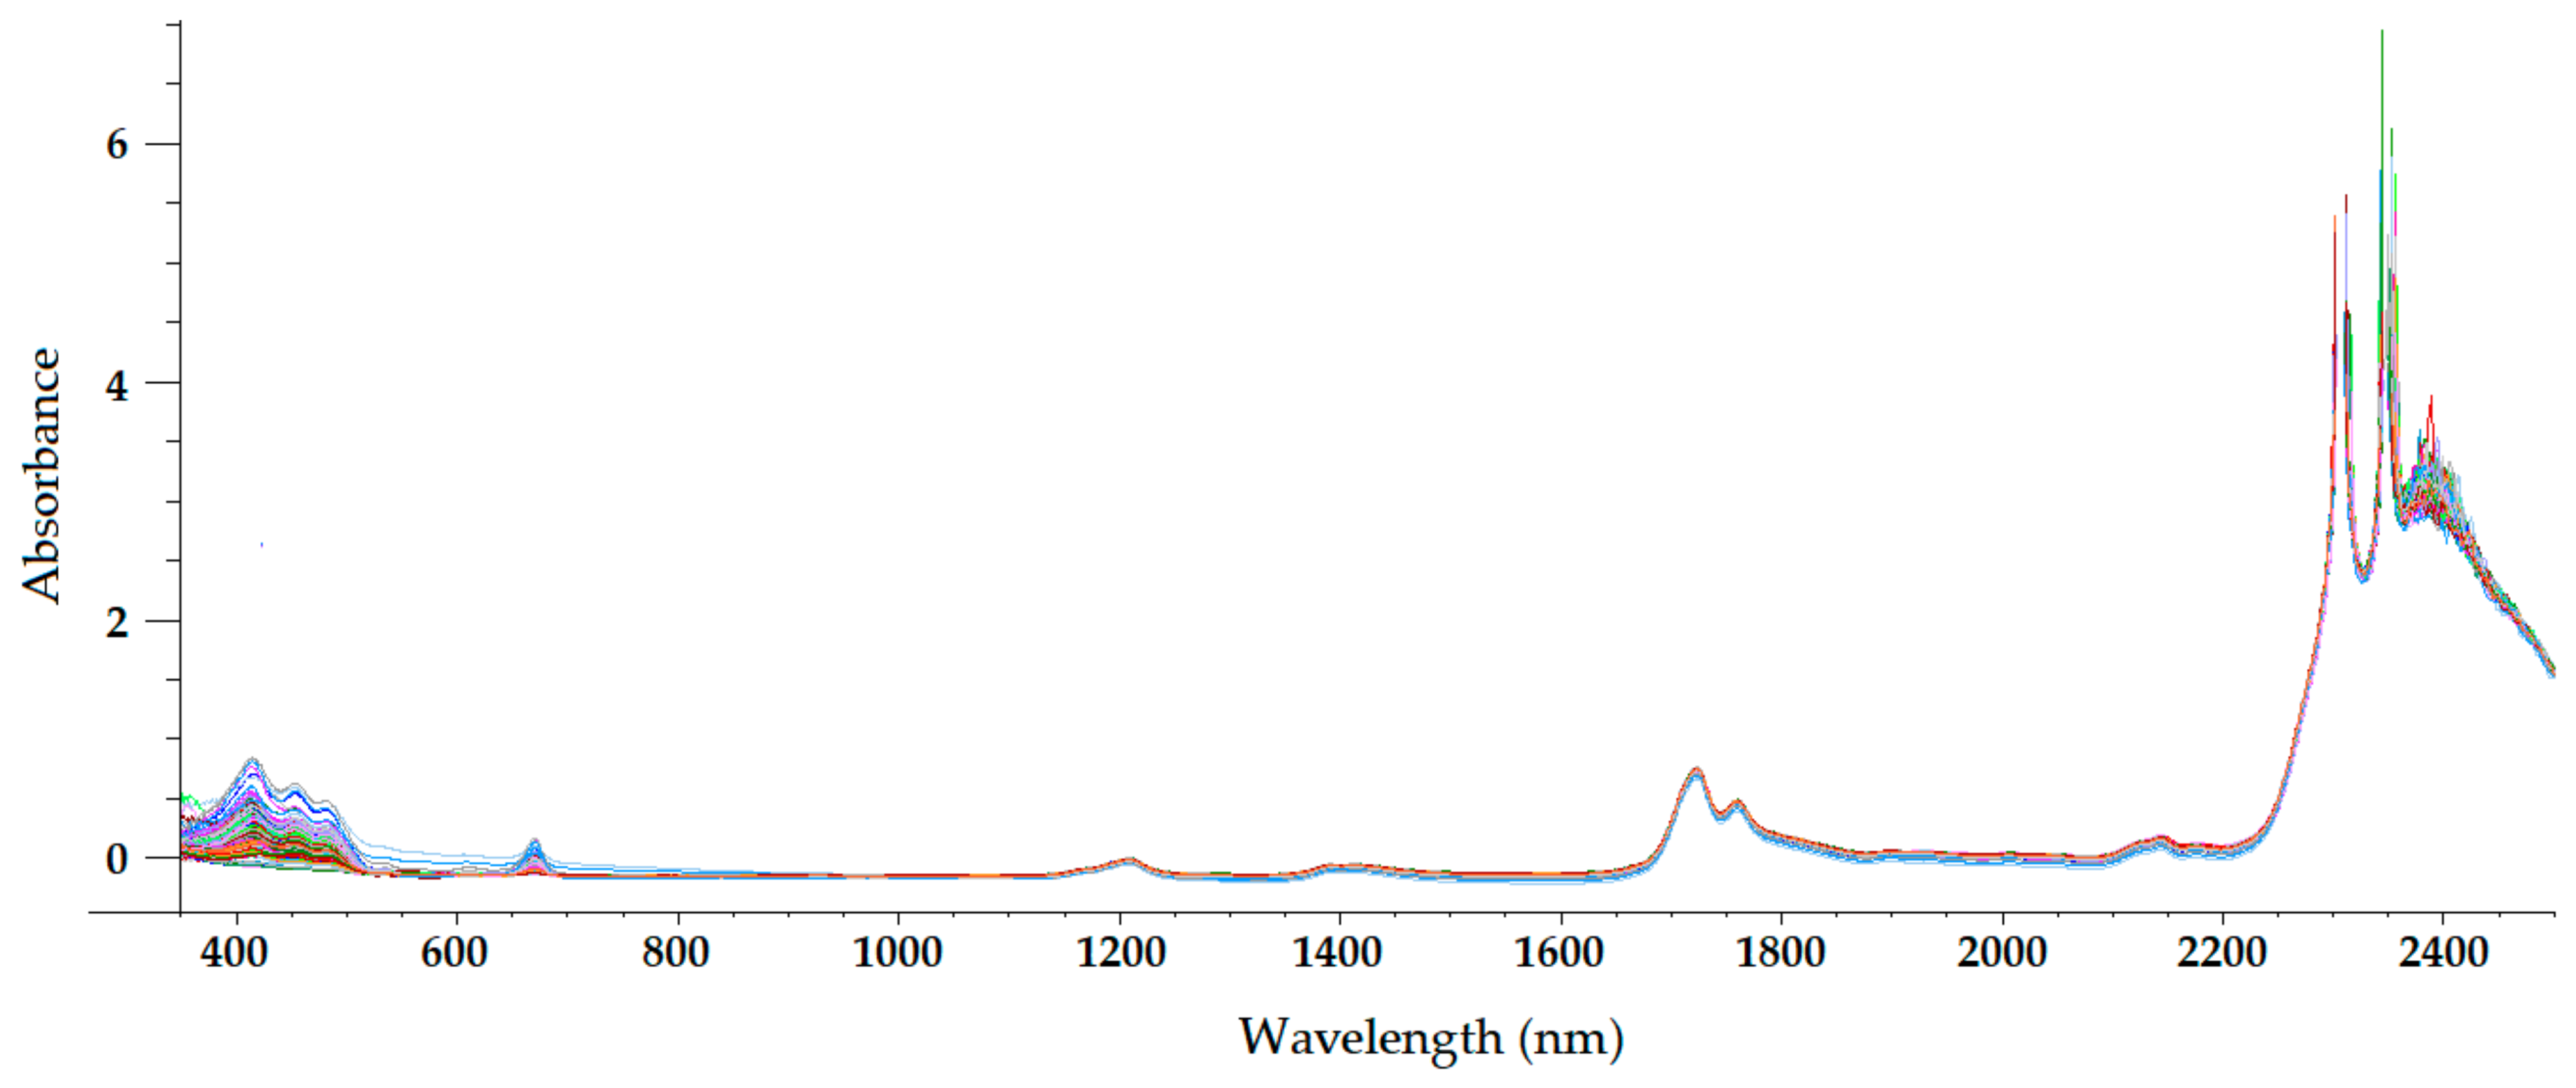
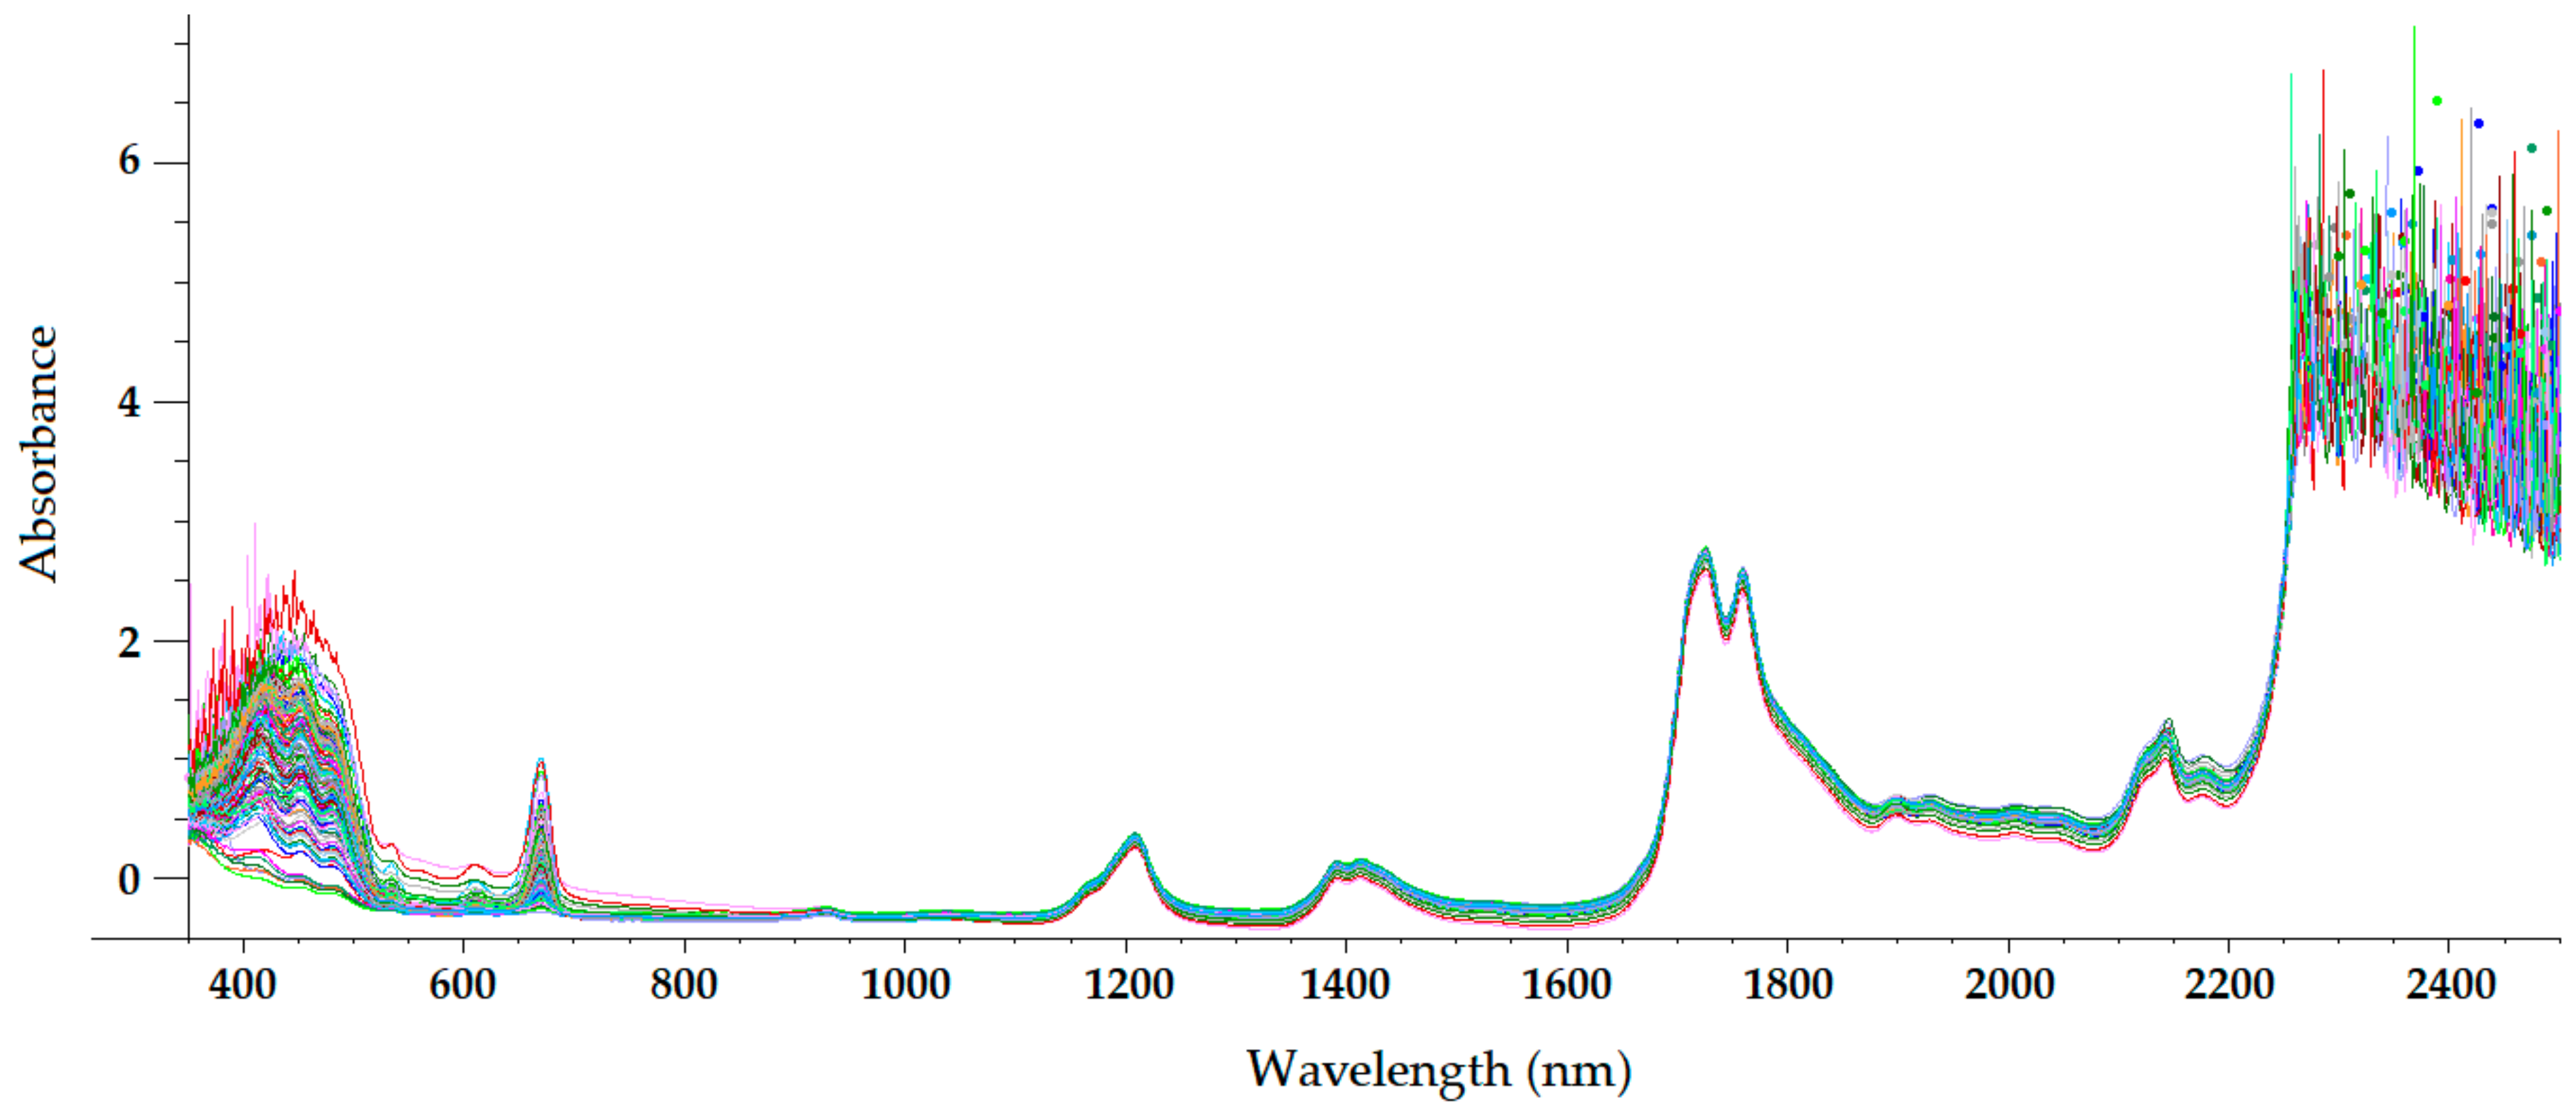
Figure 5 show the visible-NIR spectra of 127 olive oils from the variety ‘Picual’ acquired using a Labspec Pro 350-2500P visible/NIR spectrophotometer (Analytical Spectral Devices Inc., Boulder, CO, USA) equipped with three detectors and an operating in transmittance mode. This equipment was used for the spectral acquisition of olive oils in the range 350–2500 nm using quartz cuvettes with different path lengths (from 0.5 to 10 mm) as sample holders. The reflectance was transformed into absorbance. As shown in these figures, the use of cuvettes with higher path lengths for spectral acquisition leads to higher absorbance in the NIR region, thus providing smoother NIR spectra that are more suitable for further building mathematical models for the determination of quality parameters [21]. In this sense, small differences in path length (0.2 and 0.5 mm) when acquiring the spectra of South African EVOO in the transflectance mode with quartz cuvettes as sample holders have been reported not to have a significant effect on regression model performance [9].

6 show the visible-NIR spectra of 127 olive oils from the variety ‘Picual’ acquired using a Labspec Pro 350-2500P visible/NIR spectrophotometer (Analytical Spectral Devices Inc., Boulder, CO, USA) equipped with three detectors and an operating in transmittance mode. This equipment was used for the spectral acquisition of olive oils in the range 350–2500 nm using quartz cuvettes with different path lengths (from 0.5 to 10 mm) as sample holders. The reflectance was transformed into absorbance. As shown in these figures, the use of cuvettes with higher path lengths for spectral acquisition leads to higher absorbance in the NIR region, thus providing smoother NIR spectra that are more suitable for further building mathematical models for the determination of quality parameters [22]. In this sense, small differences in path length (0.2 and 0.5 mm) when acquiring the spectra of South African EVOO in the transflectance mode with quartz cuvettes as sample holders have been reported not to have a significant effect on regression model performance [9].
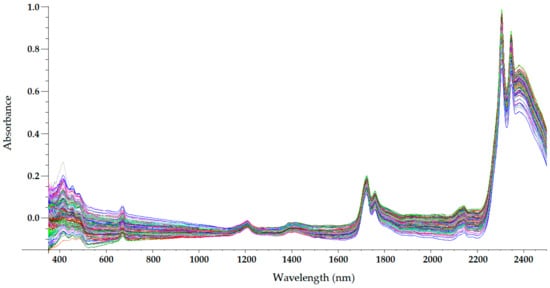
Figure 2. Mean-normalized visible/NIR spectra of 127 olive oils obtained with 0.5-mm path-length quartz cuvette [21].
Mean-normalized visible/NIR spectra of 127 olive oils obtained with 0.5-mm path-length quartz cuvette [22].
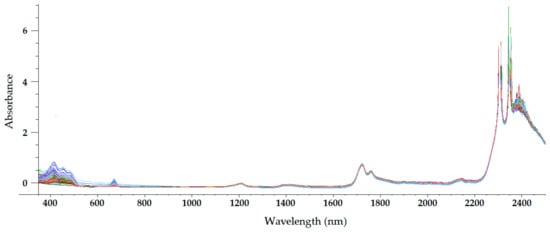
Figure 3. Mean-normalized visible/NIR spectra of 127 olive oils obtained with 2-mm path-length quartz cuvette [21].
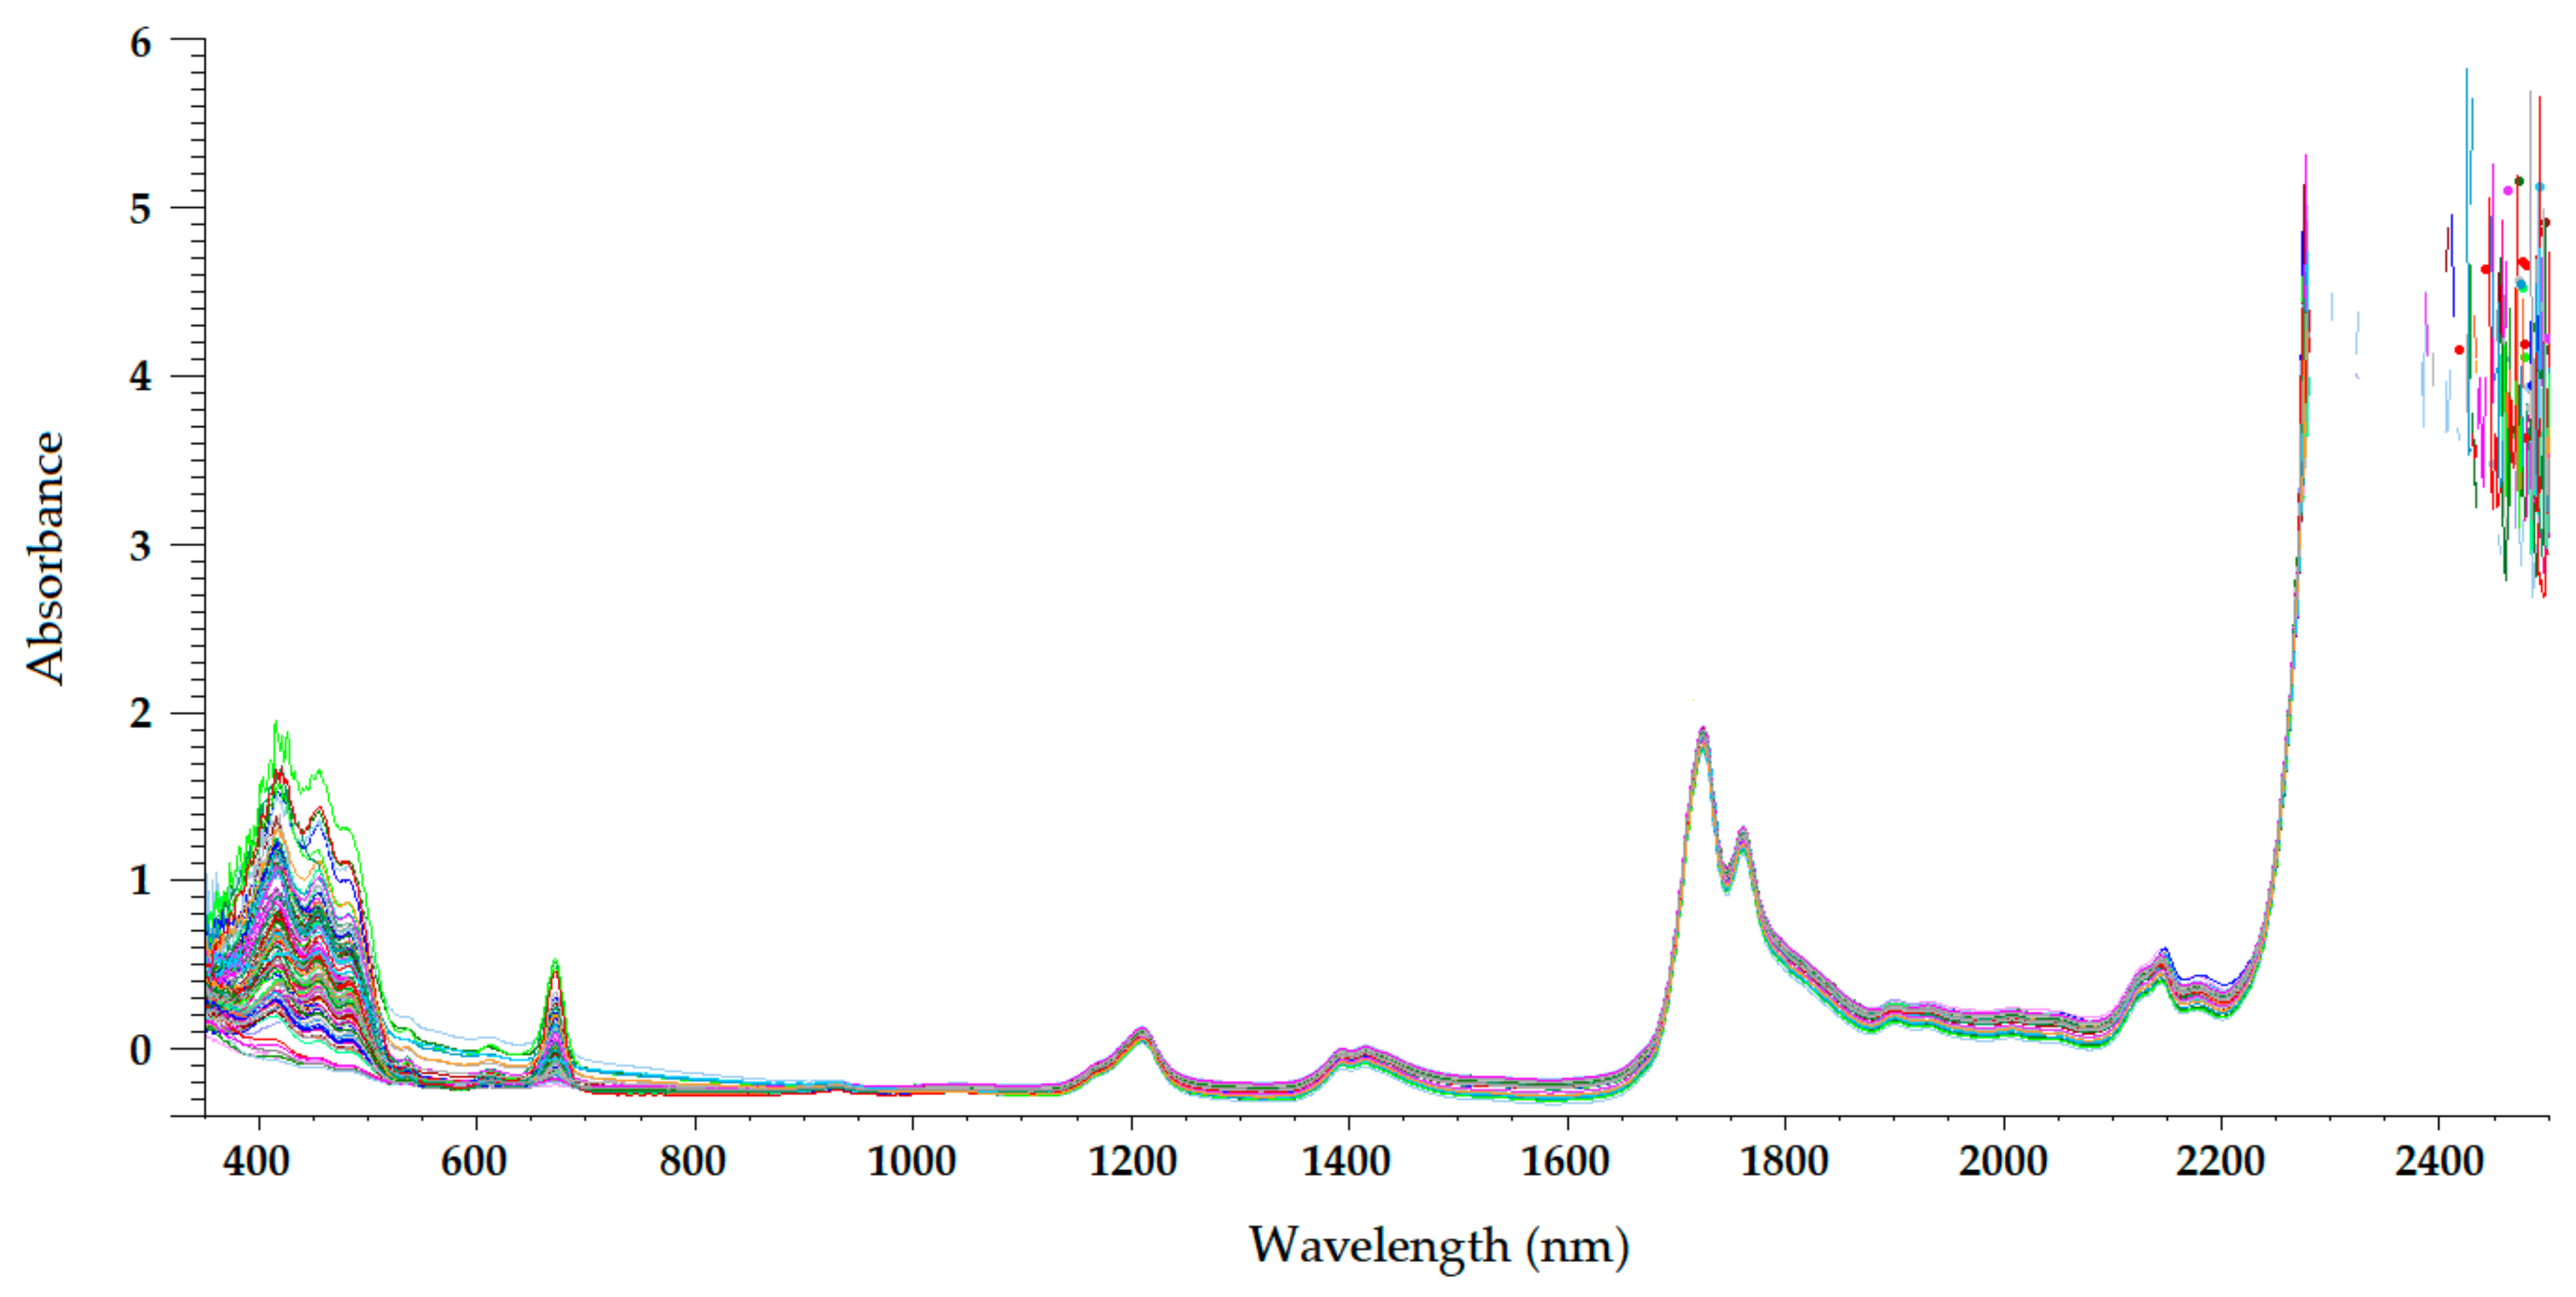
Mean-normalized visible/NIR spectra of 127 olive oils obtained with 2-mm path-length quartz cuvette [22].
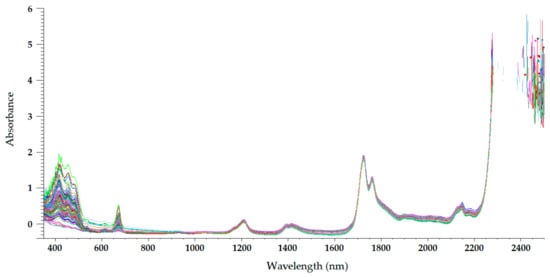
Figure 4. Mean-normalized visible/NIR spectra of 127 olive oils obtained with 5-mm path-length quartz cuvettes [21].
Mean-normalized visible/NIR spectra of 127 olive oils obtained with 5-mm path-length quartz cuvettes [22].
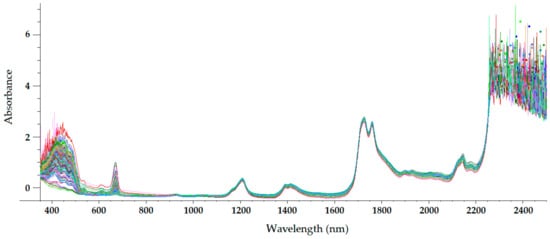
Figure 5. Mean-normalized visible/NIR spectra of 127 olive oils obtained with 10-mm path-length quartz cuvette [21].
Mean-normalized visible/NIR spectra of 127 olive oils obtained with 10-mm path-length quartz cuvette [22].
The NIR spectrum of olive oil has previously been described in the literature by various authors [21,22,27,29,30]. In fact, the NIR spectrum of olive oil is quite similar to that of triglycerides, as olive oil is mainly composed of triglycerides [31]. What is more, as triolein is the main triglyceride and therefore the major component of olive oil, the highest absorption band in the NIR spectrum of olive oil is the same as that of the triolein spectrum, which is observed at 1725 nm [29]. The two regions of the NIR spectrum that are of great importance [31] can be clearly observed in
Figure 2
,
Figure 3
,
Figure 4
and
Figure 5. One is the absorption band near 1720 nm, which is related to the first overtone of the C-H vibration of several chemical groups such as –CH3, –CH2 and =CH2, and the other is the absorption peaks at 1660 and 2145 nm, which are related to the C-H vibration of cis-unsaturation. When the degree of cis-unsaturation increases, the absorption peak at 1725 nm (cis-C18:l) shifts to lower wavelengths, i.e., to 1717 nm and 1712 nm for cis-C18:2 and cis-C18:3, respectively [30]. The high adsorption peak at 2145 nm makes the main peaks related to saturated and trans fatty acids, usually observed at 2128 and 2131 nm, respectively, hardly noticeable in the olive oil spectrum [28]. Wavelengths close to 1800 nm have also been related to the saturated fatty acids [28]. Finally, a broad absorbance band can be observed at 1210 nm as a result of second overtones of C–H and CH=CH– stretching vibrations [26].
Besides the bands and peaks corresponding to molecules that compose the fatty acids of the olive oil, a broad band at 1400 nm and a broader one at around 1950 nm are also observed in these figures. These bands have been related to the presence of water, to be specific to its first overtone, and to a combination band, respectively [24].
As observed in
. One is the absorption band near 1720 nm, which is related to the first overtone of the C-H vibration of several chemical groups such as –CH3, –CH2 and =CH2, and the other is the absorption peaks at 1660 and 2145 nm, which are related to the C-H vibration of cis-unsaturation. When the degree of cis-unsaturation increases, the absorption peak at 1725 nm (cis-C18:l) shifts to lower wavelengths, i.e., to 1717 nm and 1712 nm for cis-C18:2 and cis-C18:3, respectively [31]. The high adsorption peak at 2145 nm makes the main peaks related to saturated and trans fatty acids, usually observed at 2128 and 2131 nm, respectively, hardly noticeable in the olive oil spectrum [29]. Wavelengths close to 1800 nm have also been related to the saturated fatty acids [29]. Finally, a broad absorbance band can be observed at 1210 nm as a result of second overtones of C–H and CH=CH– stretching vibrations [27].
Besides the bands and peaks corresponding to molecules that compose the fatty acids of the olive oil, a broad band at 1400 nm and a broader one at around 1950 nm are also observed in these figures. These bands have been related to the presence of water, to be specific to its first overtone, and to a combination band, respectively [25].
As observed in
Figure 2
,
Figure 3
,
Figure 4
and
Figure 5, the absorbance in the 2300–2500 nm region is out of the range of the detector used (a holographic fast scanner InGaAs detector, cooled at 25 °C, and coupled with a high-order blocking filter) when increasing the path length of the cuvette (lower radiation transmission and therefore higher absorbance by the olive oil). This problem has also been reported when disposable borosilicate vials were used for the spectral acquisition of olive oil between 400 and 2500 nm in the transmittance mode [31]. This problem was attributed to the high absorbance of this material. For this reason, quartz cuvettes are the most used and appropriate sample holders for NIRS, since quartz does not absorb radiation in the NIR region [20]. However, since neither of the two regions of major importance in the NIR spectrum of olive oil falls in this region, the absorbance at wavelengths between 2200 and 2500 nm can be discarded when working with olive oil NIR spectra without losing important information on the sample.
Regarding the visible spectrum, it is sometimes used together with the NIR spectrum for the determination of olive oil’s quality parameters. There are three main absorption peaks of olive oil in the visible spectrum. The first is found at 415 nm (dark blue coloured light) and is related to carotenoids, pheophytin a, pheophorbide a, and pyropheophytin a [32]. The second absorption peak can be observed at 450 nm (blue light), which is characteristic of carotenoids [32]. The third absorption peak is found at 670 nm, and is related to chlorophylls [26]. It is worth noting that the two former peaks (between 350 and 500 nm) were easier to differentiate with the 0.5-mm and 2-mm quartz cuvettes (
, the absorbance in the 2300–2500 nm region is out of the range of the detector used (a holographic fast scanner InGaAs detector, cooled at 25 °C, and coupled with a high-order blocking filter) when increasing the path length of the cuvette (lower radiation transmission and therefore higher absorbance by the olive oil). This problem has also been reported when disposable borosilicate vials were used for the spectral acquisition of olive oil between 400 and 2500 nm in the transmittance mode [32]. This problem was attributed to the high absorbance of this material. For this reason, quartz cuvettes are the most used and appropriate sample holders for NIRS, since quartz does not absorb radiation in the NIR region [21]. However, since neither of the two regions of major importance in the NIR spectrum of olive oil falls in this region, the absorbance at wavelengths between 2200 and 2500 nm can be discarded when working with olive oil NIR spectra without losing important information on the sample.
Regarding the visible spectrum, it is sometimes used together with the NIR spectrum for the determination of olive oil’s quality parameters. There are three main absorption peaks of olive oil in the visible spectrum. The first is found at 415 nm (dark blue coloured light) and is related to carotenoids, pheophytin a, pheophorbide a, and pyropheophytin a [33]. The second absorption peak can be observed at 450 nm (blue light), which is characteristic of carotenoids [33]. The third absorption peak is found at 670 nm, and is related to chlorophylls [27]. It is worth noting that the two former peaks (between 350 and 500 nm) were easier to differentiate with the 0.5-mm and 2-mm quartz cuvettes (
Figure 2
and
Figure 3
, respectively) than with the 5-mm path-length cuvette (
Figure 4
). They could not be clearly distinguished using the 10-mm path-length cuvette (
Figure 5), which could indicate that increasing the path length when working in the transmittance mode reduces the quality of the visible spectrum of olive oil. This is contrary to what was found in the NIR spectrum.
The features of the visible and NIR spectra of olive oil have been exploited in different ways. For example, the absorbances in the 470–690 nm, 1145–1265 nm, and 1355–1500 nm visible/NIR ranges have been related to olive pomace oil, so these spectral ranges have been used to determine the amount of olive pomace adulterating EVOO with a low standard error of prediction (SEP = 3.27 wt.%) [5]. Besides, two minor carbonyl absorptions at 1894 and 1930 nm have been used to assess the authenticity of EVOO based on the ratio of absorption intensity at these wavelengths, which are related to the loss of volatiles from EVOO, and therefore to the loss of quality of olive oils [11]. On the other hand, the use of wavelengths in which the absorption of NIR radiation is related to the structure of fatty acids (aliphatic chains), and therefore responsible for the free acidity of olive oil, resulted in more reliable mathematical models for the determination of free acidity in edible olive oils [21].
), which could indicate that increasing the path length when working in the transmittance mode reduces the quality of the visible spectrum of olive oil. This is contrary to what was found in the NIR spectrum.
The features of the visible and NIR spectra of olive oil have been exploited in different ways. For example, the absorbances in the 470–690 nm, 1145–1265 nm, and 1355–1500 nm visible/NIR ranges have been related to olive pomace oil, so these spectral ranges have been used to determine the amount of olive pomace adulterating EVOO with a low standard error of prediction (SEP = 3.27 wt.%) [5]. Besides, two minor carbonyl absorptions at 1894 and 1930 nm have been used to assess the authenticity of EVOO based on the ratio of absorption intensity at these wavelengths, which are related to the loss of volatiles from EVOO, and therefore to the loss of quality of olive oils [11]. On the other hand, the use of wavelengths in which the absorption of NIR radiation is related to the structure of fatty acids (aliphatic chains), and therefore responsible for the free acidity of olive oil, resulted in more reliable mathematical models for the determination of free acidity in edible olive oils [22].