Your browser does not fully support modern features. Please upgrade for a smoother experience.
Please note this is a comparison between Version 2 by Dean Liu and Version 1 by Johanna Heugenhauser.
In order to compare responses to different therapies among clinical trials and to differentiate between therapy-induced changes and true tumor progression, reliable response parameters are crucial.
MRI scans were evaluated using MacDonald, RANO, Vol-RANO, mRANO, Vol-mRANO and iRANO criteria. Tumor volumes (T1 contrast-enhancing as well as T2/FLAIR volumes) were calculated by semiautomatic segmentation.
- radiologic response criteria
- immunotherapy
- glioblastoma
1. Introduction
Glioblastoma (GB) is the most frequent primary brain tumor in adults [1,2][1][2]. Despite multimodal treatment, life expectancy is still poor [3,4,5][3][4][5]. Considering the enormous progress in cancer immunotherapy during the past few years, a number of new immunologic treatment approaches, including personalized cell vaccines, are currently under investigation for GB. Unfortunately, no significant improvement in overall survival (OS) or progression-free survival (PFS) has been observed so far [6,7,8,9,10,11,12,13,14][6][7][8][9][10][11][12][13][14]. To compare the treatment responses between different therapies among clinical trials and to differentiate between therapy-induced changes and true tumor progression, reliable response parameters are crucial. Magnetic resonance imaging (MRI) is the gold standard for evaluating response and progression during treatment. However, different treatments, in particular radiotherapy combined with temozolomide chemotherapy as well as immunologic strategies, challenge the current imaging response criteria. Pseudoprogression (PsP), a subacute treatment-related phenomenon, results from a disruption of the blood–brain barrier and presents an increased contrast enhancement on MRI, mimicking tumor progression [15]. PsP was reported in up to 10–30% of GB patients following radiochemotherapy [16,17][16][17]. Other than that, patients treated with antiangiogenic therapies often show a decrease in contrast enhancement but without a true tumor response, also referred to as a pseudoresponse (PrP). Frequently, progression is only observable as a non-enhancing abnormality in T2-weighted or fluid-attenuated inversion recovery (FLAIR) image sequences in those patients [18].
In recent years, several radiologic assessment tools have been proposed [19]. In 1990 the MacDonald criteria were introduced, using two-dimensional tumor measurements, as well as corticosteroid use and the clinical performance of the patient for response assessment [20]. Twenty years later, the Response Assessment in Neuro-Oncology (RANO) criteria were proposed [21], utilizing T2-weighted or FLAIR image sequences to account for non-enhancing tumor components and therapy-induced MRI changes such as PsP and PrP [21,22][21][22]. To better account for the phenomenon of PsP, the modified RANO (mRANO) criteria were proposed in 2017, which require a confirmation scan to better capture the occurrence of true tumor progression or PsP in GB patients [23]. With the advent of immunotherapies, unique patterns of responses were observed during the treatment of systemic cancer. Especially within the first weeks after starting immunotherapy the appearance of new local or distant lesions or an increase in existing lesions may simply reflect an immune-mediated phenomenon rather than true tumor progression [24]. In consideration of such PsP during immunotherapy of GB, the Immunotherapy RANO (iRANO) criteria [25] were developed. Interestingly, the iRANO criteria were developed before the true incidence of PsP during immunotherapy was established, which in consecutive studies was found to range between 10–15% [26,27][26][27]. So far, only a few studies [28,29][28][29] exist, which directly compare and evaluate currently available response criteria.
2. Progression-Free Survival and Postprogression Survival
All patients had undergone gross total tumor resection. No measurable tumor mass was detected on postsurgery MRI, so the best possible response for every patient was SD. PFS differed significantly between the individual response-assessment criteria. Overall, there was a significant difference in median PFS between mRANO (8.6 months) and Vol-mRANO (8.6 months) compared to MacDonald (4.0 months), RANO (4.2 months) and Vol-RANO (5.4 months). In the Audencel subgroup, there was a significant difference in median PFS between mRANO (8.1 months) and Vol-mRANO (8.6 months) compared to MacDonald (4.2 months). In Table 31, the specific p-values and median PFS with CI for all assessment criteria are listed. Interestingly, there was no difference in PFS between SOC and SOC + Audencel using the different response-assessment criteria.Table 31. Median progression-free survival with the corresponding confidence interval for the different assessment criteria. Calculated p-values (Kruskal–Wallis test) and corrected for multiple testing (Bonferroni’s adjustment) for difference in PFS between assessment criteria.
| Response Criteria |
Median PFS, Months | 95% CI | Difference of PFS (p-Value) | ||||||||||||||||
|---|---|---|---|---|---|---|---|---|---|---|---|---|---|---|---|---|---|---|---|
| Median PPS, Months | 95% CI | Difference of PPS ( | p-Value) | MacDonald | RANO | Vol-RANO | mRANO | Vol-mRANO | iRANO | ||||||||||
| MacDonald | RANO | Vol-RANO | p-Value | HR |
|---|
Table 64. Impact of stable disease or progressive disease on median overall survival at 4- and 8-month landmark time with corresponding confidence interval.
| Response Criteria | Median OS, Months (95% CI) | |||
|---|---|---|---|---|
| mRANO | Vol-mRANO | iRANO | ||
| 95% CI | p | -Value | ||
| 4-Month Landmark | 8-Month Landmark | |||
| SD | PD | SD | PD | |
| SOC and SOC + Audencel Patients (n = 76) | ||||||||
| MacDonald | 1.30 | 0.79–2.13 | 0.310 | 2.29 | MacDonald | 4.0 | ||
| SOC and SOC + Audencel Patients (n = 76) | 1.34–3.91 | 0.002 | |||||||||||||||||||
| 20.5 (18.5–26.9) | 5.2–8.8 | - | 1.000 | 1.000 | 0.001 | 0.000 | |||||||||||||||
| 18.6 (15.8–22.8) | 23.7 (21.4–30.7) | MacDonald | - | ||||||||||||||||||
| 18.0 (15.5–20.9) | 12.0 | 11.8–15.8 | - | 1.000 | 1.000 | 0.013 | 0.001 | RANO | 1.41 | 0.86–2.33 | 0.175 | 2.04- | 1.18–3.55 | 0.011 | |||||||
| RANO | 21.5 (19.6–27.7) | 15.0 (14.8–21.8) | 24.1 (22.5–33.7) | RANO | 4.2 | 5.3–8.6 | 1.000 | - | 1.000 | 0.003 | 0.001 | ||||||||||
| 18.1 (15.9–21.0) | RANO | - | |||||||||||||||||||
| 11.4 | 11.8–15.9 | 1.000 | - | 1.000 | 0.019 | Vol-RANO | 0.002 | 1.30 | 0.78–2.15 | 0.312 | 1.81 | 1.06–3.10 | 0.031- | ||||||||
| Vol-RANO | 20.7 (19.3–27.1) | 15.0 (14.6–21.8) | 23.5 (21.8–31.4) | 17.9 (16.1–22.4) | Vol-RANO | 5.4 | 5.4–8.2 | 1.000 | 1.000 | - | 0.022 | 0.008 | |||||||||
| Vol-RANO | - | ||||||||||||||||||||
| 10.8 | 11.7–16.2 | 1.000 | 1.000 | - | 0.046 | 0.005 | - | mRANO | 1.69 | 0.96–2.96 | 0.068 | 2.57 | 1.48–4.46 | 0.001 | |||||||
| mRANO | 20.4 (19.0–25.4) | 13.6 (12.5–22.0) | 22.8 (21.4–28.6) | 13.7 (13.1–19.0) | mRANO | 8.6 | 9.1–14.0 | 0.001 | 0.003 | 0.022 | - | 1.000 | - | ||||||||
| Vol-mRANO | 8.6 | ||||||||||||||||||||
| mRANO | 8.8 | 7.8–11.2 | 0.013 | 0.019 | 0.046 | - | 1.000 | Vol-mRANO | 1.82 | 1.01–3.27 | 0.045- | 2.79 | 1.59–4.89 | 0.001 | |||||||
| Vol-mRANO | 20.6 (19.1–25.4) | 12.8 (11.2–21.5) | 23.1 (22.1–29.3) | 12.0 (12.5–17.9) | 9.7–14.9 | 0.000 | 1.000 | SOC + Audencel patients (n = 36) | |||||||||||||
| Vol-mRANO | 8.7 | 7.1–10.4 | 0.008 | 1.000 | - | 0.001 | 0.002 | 0.005 | - | 1.000 | - | - | |||||||||
| iRANO | 2.07 | 0.98–4.37 | 0.057 | 1.20 | 0.88–4.53 | 0.098 | SOC + Audencel patients (n | ||||||||||||||
| iRANO | 21.7 (19.1–31.0) | 12.7 (11.0–20.9) | 23.4 (19.2–40.5) | 17.3 (15.0–22.7) | = 36) | MacDonald | 4.2 | 4.2–10.3 | - | 1.000 | 1.000 | 0.034 | 0.020 | ||||||||
| MacDonald | 1.000 | ||||||||||||||||||||
| 15.2 | 11.9–17.2 | - | 1.000 | 1.000 | 0.030 | 0.002 | 1.000 | RANO | 4.7 | 4.6–10.6 | 1.000 | - | 1.000 | 0.105 | 0.066 | 12.3 | 1.000 | ||||
| 11.4–17.0 | 1.000 | - | 1.000 | Vol-RANO | 5.4 | 4.5–9.0 | 1.000 | 1.000 | - | 0.154 | 0.095 | 1.000 | |||||||||
| mRANO | 8.1 | 8.6–17.8 | 0.034 | 0.105 | 0.154 | - | 1.000 | ||||||||||||||
| RANO | 1.000 | ||||||||||||||||||||
| Vol-mRANO | 8.6 | 9.4–19.1 | 0.020 | 0.066 | 0.154 | 1.000 | - | 1.000 | |||||||||||||
| iRANO | 6.2 | 5.7–11.7 | 1.000 | 1.000 | 1.000 | 1.000 | 1.000 | - | |||||||||||||
PFS: progression-free survival, CI: confidence interval, SOC: standard of care, n: number of patients. Significant p-values are marked with bold characters.
The difference in PPS between the response-assessment criteria was also statistically different. In the entire cohort, there was a significant difference in median PPS between mRANO (8.8 months) and Vol-mRANO (8.7 months) compared to MacDonald (12.0 months), RANO (11.4 months) and Vol-RANO (10.8 months). In the Audencel subgroup, there was a significant difference in median PPS between Vol-mRANO (6.2 months) and mRANO (7.3 months) compared to MacDonald (15.2 months). Median PPS by Vol-mRANO (6.2 months) was also significantly shorter compared to RANO (12.3 months), Vol-RANO (12.1 months) and iRANO (13.0 months). In Table 42, the specific p-values and median PPS with CI for all assessment criteria are listed.
Table 42. Median postprogression survival with the corresponding confidence interval for the different assessment criteria. Calculated p-values (Kruskal–Wallis test) and corrected for multiple testing (Bonferroni’s adjustment) for difference in PPS between assessment criteria.
| Response Criteria | ||||||||
|---|---|---|---|---|---|---|---|---|
| 0.104 | ||||||||
| 0.011 | ||||||||
| 1.000 | ||||||||
| Vol-RANO | ||||||||
| 12.1 | 11.4–18.8 | 1.000 | 1.000 | - | 0.137 | 0.015 | 1.000 | |
| mRANO | 7.3 | 6.6–11.6 | 0.030 | 0.104 | 0.137 | - | 1.000 | 0.351 |
| Vol-mRANO | 6.2 | 5.6–10.5 | 0.002 | 0.011 | 0.015 | 1.000 | - | 0.048 |
| iRANO | 13.0 | 10.6–16.2 | 1.000 | 1.000 | 1.000 | 0.351 | 0.048 | - |
PPS: postprogression survival, CI: confidence interval, SOC: standard of care, n: Number of patients. Significant p-values are marked with bold characters.
3. Progression-Free Survival and Correlation with Overall survival
The best correlation between PFS and OS was detected for Vol-mRANO (r = 0.69) and mRANO (r = 0.65, Spearman test, p < 0.0001) followed by MacDonald (r = 0.44), RANO (r = 0.45), Vol-RANO (r = 0.46) and iRANO (r = 0.50, Spearman test, p < 0.0001).4. Landmark Analysis
Response status (SD or PD) was determined for each patient at the 4- and 8-month landmark time. In total, at the 4-month landmark 75 (98.7%) patients and at the 8-month landmark 71 (93.4%) patients were included. For iRANO (n = 36), at 4 months, 35 (97.2%) patients were included; and at 8 months, 32 (88.9%) patients were included. By using Cox proportional hazard models, a correlation between progression status (PD or SD) at the specific landmark time and OS was detected. HR, p-values and their corresponding 95% CIs for the 4- and 8-month landmark time are summarized in Table 53. The highest HR for PD was observed for mRANO (HR = 2.57, p < 0.001) and Vol-mRANO (HR = 2.79, p < 0.001) at the 8-month landmark time; however, the difference between each HR for all response-assessment criteria was not significant (p = 0.46).Table 53. Hazard ratios with corresponding confidence interval for patients with progressive disease at the 4- and 8-month landmark time.
| Response Criteria | 4-Month Landmark | 8-Month Landmark | ||||
|---|---|---|---|---|---|---|
| HR | 95% CI | |||||
HR: hazard ratio, CI: confidence interval. Significant p-values are marked with bold characters.
The impact of SD or PD on median OS at the 4- and 8-month landmark was calculated and listed in Table 6. There was no significant difference between median OS, for patients with PD or SD, assessed by different response-assessment criteria. However, at the 4-month landmark time the impact of progressive disease on median OS was most distinct for mRANO, Vol-mRANO and iRANO, and at the 8-month landmark time for mRANO and Vol-mRANO. For those criteria, the greatest difference in OS between SD and PD at the specific landmark time was observed.
| MacDonald |
SD: stable disease, PD: progressive disease, OS: overall survival.
5. Non-Enhancing Abnormalities
In 16 patients (21.1%) volumetric T2/FLAIR changes (Vol-RANO), and in 13 patients (17.1%) a significant increase in T2/FLAIR changes (RANO), were seen prior to detection of a contrast-enhancing lesion on postgadolinium T1-weighted MRI scans. In those patients, T2/FLAIR changes appeared for Vol-RANO 10.5 months (median, range 1.4–39.3 months) and for RANO 9.8 months (median, range 2.0–32.6 months) prior to the T1 contrast-enhancing lesion. Moreover, 11/16 (Vol-RANO) and 8/13 (RANO) patients showed a disease progression on postgadolinium T1-weighted MRI scans later in the disease course.
In Figure 21, five follow-up MRI scans of a representative patient (VAX_0066, Audencel-arm) are displayed. In this patient, tumor progression was observed only as a non-enhancing abnormality, thus the addition of T2-weighted sequences was beneficial in this case.
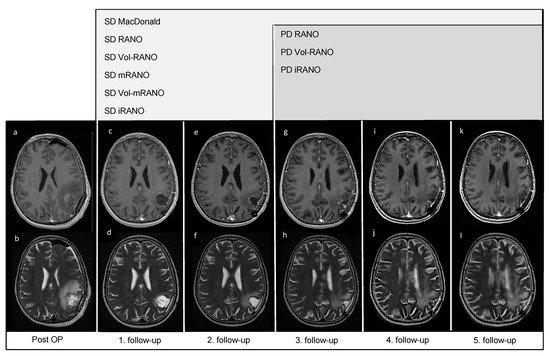
Figure 21. Post-OP and follow-up MRI scans of patient VAX_0066 (Audencel-arm): T2- (b,d,f,h,j,l) and postgadolinium T1-weighted MRI sequences (a,c,e,g,i,k) are displayed. This figure illustrates the progression of non-enhancing abnormalities. At the first follow-up MRI (c,d) non-enhancing abnormalities are decreased and no contrast-enhancing tumor mass is seen compared to post-OP (a,b) where no measurable disease is seen. Hence, the patient is defined as stable disease (SD) by all assessment criteria.Therefore, the first follow-up MRI (c,d) is used as baseline MRI, as it shows the best response. The second follow-up MRI (e,f) still shows SD compared to baseline (c,d). At the third follow-up MRI (g,h) an increase in non-enhancing abnormalities (corpus callosum, (h)) compared to T2-weighted sequence of the first follow-up (d) is seen. On the fourth- (i,j) and fifth follow-up scans (k,l), T2-changes are further increased (j,l). On T1-weighted MRI scans from first to fifth follow-up (c,e,g,i,k), no measurable contrast-enhancing tumor mass is seen, including the last T1-weighted follow-up MRI scan (k).
6. Pseudoprogression
By applying mRANO and Vol-mRANO criteria 19 (25.0%) and 23 (30.3%) patients had confirmed PsP, respectively. When iRANO was applied to patients treated with SOC + Audencel, 4 (11.1%) patients had confirmed PsP. The median OS for patients with confirmed PsP by mRANO was 23.4 months (95% CI, 19.0–31.1), for Vol-mRANO 21.2 months (95% CI, 18.1–28.7), and for patients without PsP 17.9 months (95% CI, 16.2–22.8). No significant difference in median OS between patients with confirmed PsP (mRANO and Vol-mRANO) and patients without PsP was seen.
References
- Wöhrer, A.; Waldhör, T.; Heinzl, H.; Hackl, M.; Feichtinger, J.; Gruber-Mösenbacher, U.; Kiefer, A.; Maier, H.; Motz, R.; Reiner-Concin, A.; et al. The Austrian Brain Tumour Registry: A cooperative way to establish a population-based brain tumour registry. J. Neurooncol. 2009, 95, 401–411.
- Ostrom, Q.T.; Patil, N.; Cioffi, G.; Waite, K.; Kruchko, C.; Barnholtz-Sloan, J.S. CBTRUS Statistical Report: Primary Brain and Other Central Nervous System Tumors Diagnosed in the United States in 2013–2017. Neuro Oncol. 2020, 22, iv1–iv96.
- Stupp, R.; Mason, W.P.; van den Bent, M.J.; Weller, M.; Fisher, B.; Taphoorn, M.J.; Belanger, K.; Brandes, A.A.; Marosi, C.; Bogdahn, U.; et al. Radiotherapy plus concomitant and adjuvant temozolomide for glioblastoma. N. Engl. J. Med. 2005, 352, 987–996.
- Stupp, R.; Taillibert, S.; Kanner, A.A.; Kesari, S.; Steinberg, D.M.; Toms, S.A.; Taylor, L.P.; Lieberman, F.; Silvani, A.; Fink, K.L.; et al. Maintenance Therapy With Tumor-Treating Fields Plus Temozolomide vs Temozolomide Alone for Glioblastoma: A Randomized Clinical Trial. JAMA 2015, 314, 2535–2543.
- Herrlinger, U.; Tzaridis, T.; Mack, F.; Steinbach, J.P.; Schlegel, U.; Sabel, M.; Hau, P.; Kortmann, R.D.; Krex, D.; Grauer, O.; et al. Lomustine-temozolomide combination therapy versus standard temozolomide therapy in patients with newly diagnosed glioblastoma with methylated MGMT promoter (CeTeG/NOA-09): A randomised, open-label, phase 3 trial. Lancet 2019, 393, 678–688.
- Wen, P.Y.; Weller, M.; Lee, E.Q.; Alexander, B.M.; Barnholtz-Sloan, J.S.; Barthel, F.P.; Batchelor, T.T.; Bindra, R.S.; Chang, S.M.; Chiocca, E.A.; et al. Glioblastoma in adults: A Society for Neuro-Oncology (SNO) and European Society of Neuro-Oncology (EANO) consensus review on current management and future directions. Neuro Oncol. 2020, 22, 1073–1113.
- Liau, L.M.; Ashkan, K.; Tran, D.D.; Campian, J.L.; Trusheim, J.E.; Cobbs, C.S.; Heth, J.A.; Salacz, M.; Taylor, S.; D’Andre, S.D.; et al. First results on survival from a large Phase 3 clinical trial of an autologous dendritic cell vaccine in newly diagnosed glioblastoma. J. Transl. Med. 2018, 16, 142.
- Wen, P.Y.; Reardon, D.A.; Armstrong, T.S.; Phuphanich, S.; Aiken, R.D.; Landolfi, J.C.; Curry, W.T.; Zhu, J.J.; Glantz, M.; Peereboom, D.M.; et al. A Randomized Double-Blind Placebo-Controlled Phase II Trial of Dendritic Cell Vaccine ICT-107 in Newly Diagnosed Patients with Glioblastoma. Clin. Cancer Res. 2019, 25, 5799–5807.
- Akasaki, Y.; Kikuchi, T.; Homma, S.; Koido, S.; Ohkusa, T.; Tasaki, T.; Hayashi, K.; Komita, H.; Watanabe, N.; Suzuki, Y.; et al. Phase I/II trial of combination of temozolomide chemotherapy and immunotherapy with fusions of dendritic and glioma cells in patients with glioblastoma. Cancer Immunol. Immunother. 2016, 65, 1499–1509.
- Ardon, H.; Van Gool, S.W.; Verschuere, T.; Maes, W.; Fieuws, S.; Sciot, R.; Wilms, G.; Demaerel, P.; Goffin, J.; Van Calenbergh, F.; et al. Integration of autologous dendritic cell-based immunotherapy in the standard of care treatment for patients with newly diagnosed glioblastoma: Results of the HGG-2006 phase I/II trial. Cancer Immunol. Immunother. 2012, 61, 2033–2044.
- Cao, J.X.; Zhang, X.Y.; Liu, J.L.; Li, D.; Li, J.L.; Liu, Y.S.; Wang, M.; Xu, B.L.; Wang, H.B.; Wang, Z.X. Clinical efficacy of tumor antigen-pulsed DC treatment for high-grade glioma patients: Evidence from a meta-analysis. PLoS ONE 2014, 9, e107173.
- Inogés, S.; Tejada, S.; de Cerio, A.L.; Gállego Pérez-Larraya, J.; Espinós, J.; Idoate, M.A.; Domínguez, P.D.; de Eulate, R.G.; Aristu, J.; Bendandi, M.; et al. A phase II trial of autologous dendritic cell vaccination and radiochemotherapy following fluorescence-guided surgery in newly diagnosed glioblastoma patients. J. Transl. Med. 2017, 15, 104.
- Rapp, M.; Grauer, O.M.; Kamp, M.; Sevens, N.; Zotz, N.; Sabel, M.; Sorg, R.V. A randomized controlled phase II trial of vaccination with lysate-loaded, mature dendritic cells integrated into standard radiochemotherapy of newly diagnosed glioblastoma (GlioVax): Study protocol for a randomized controlled trial. Trials 2018, 19, 293.
- Buchroithner, J.; Erhart, F.; Pichler, J.; Widhalm, G.; Preusser, M.; Stockhammer, G.; Nowosielski, M.; Iglseder, S.; Freyschlag, C.F.; Oberndorfer, S.; et al. Audencel Immunotherapy Based on Dendritic Cells Has No Effect on Overall and Progression-Free Survival in Newly Diagnosed Glioblastoma: A Phase II Randomized Trial. Cancers 2018, 10, 372.
- Hygino da Cruz, L.C., Jr.; Rodriguez, I.; Domingues, R.C.; Gasparetto, E.L.; Sorensen, A.G. Pseudoprogression and pseudoresponse: Imaging challenges in the assessment of posttreatment glioma. AJNR Am. J. Neuroradiol. 2011, 32, 1978–1985.
- Wick, W.; Chinot, O.L.; Bendszus, M.; Mason, W.; Henriksson, R.; Saran, F.; Nishikawa, R.; Revil, C.; Kerloeguen, Y.; Cloughesy, T. Evaluation of pseudoprogression rates and tumor progression patterns in a phase III trial of bevacizumab plus radiotherapy/temozolomide for newly diagnosed glioblastoma. Neuro Oncol. 2016, 18, 1434–1441.
- Sanghera, P.; Perry, J.; Sahgal, A.; Symons, S.; Aviv, R.; Morrison, M.; Lam, K.; Davey, P.; Tsao, M.N. Pseudoprogression following chemoradiotherapy for glioblastoma multiforme. Can. J. Neurol. Sci. 2010, 37, 36–42.
- Ellingson, B.M.; Chung, C.; Pope, W.B.; Boxerman, J.L.; Kaufmann, T.J. Pseudoprogression, radionecrosis, inflammation or true tumor progression? challenges associated with glioblastoma response assessment in an evolving therapeutic landscape. J. Neurooncol. 2017, 134, 495–504.
- Nowosielski, M.; Wen, P.Y. Imaging Criteria in Neuro-oncology. Semin. Neurol. 2018, 38, 24–31.
- Macdonald, D.R.; Cascino, T.L.; Schold, S.C., Jr.; Cairncross, J.G. Response criteria for phase II studies of supratentorial malignant glioma. J. Clin. Oncol. 1990, 8, 1277–1280.
- Wen, P.Y.; Macdonald, D.R.; Reardon, D.A.; Cloughesy, T.F.; Sorensen, A.G.; Galanis, E.; Degroot, J.; Wick, W.; Gilbert, M.R.; Lassman, A.B.; et al. Updated response assessment criteria for high-grade gliomas: Response assessment in neuro-oncology working group. J. Clin. Oncol. 2010, 28, 1963–1972.
- Clarke, J.L.; Chang, S. Pseudoprogression and pseudoresponse: Challenges in brain tumor imaging. Curr. Neurol. Neurosci. Rep. 2009, 9, 241–246.
- Ellingson, B.M.; Wen, P.Y.; Cloughesy, T.F. Modified Criteria for Radiographic Response Assessment in Glioblastoma Clinical Trials. Neurotherapeutics 2017, 14, 307–320.
- Wolchok, J.D.; Hoos, A.; O’Day, S.; Weber, J.S.; Hamid, O.; Lebbé, C.; Maio, M.; Binder, M.; Bohnsack, O.; Nichol, G.; et al. Guidelines for the evaluation of immune therapy activity in solid tumors: Immune-related response criteria. Clin. Cancer Res. 2009, 15, 7412–7420.
- Okada, H.; Weller, M.; Huang, R.; Finocchiaro, G.; Gilbert, M.R.; Wick, W.; Ellingson, B.M.; Hashimoto, N.; Pollack, I.F.; Brandes, A.A.; et al. Immunotherapy response assessment in neuro-oncology: A report of the RANO working group. Lancet Oncol. 2015, 16, e534–e542.
- Thomas, R.; Somarouthu, B.; Alessandrino, F.; Kurra, V.; Shinagare, A.B. Atypical Response Patterns in Patients Treated With Nivolumab. AJR Am. J. Roentgenol. 2019, 212, 6.
- Ma, Y.; Wang, Q.; Dong, Q.; Zhan, L.; Zhang, J. How to differentiate pseudoprogression from true progression in cancer patients treated with immunotherapy. Am. J. Cancer Res. 2019, 9, 1546–1553.
- Huang, R.Y.; Rahman, R.; Ballman, K.V.; Felten, S.J.; Anderson, S.K.; Ellingson, B.M.; Nayak, L.; Lee, E.Q.; Abrey, L.E.; Galanis, E.; et al. The Impact of T2/FLAIR Evaluation per RANO Criteria on Response Assessment of Recurrent Glioblastoma Patients Treated with Bevacizumab. Clin. Cancer Res. 2016, 22, 575–581.
- Ellingson, B.M.; Sampson, J.; Achrol, A.S.; Aghi, M.K.; Bankiewicz, K.; Wang, C.; Bexon, M.; Brem, S.; Brenner, A.; Chowdhary, S.; et al. Modified RANO, Immunotherapy RANO, and Standard RANO Response to Convection-Enhanced Delivery of IL4R-Targeted Immunotoxin MDNA55 in Recurrent Glioblastoma. Clin. Cancer Res. 2021, 27, 3916–3925.
More