Your browser does not fully support modern features. Please upgrade for a smoother experience.
Please note this is a comparison between Version 3 by Makrina Karaglani and Version 2 by Rita Xu.
Tissue-specific gene methylation events are key to the pathogenesis of several diseases and can be utilized for diagnosis and monitoring. By employing a data-driven approach, researchers establish specific methylation disease profiles to be applied in clinical practice and to understand human pathology.
- methylation
- machine learning
- microarrays
- model
- liquid biopsy
- diabetes
- breast cancer
- inflammation
1. Introduction
Aberrant gene methylation contributes to the pathophysiology of human diseases, such as cancer [1], autoimmune disorders [2] and diabetes [3]. The detection of alterations in DNA methylation, either on tissues or in liquid biopsies, has been involved in the initiation [4][5], progression [6][7][8] and response to the treatment of several diseases [9][10][11] and, thus, it is thought to hold valuable information for their clinical management. Genome-wide methylation analyses enable the study of a vast number of CpG sites and produce high-dimensional datasets that can be exploited for a deeper understanding of the contribution of methylation in human pathology. They also offer the opportunity to build specific biosignatures for personalized clinical solutions of clinical importance.
In parallel to the rapid accumulation of multiple high-throughput omics data, machine learning (ML) approaches have been introduced to enable their exploitation. ML uses a variety of algorithms that perform intelligent predictions and is highly applicable in biomarker discovery [12][13]. Specifically, ML applied to different type of omics datasets has been used for diagnosis or classification and prognosis in various cancers [14][15][16], neurological diseases [17], coronary artery disease [18], osteoarthritis [19] and diabetes [13]. However, developing an ML approach entails a lot of effort to select and configure the appropriate algorithm to process the data to learn from, among other things [20]. To this end, automated tools for ML (AutoML) have recently become available∙ they promise to democratize data analysis to non-experts, drastically increase productivity, improve the replicability of the statistical analysis, facilitate the interpretation of results, and shield against common methodological analysis pitfalls, such as overfitting [21]. Bioinformatic analysis combined with AutoML analysis of big omics datasets is able to extract knowledge and predictive models that can be used in personalized clinical decisions. To the best of their knowledge, only a few studies focusing on cancer have applied ML to methylation data analysis [14][15][16].
Cell-free DNA fragments circulate in the biological fluids of healthy and diseased individuals. The cellular release mechanisms of circulating cell-free DNA (ccfDNA) include apoptosis, necrosis and active release from viable cells. Recent studies have shown that multiple tissues contribute to the ccfDNA mixture of healthy individuals, while in disease, it is enriched also from pathological tissues [22][23]. ccfDNA fragments carry identical methylation footprints to their tissue of origin, serving as valuable liquid biopsy material, as they can dynamically mirror changes throughout the pathophysiological process [24]. Tracing in ccfDNA the methylation footprints of a tissue presents an unprecedented opportunity for early diagnosis and monitoring.
To tackle this major challenge in biomarker discovery, researchers established an in silico pipeline based on high-throughput microarray methylation datasets to identify disease/tissue specific methylation fingerprints. Three pathological entities of major burden, i.e., one malignancy (breast cancer, BrCa), one inflammatory (osteoarthritis, OA) and one metabolic (diabetes) were selected as use cases in the approach. Instead of the comparison, adopted in most studies, of a pathological tissue to the respective healthy one (for example breast cancer tissue vs. normal breast), here they chose to compare methylomes from a tissue or cell type related to a specific pathology to the bulk of methylomes from other healthy tissues. Differential analysis revealed specific differentially methylated genes (DMGs) which were then subjected to functional analysis to unravel epigenetically regulated pathways in each pathology. Following this, AutoML technology, specially designed for analyzing high-dimensional biological datasets, was applied to build tissue-specific methylation biosignatures, validated also in ccfDNA. Selected features were additionally studied using a text mining bioinformatic tool to reveal their biological associations.
2. Breast Cancer
2.1. Differential Methylation Analysis Comparing BrCa and Healthy Tissues
In order to identify differentially methylated genes in a comparison between BrCa tumors and healthy tissues, raw methylome data from 218 BrCa (primary and metastatic) tumors and 193 healthy tissues, including healthy breast, blood, liver, muscle, colon, gastric, lung and adipose, were subjected to analysis using RnBeads. In total, 19,248 DMGs (false discovery rate (FDR) < 0.05) emerged. Among those, 8820 were found to be hypomethylated, while 10,428 showed hypermethylation in BrCa in relation to healthy tissues. A heatmap visualization of DMGs is presented in Figure 1D. Further, DMGs were ranked based on FDR, and the 400 top-ranking genes were chosen for functional analysis. Of these 400 DMGs, 171 were hypomethylated and the remaining 229 were hypermethylated in BrCa in relation to healthy tissues.
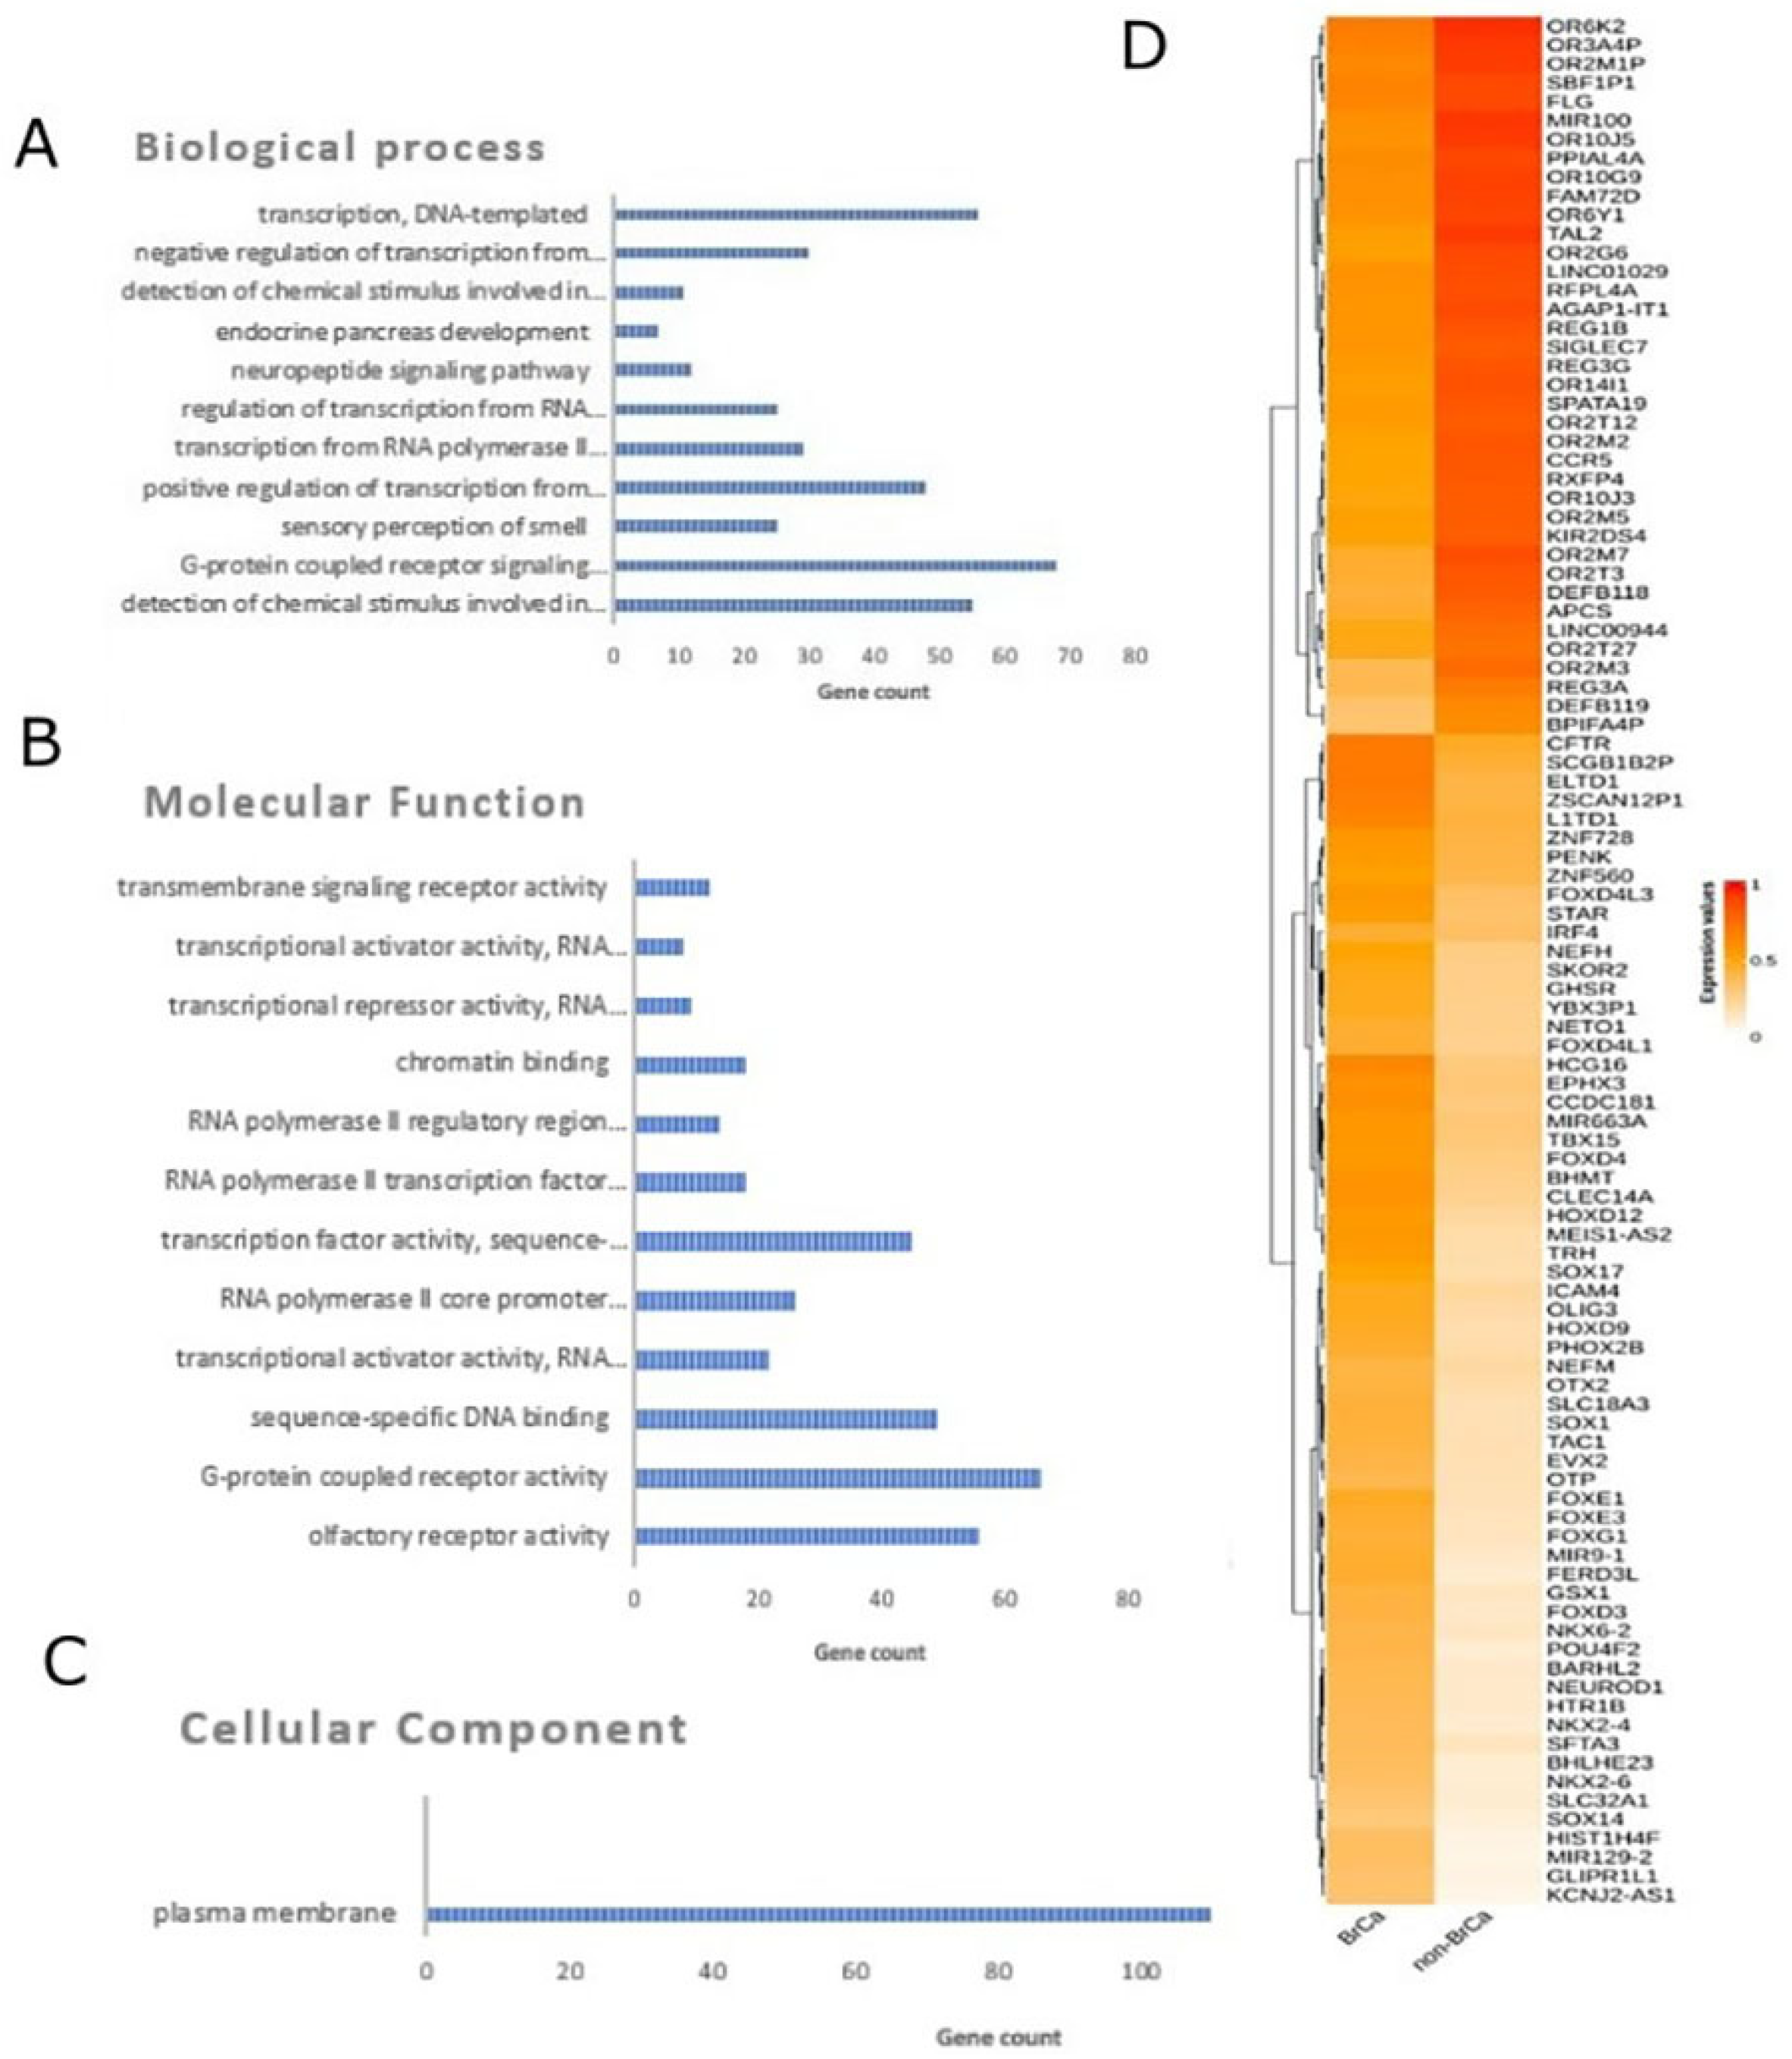
Figure 1. Differential methylation analysis comparing BrCa and healthy tissues. Gene ontology analysis of the top 400 DMGs in the aspects of (A) biological process, (B) cellular component and (C) molecular function analysis. (D) Heatmap plot of top 100 DMGs comparing BrCa and healthy tissues. Abbreviations: BrCa = breast cancer, DMGs = differentially methylated genes.
2.2. Functional Analysis of DMGs Comparing BrCa and Healthy Tissues
Gene ontology analysis was carried out using the DAVID tool (Figure 1A–C). In molecular function analysis, the most enriched functions were G-protein-coupled receptor activity, sequence-specific DNA binding, transcriptional activator activity and RNA polymerase II core promoter proximal region sequence-specific binding. In biological process enrichment analysis, DMGs were found to participate mainly in G-protein-coupled receptor signaling pathways, the positive regulation of transcription from RNA polymerase II promoter, transcription from RNA and the polymerase II promoter regulation of transcription from RNA polymerase II promoter. Finally, cellular component analysis showed mainly a plasma membrane enrichment of the studied genes. Reactome analysis via ConsensusPathDB mainly revealed enrichment in sensory perception, the genetic transcription pathway, RNA polymerase II transcription and gene expression.
2.3. BrCa-Specific Methylation Biosignature through AutoML
β-values produced by RnBeads were analyzed using JADBio in order to construct an accurate model specific for tracing BrCa. The original dataset (218 BrCa tissues and 193 healthy tissues) was automatically and randomly split into a training dataset of 151 BrCa and 131 healthy tissues and a validation dataset of 66 BrCa and 55 healthy tissues. Analysis of the training dataset of 29,703 gene array features produced one signature containing 5 features via a support vector machines (SVM) algorithm (https://app.jadbio.com/share/4fd50c38-d0a1-4f28-96c9-480b29b4a3e2, accessed on 1 October 2021). Three of them were protein-coding genes, namely, CCDC181, HIST2H3PS2 and CFTR, and two were RNA genes, namely, RUVBL1-AS1 and AL161908.1 (Table 1). All genes presented increased methylation in BrCa in relation to healthy tissues/cells. In discriminating BrCa against healthy tissues, this signature reached an area under the curve (AUC) of 0.987 (0.963–1.000) and an average precision of 0.987 (0.955–1.000) (Figure 2A). Upon validation in the test dataset, the model showed an AUC and an average precision of 0.995 (Figure 2A), verifying the model’s performance metrics. The performance and inspection results are depicted in Figure 2B–D.
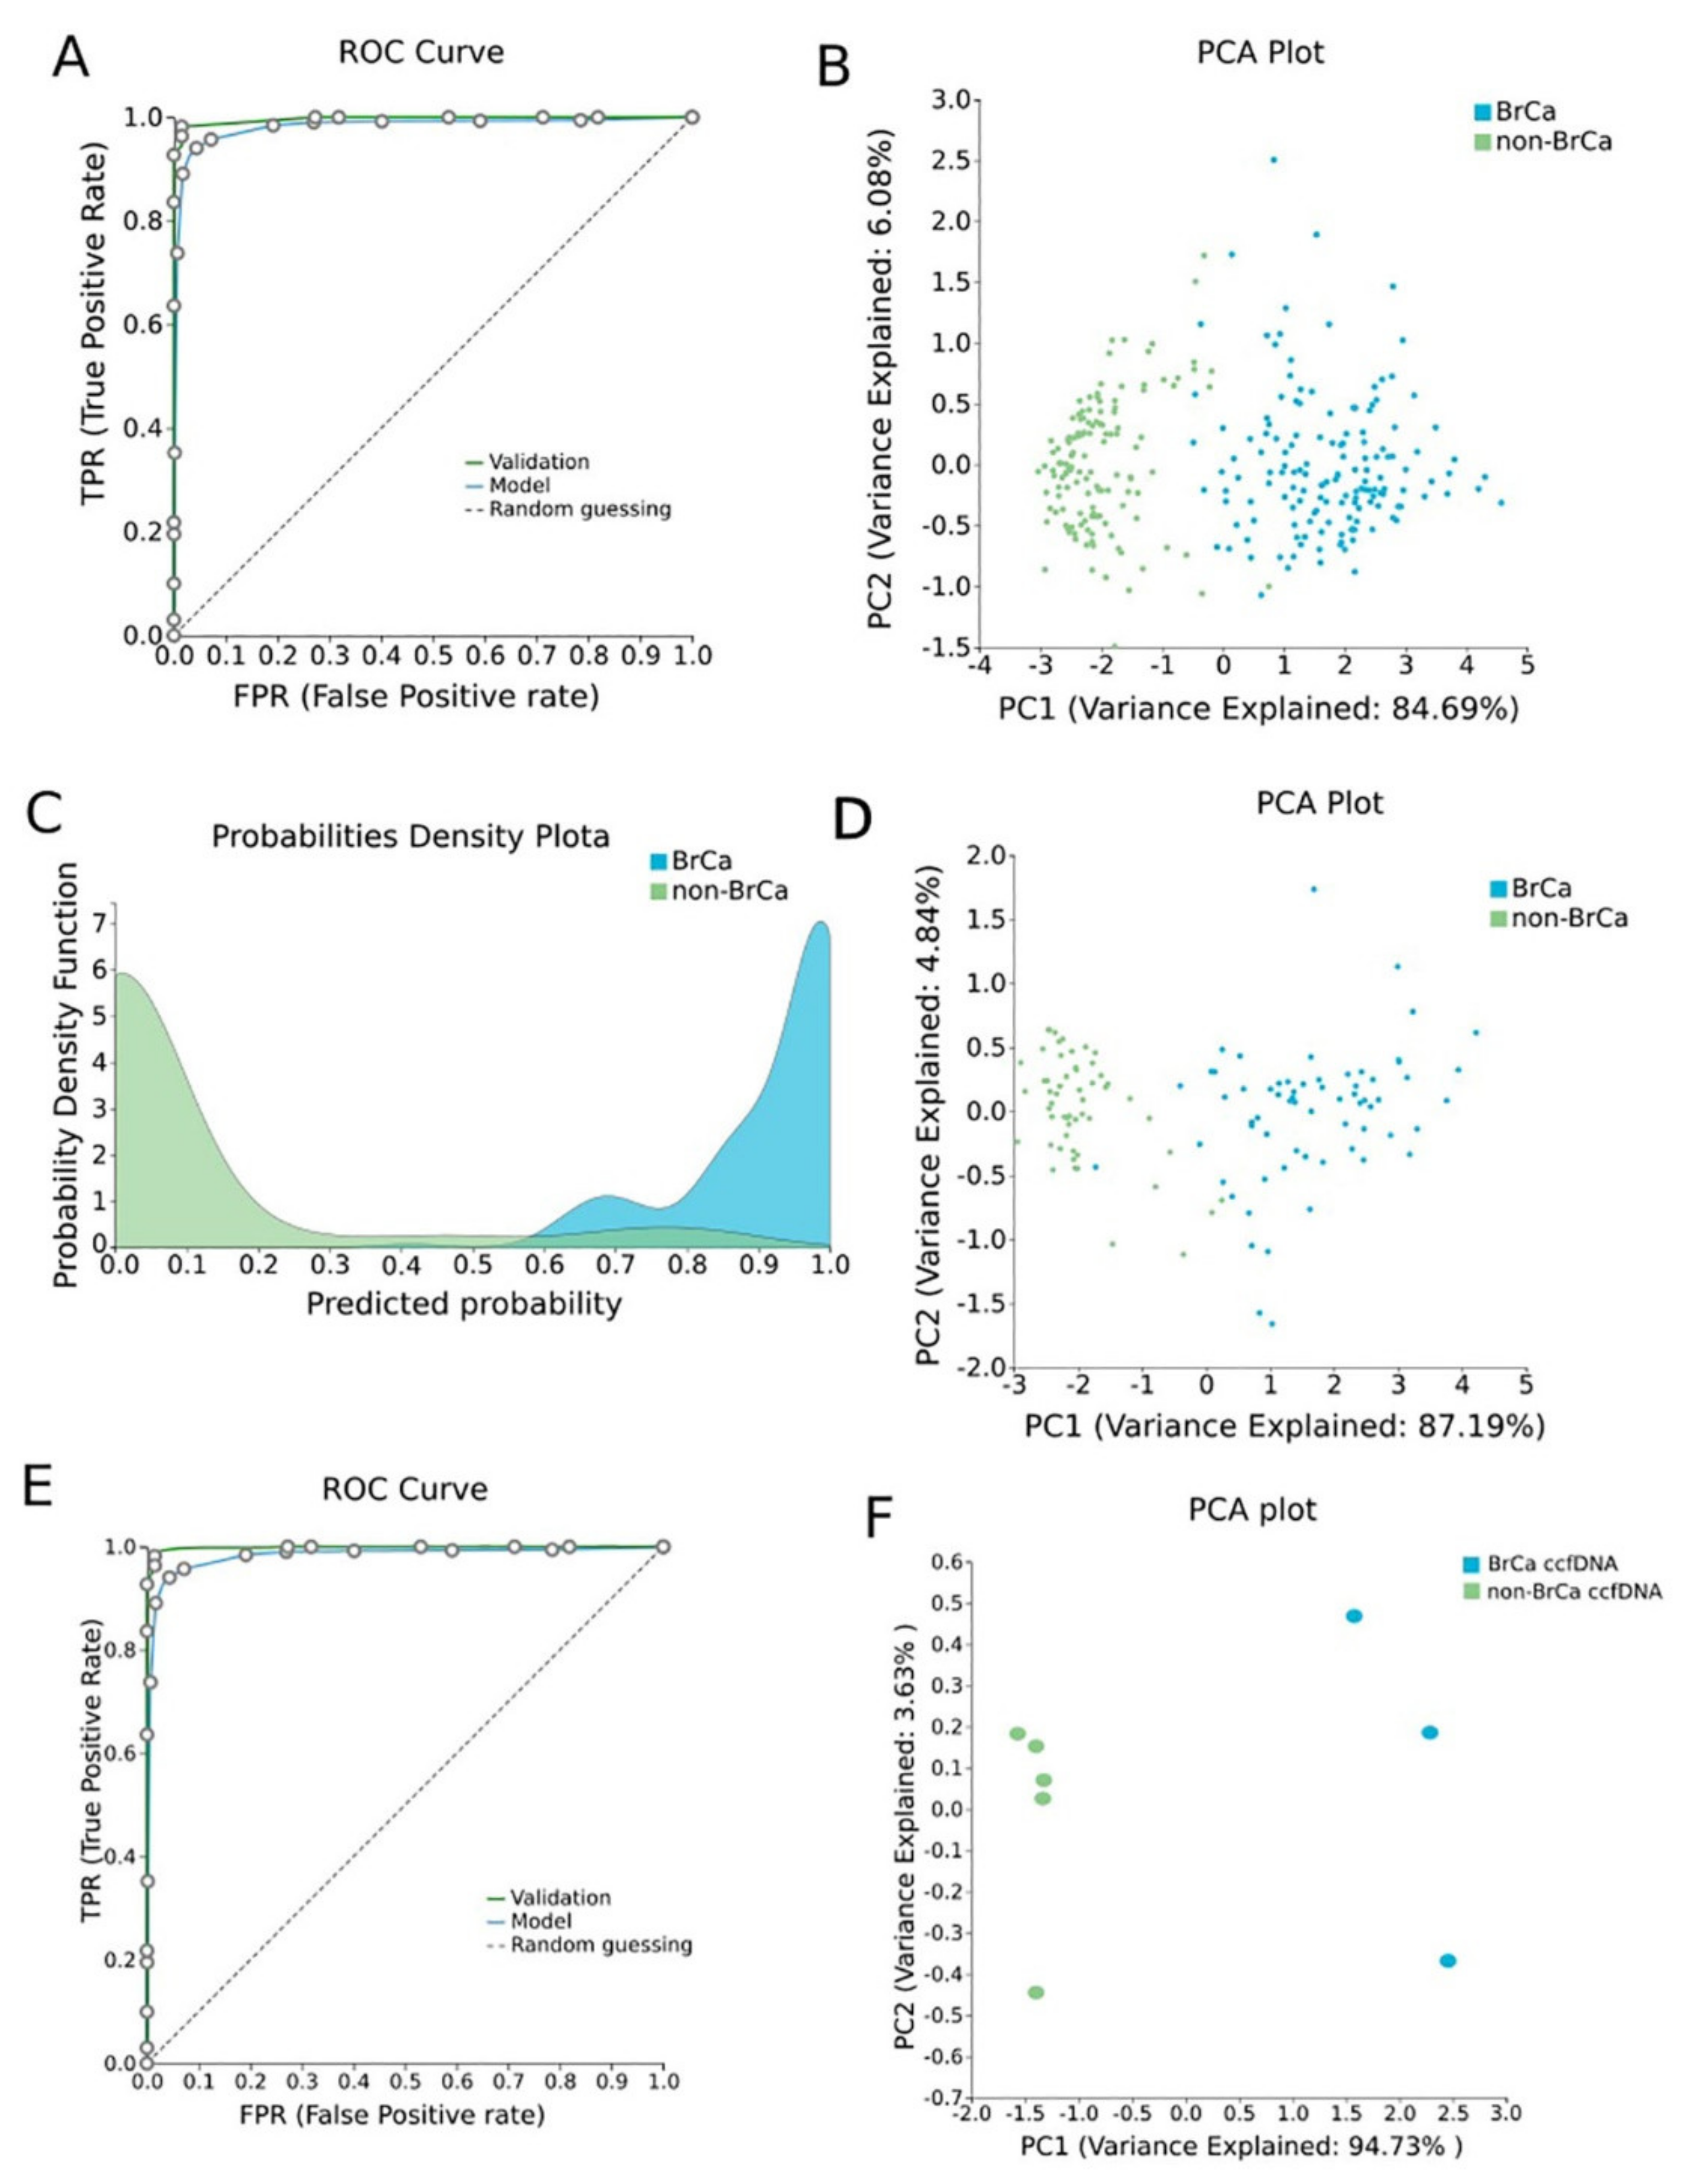
Figure 2. BrCa-specific methylation biosignature built using AutoML. (A) ROC curves of training (blue line) and validation (green line) models. (B) Supervised PCA plot (i.e., only considering the selected relevant biomarkers) presents separation between BrCa (blue) and healthy tissues (green) within the training group. (C) Out-of-sample probability density plot (i.e., probability predictions when samples were not used for training) depicts discrete distributions among studied classes of the training group. (D) PCA plot presents separation between BrCa (blue) and healthy tissues (green) within the validation group. (E) ROC curves of training (blue line) and external validation (green line) models and (F) PCA plot presents separation between BrCa ccfDNA (blue) and healthy ccfDNA (green) within the external validation group. Abbreviations: BrCa = breast cancer, ROC = receiver operating characteristic, PCA = principal component analysis.
Table 1. Differentially methylated genes selected in the BrCa-specific signature built using AutoML analysis. Their biological characteristics and functions revealed by GO analysis as well as their methylation status are described.
| Signature Genes | Gene Type | Description | Pathway | GO—Molecular Function | GO—Cellular Components | GO—Biological Process | UniReD Score | Methylation in BrCa in Relation to Healthy Tissues |
|---|---|---|---|---|---|---|---|---|
| CCDC181 | Protein Coding | Coiled-Coil Domain Containing 181 | NA | microtubule binding | manchette, cytoplasm, cytoskeleton, microtubule, cilium | NA | 5 | Hypermethylation |
| HIST2H3PS2 | Protein Coding | Histone Cluster 2, H3, Pseudogene 2 | NA | DNA binding, protein heterodimerization activity | Nucleus, Chromosome | NA | 1 | Hypermethylation |
| RUVBL1-AS1 | RNA Gene | RUVBL1 Antisense RNA 1 | NA | NA | NA | NA | NA | Hypermethylation |
| CFTR | Protein Coding | CF Transmembrane Conductance Regulator | CDK-mediated phosphorylation and removal of Cdc6, bacterial infections in CF airways, regulation of CFTR activity, salivary secretion | nucleotide binding, chloride channel activity, intracellularly ATP-gated chloride channel activity | nucleus, cytoplasm, lysosomal membrane, endsome, early endsome | cholesterol biosynthetic process, ion transport, chloride transport, vesicle docking involved in exocytes | 7 | Hypermethylation |
| AL161908.1 | RNA Gene | Novel Transcript, Antisense To LIM1B | NA | NA | NA | NA | NA | Hypermethylation |
Abbreviations: BrCa: breast cancer, AutoML: automated machine Learning, GO: gene Ontology, NA: non-available.
2.4. Validation and Applicability of BrCa-Specific Methylation Biosignature on ccfDNA
To validate the discrimination performance of the BrCa-specific five-feature biosignature on ccfDNA and its applicability to liquid biopsy, researchers applied it to an external independent dataset of three BrCa ccfDNA samples and five ccfDNA samples from age-matched healthy women. The analysis revealed the model’s AUC and an average precision of 1.000 (Figure 2E,F).
2.5. Biological Relevance of Genes Selected in the BrCa-Specific Methylation Biosignature
Feature selection performed via ML identifies a minimum subset of features bearing the maximal classifying ability between groups. In tasks such as the one addressed here, i.e., to build a tissue-specific methylation biosignature, it is interesting to know if the DMGs included in the model have an established role in the related pathophysiology as revealed by their biological characteristics. All five DMGs of the BrCa biosignature were subjected to GO analysis using the GeneCards database (Table 1). CCDC181’s molecular function is related to microtubule binding, while it is mainly found in the manchette and cytoplasm. HIST2H3PS2’s molecular function is associated with DNA binding and protein heterodimerization activity and is mainly found in nucleus and on chromosome. CFTR’s molecular function is related, among other things, to nucleotide binding and chloride channel activity, and it is located in the nucleus, cytoplasm and in other cellular components and participates in cholesterol biosynthesis, ion and chloride transport among other things. For RUVBL1-AS1 and AL161908.1, no information was found in the GeneCards database (Table 1).
Furthermore, in order to examine if the protein products of the three protein-encoding DMGs included in the BrCa-specific biosignature were somehow implicated in BrCa pathophysiology, researchers analyzed the identified genes, using a literature mining tool UniReD, which predicts functional associations between proteins. As previously [16], for this analysis, they used the following list of 10 protein-coding genes with an established role in BrCa pathophysiology, namely, BRCA1 [25], BRCA2 [25], RASSF1 [26], ESR1 [27], TP53 [28], PIK3CA [29], BRMS1 [30], CDH1 [31], CST6 [32] and PTEN [33]. All genes were found to be associated with breast cancer pathways according to the KEGG pathway identification. CFTR reached a score of 7, while CCDC181 reached a score of 5 and HIST2H3PS2 a score of 1, showing fewer known associations (Table 1).
3. Osteoarhtitis
3.1. Differential Methylation Analysis Comparing OA and Healthy Tissues
Methylomes of OA cartilage tissues were analyzed in comparison to healthy tissues, including healthy cartilages, breast, blood, liver, muscle, colon, gastric, lung and adipose. Raw data from 151 OA cartilages tissues and 216 healthy tissues were subjected to RnBeads for differential methylation analysis and 18,413 DMGs (FDR < 0.05) emerged. Among those, 12,400 DMGs were found to be hypomethylated, while 6013 were found to be hypermethylated in OA in relation to healthy tissues. A heatmap of DMGs is presented in Figure 3. Further, the 400 top-ranking DMGs based on FDR were chosen for functional analysis. Of these, 354 were hypomethylated, and the remaining 56 were hypermethylated in OA in relation to healthy tissues.
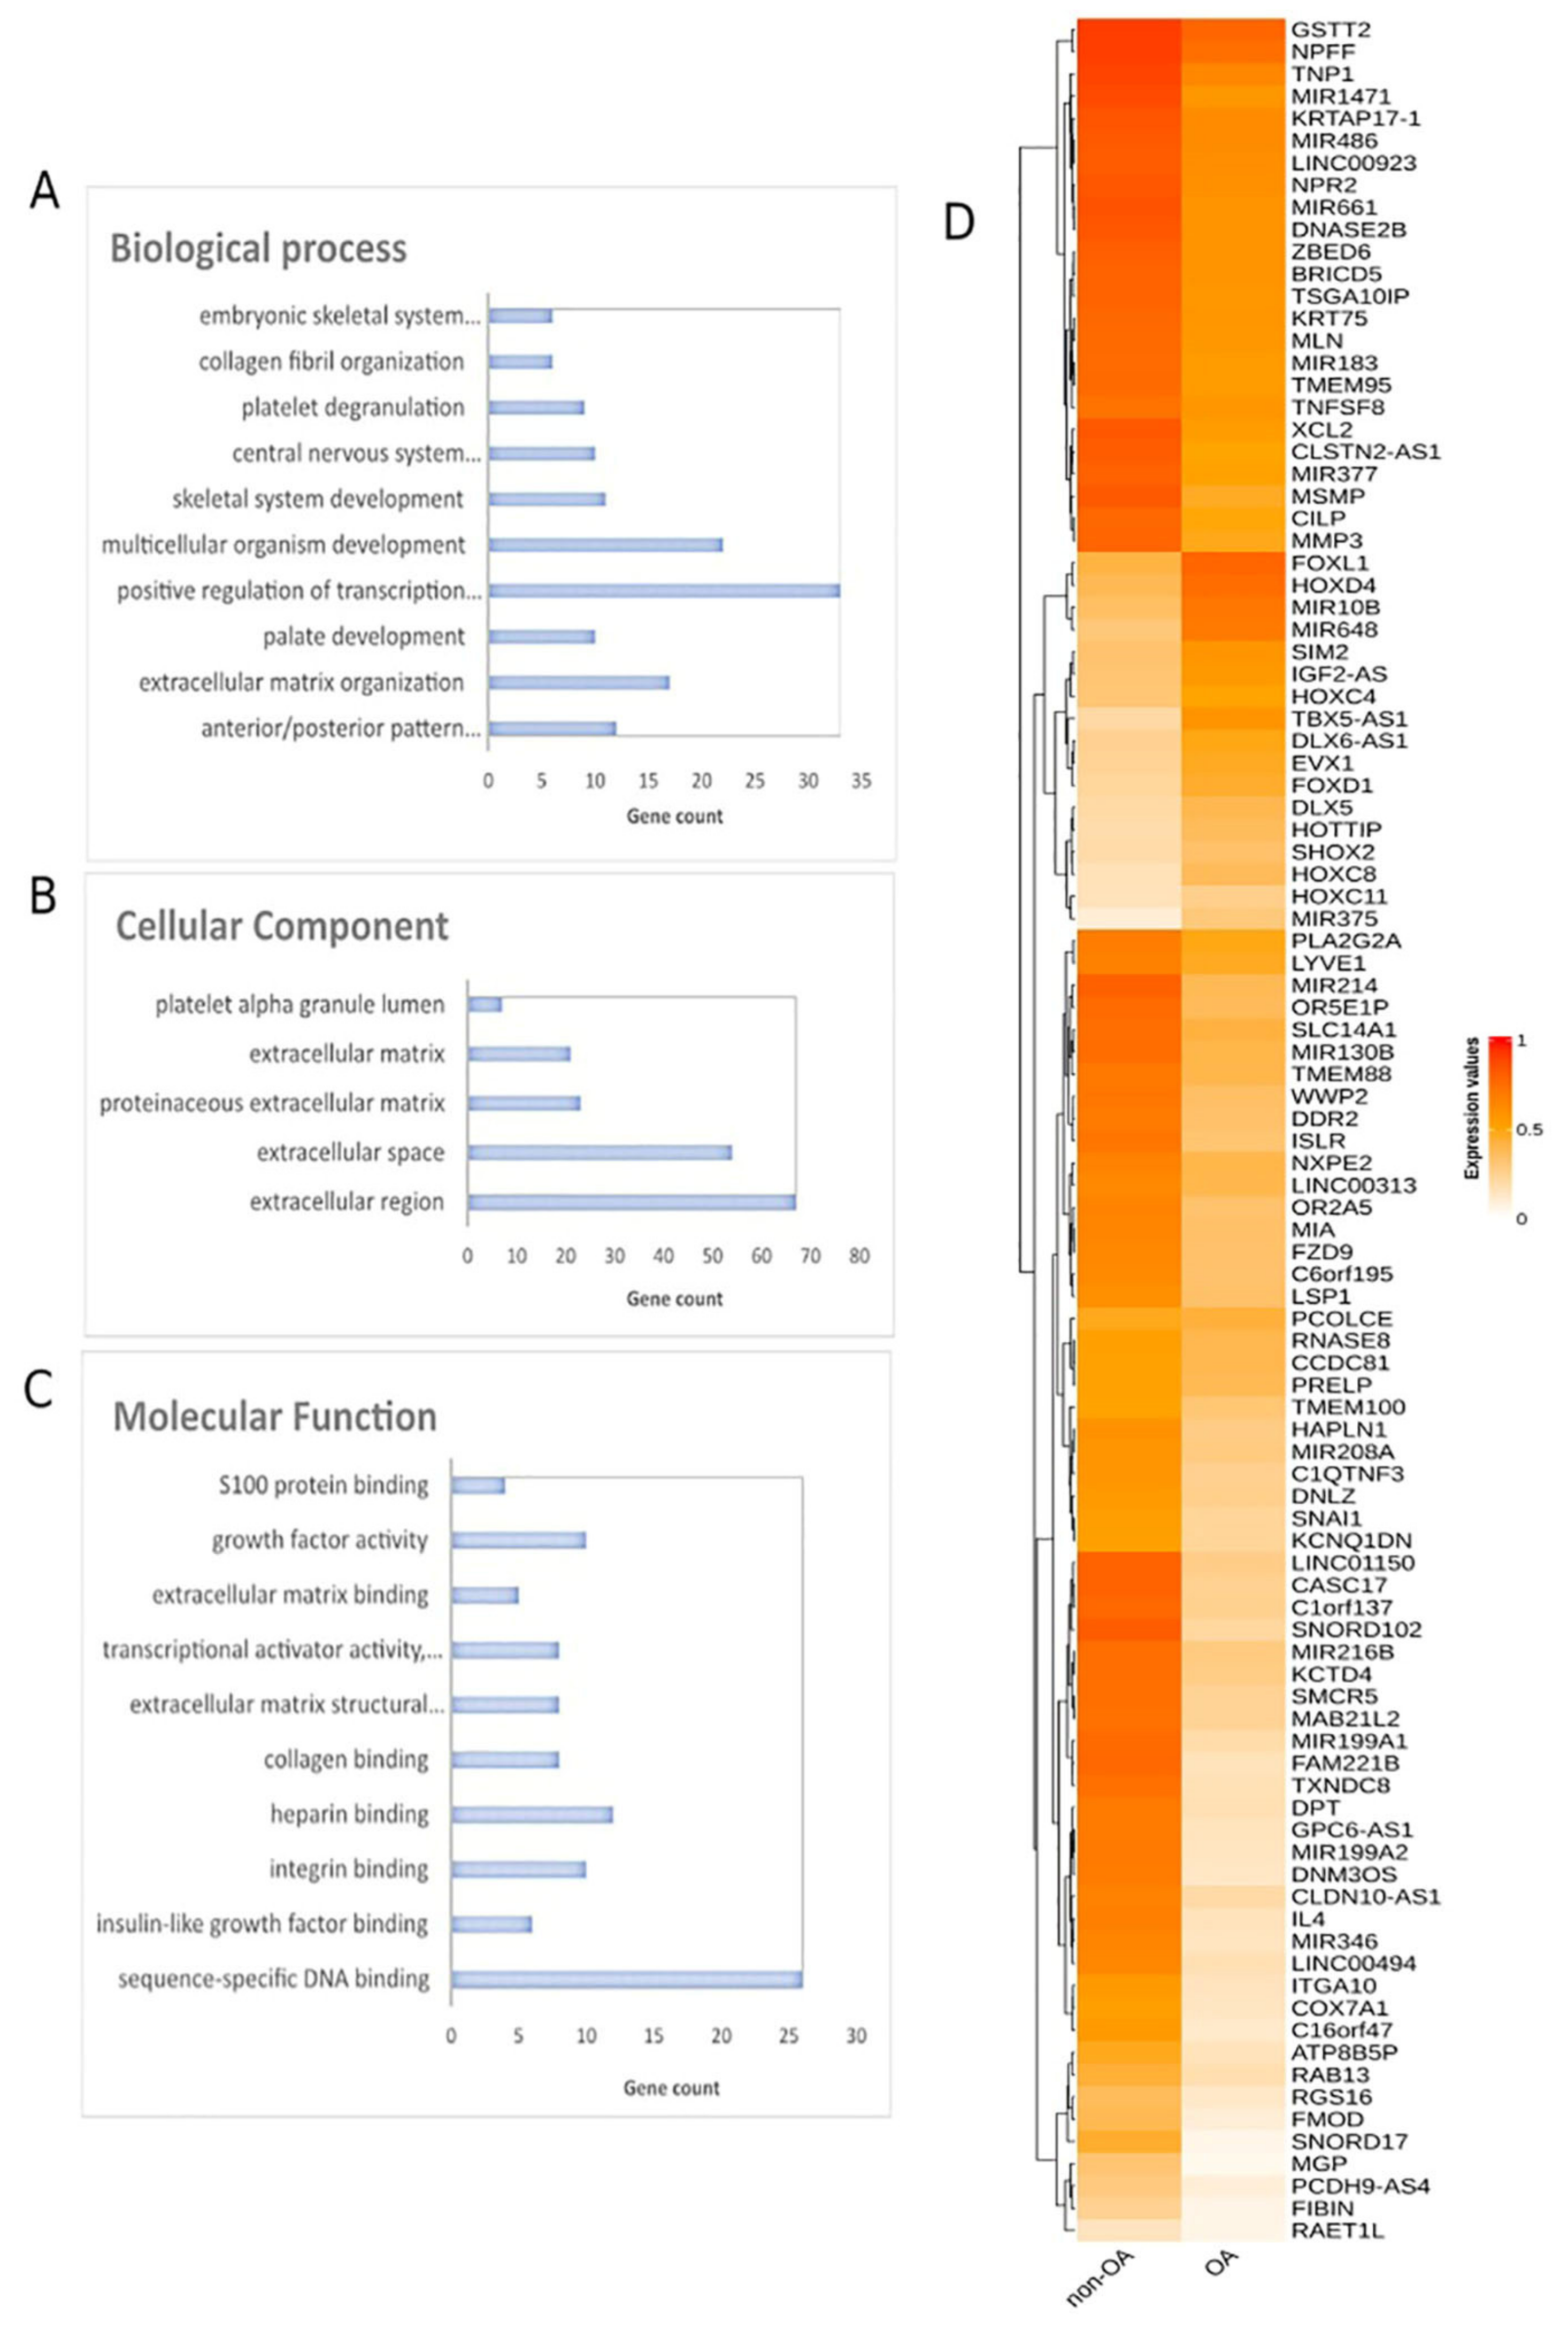
Figure 3. Differential methylation analysis comparing OA and healthy tissues. Gene ontology analysis of top 400 DMGs in the aspects of (A) biological process, (B) cellular component and (C) molecular function analysis. (D) Heatmap plot of top 100 DMGs comparing OA and healthy tissues. Abbreviations: OA = osteoarthritis, DMGs = differentially methylated genes.
3.2. Functional Analysis of DMGs Comparing OA and Healthy Tissues
Gene ontology analysis of the 400 DMGs was conducted using the DAVID tool (Figure 3A–C). Molecular function analysis showed enrichment in sequence-specific DNA binding, insulin-like growth factor binding, integrin binding, heparin binding and collagen binding. Regarding biological process enrichment analysis, DMGs were found to participate mainly in anterior/posterior pattern specification and in extracellular matrix organization. Cellular component analysis of the studied genes showed extracellular region, extracellular space, proteinaceous extracellular matrix and extracellular matrix enrichment.
3.3. OA Specific Methylation Biosignature through AutoML
In order to construct a specific model for OA, β-values were uploaded to JADBio. The original dataset (151 OA tissues and 216 healthy tissues) was automatically and randomly split into a training dataset of 108 OA and 144 healthy tissues and a validation dataset of 43 OA and 65 healthy tissues. An analysis of the training dataset of 29,585 gene array features produced three equivalent signatures containing 4 features each via a classification random forests algorithm (https://app.jadbio.com/share/2fee0023-8330-4b54-ab0c-ddbaf032b506, accessed on 1 October 2021). Two of them were protein-coding genes, namely CASD1 and STOML1, two were lncRNA genes, namely, LINC01350 and RP11-272L13.3, and one was an RNA gene, namely, CARMAL. The last was the RP11-515E23.2 gene (Table 2). Common features between models were RP11-515E23.2, LINC01350 and CASD1. All genes showed the down-regulation of methylation in OA cartilage in relation to healthy tissues. In discriminating OA against healthy tissues, signatures reached an AUC of 0.978 (0.942–1.000) and average precision of 0.986 (0.962–1.000) (Figure 4A). Upon validation, the model showed an AUC of 0.990–0.995 and an average precision of 0.994–0.997 (Figure 4A), verifying the stability and accuracy of its estimation. Performance validation and inspection are depicted in Figure 4B,C.
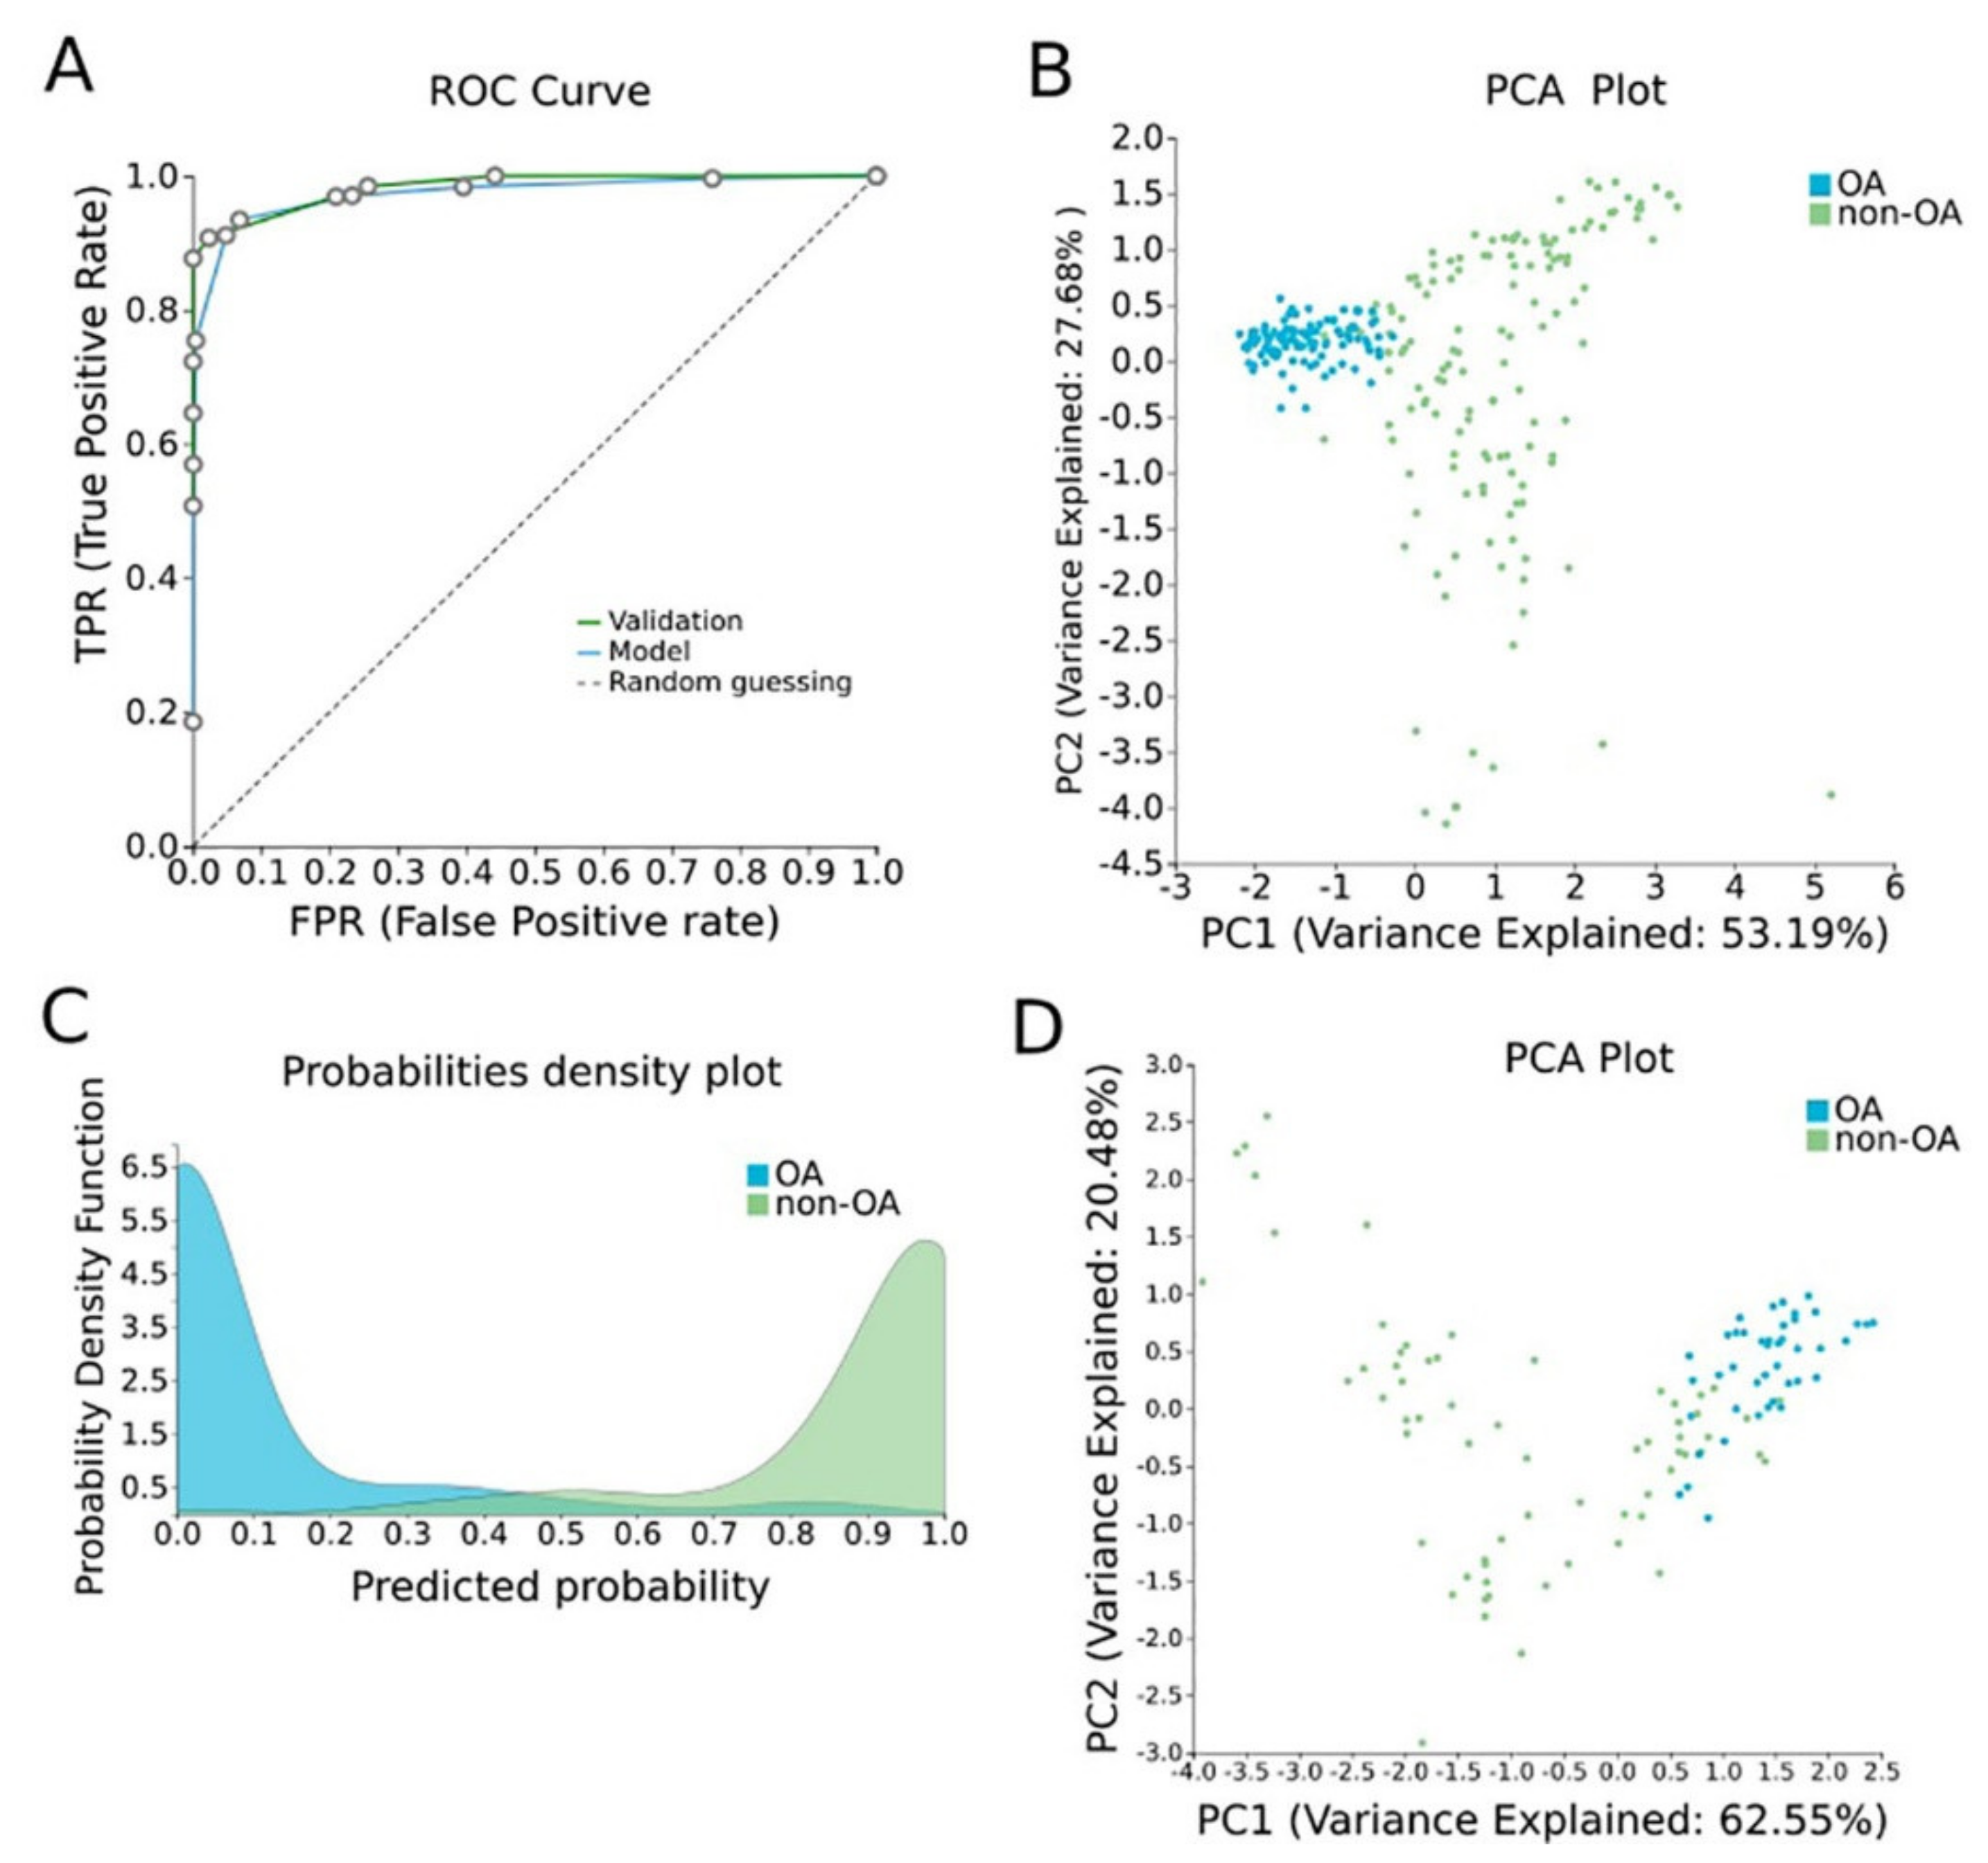
Figure 4. OA-specific methylation biosignature built using AutoML. (A) ROC curves of training (blue line) and validation (green line) models. (B) Supervised PCA plot (i.e., only considering the selected relevant biomarkers) presents separation between OA (blue) and non-OA healthy tissues (green) within the training group. (C) Out-of-sample probability density plot (i.e., probability predictions when samples were not used for training) depicts discrete distributions among studied classes of the training group. (D) PCA plot presents separation between OA (blue) and non-OA healthy tissues (green) within the validation group. Abbreviations: OA = osteoarthritis, ROC = receiver operating characteristic, PCA = principal component analysis.
Table 2. Differentially methylated genes selected in the OA cartilage-specific signature built using AutoML analysis. Their biological characteristics and functions revealed by GO analysis as well as their methylation status are described.
| Signature Genes | Gene Type | Description | Pathway | GO—Molecular Function | GO—Cellular Components | GO—Biological Process | UniReD Score | Methylation in OA in Relation to Other Tissues |
|---|---|---|---|---|---|---|---|---|
| CASD1 | Protein Coding | CAS1 Domain Containing 1 | NA | acetyltransferase activity, transferase activity, transferring acyl groups | Golgi membrane, Golgi apparatus, membrane, integral component of membrane, integral component of Golgi membrane | Carbohydrate metabolic process | 0 | Hypomethylation |
| LINC01350 | LncRNA | Long Intergenic Non-Protein Coding RNA 1350 | NA | NA | NA | NA | NA | Hypomethylation |
| RP11-515E23.2 | NA | NA | NA | NA | NA | NA | NA | Hypomethylation |
| STOML1 | Protein Coding | Stomatin-Like 1 | NA | protein binding | endosome, plasma membrane, membrane, integral component of membrane | lipid transport | 2.5 | Hypomethylation |
| CARMAL | RNA Gene | Coronary Artery Disease Region-Linked MFGE8 Regulatory LncRNA | NA | NA | NA | NA | NA | Hypomethylation |
| RP11-272L13.3 | LncRNA | NA | NA | NA | NA | NA | NA | Hypomethylation |
Abbreviations: OA: osteoarthritis, AutoML: automated machine learning, GO: gene ontology, NA: non-available.
3.4. Biological Relevance of Genes Selected in the OA-Specific Methylation Biosignature
GO analysis revealed the biological characteristics of the genes included in the assembled models. CASD1 participates in acetyltransferase and transferase activity molecular functions and others, is mainly located in the Golgi system and is involved in the carbohydrate metabolic process. STOML1 takes part in protein binding, is mainly located in the endosome and plasma membrane and participates in lipid transport (Table 2). For LINC01350, RP11-515E23.2, CARMAL and RP11-272L13.31, no relevant information was found in the GeneCards database (Table 2).
Following this, the two protein-coding gene features were analyzed via UniReD using a list of 10 protein-coding genes that are known to be related to OA pathophysiology, namely, VDR [34], AGC1 [35], IGF-1 [36], ADAMTS4 [37], TGF beta [38], MATN3 [39], MMP13 [40], COL2A1 [41], COL11A1 [42] and COL9A1 [43]. Only STOML1 was found to be associated with OA pathways according to the KEGG pathway identification, reaching a score of 2.5 (Table 2).
4. Diabetes
4.1. Differential Methylation Analysis Comparing Pancreatic β-Cells and Other Tissues
To decipher the methylation landscape of pancreatic β-cells, which could be of value in monitoring diabetes, raw methylomes of 3 pancreatic β-cell samples were analyzed against 28 other tissues/cell types, including blood, serum, muscle, adipose, spleen, colon, gastric, liver, skin, etc. using RnBeads. Differential methylation analysis revealed 65 hypomethylated and 1 hypermethylated genes in β-cells in comparison to other tissues (FDR < 0.05). A heatmap of the emergent DMGs is presented in Figure 5.
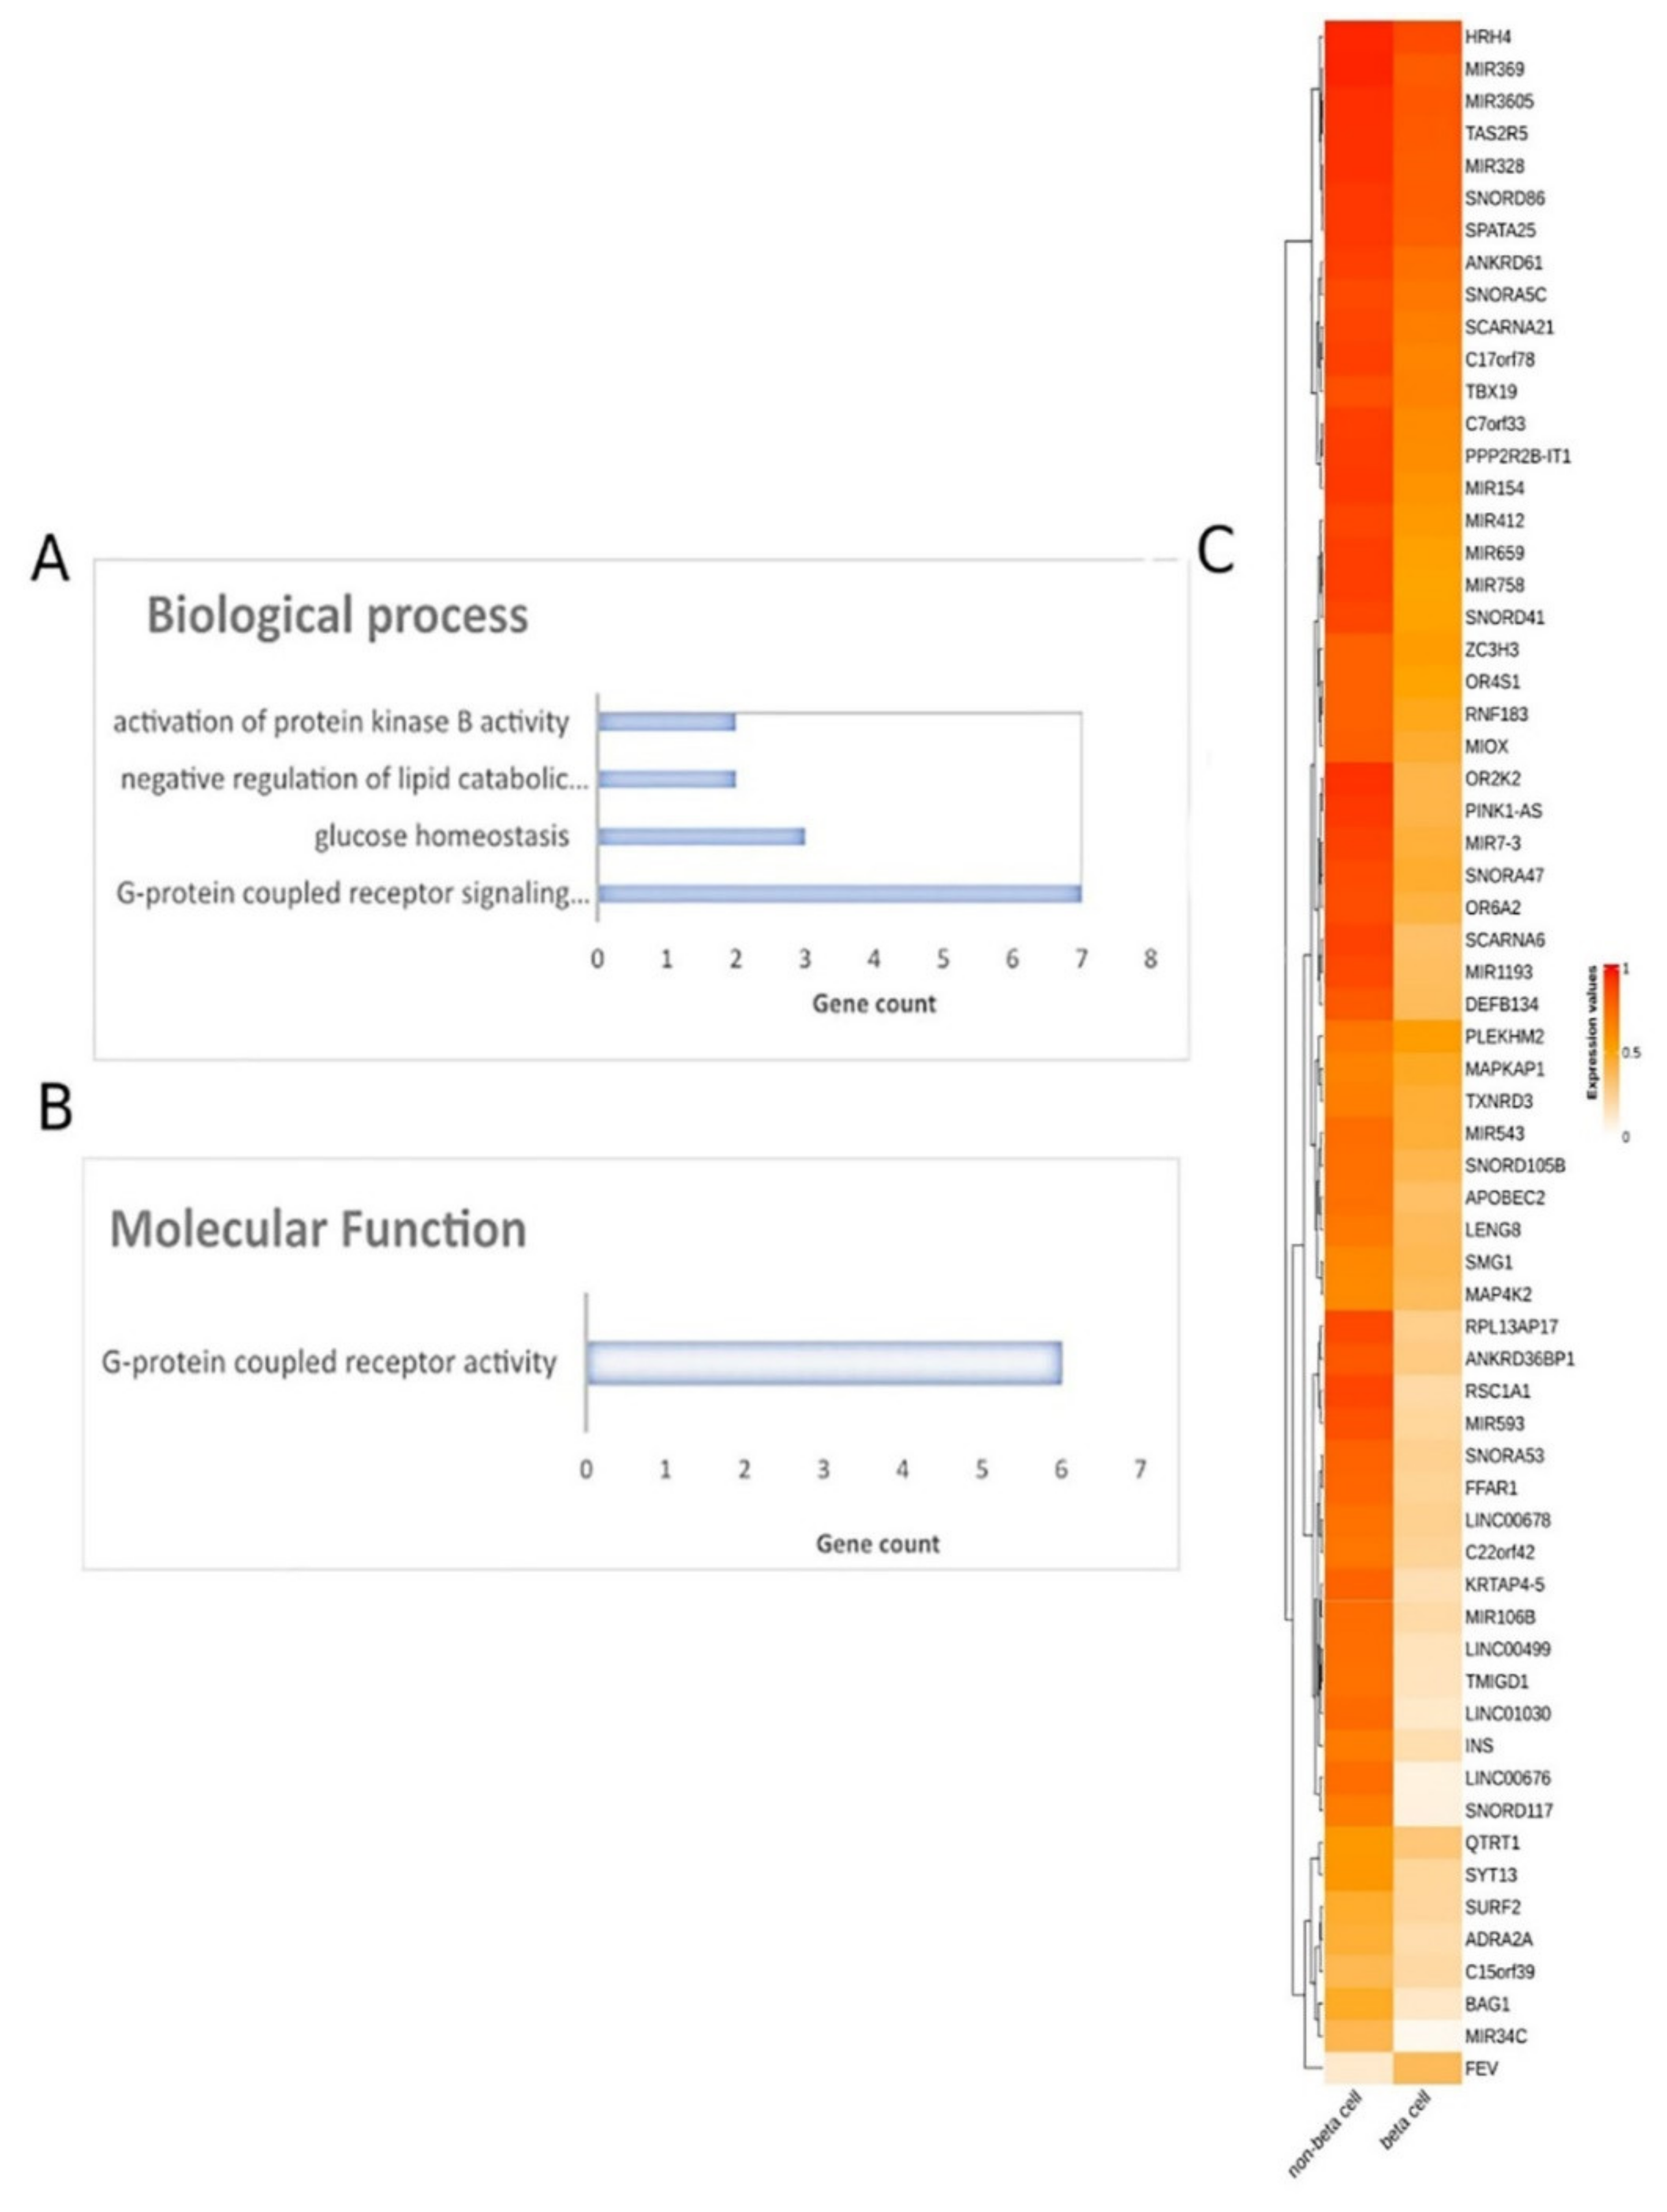
Figure 5. Differential methylation analysis comparing pancreatic β-cells and other tissues. Gene ontology analysis of 66 DMGs in the aspects of (A) biological process and (B) molecular function analysis. (C) Heatmap plot of 66 DMGs comparing pancreatic β-cells and other healthy tissues. Abbreviations: DMGs = differentially methylated genes.
4.2. Functional Analysis of DMGs Comparing Pancreatic β-Cells and Other Tissues
Further, all DMGs identified were subjected to functional analysis. Molecular function analysis showed an enrichment in the G-protein-coupled receptor activity and signaling pathway, glucose homeostasis, the negative regulation of lipid catabolic process and the activation of protein kinase B activity (Figure 5). Reactome pathway analysis did not lead to any pathways.
4.3. Pancreatic β-Cell Specific Methylation Biosignature Using AutoML
To construct a pancreatic β-cell-specific methylation biosignature, methylome β-values of 3 β-cell samples and 28 other tissue/cell samples were analyzed through JADBio. From the 28,021 CG feature dataset, AutoML analysis produce a biosignature containing 4 features via a support vector machine algorithm (https://app.jadbio.com/share/7ebbc7c3-b861-41af-8a39-88202756d609, accesed on 1 October 2021). Two of them were protein-coding genes, namely, TXNRD3 and LENG8, one was a snoRNA gene, namely, SCARNA6, and one an LncRNA gene, namely, AC008741.1 (Table 3). All genes showed decreased methylation in pancreatic β-cells in relation to other tissues/cells. The signature’s performance in discriminating β-cells reached an AUC of 0.984 (0.909–1.000) and an average precision of 0.995 (0.975–1.000) (Figure 6A). The model’s performance and inspection are depicted in Figure 6B,C.
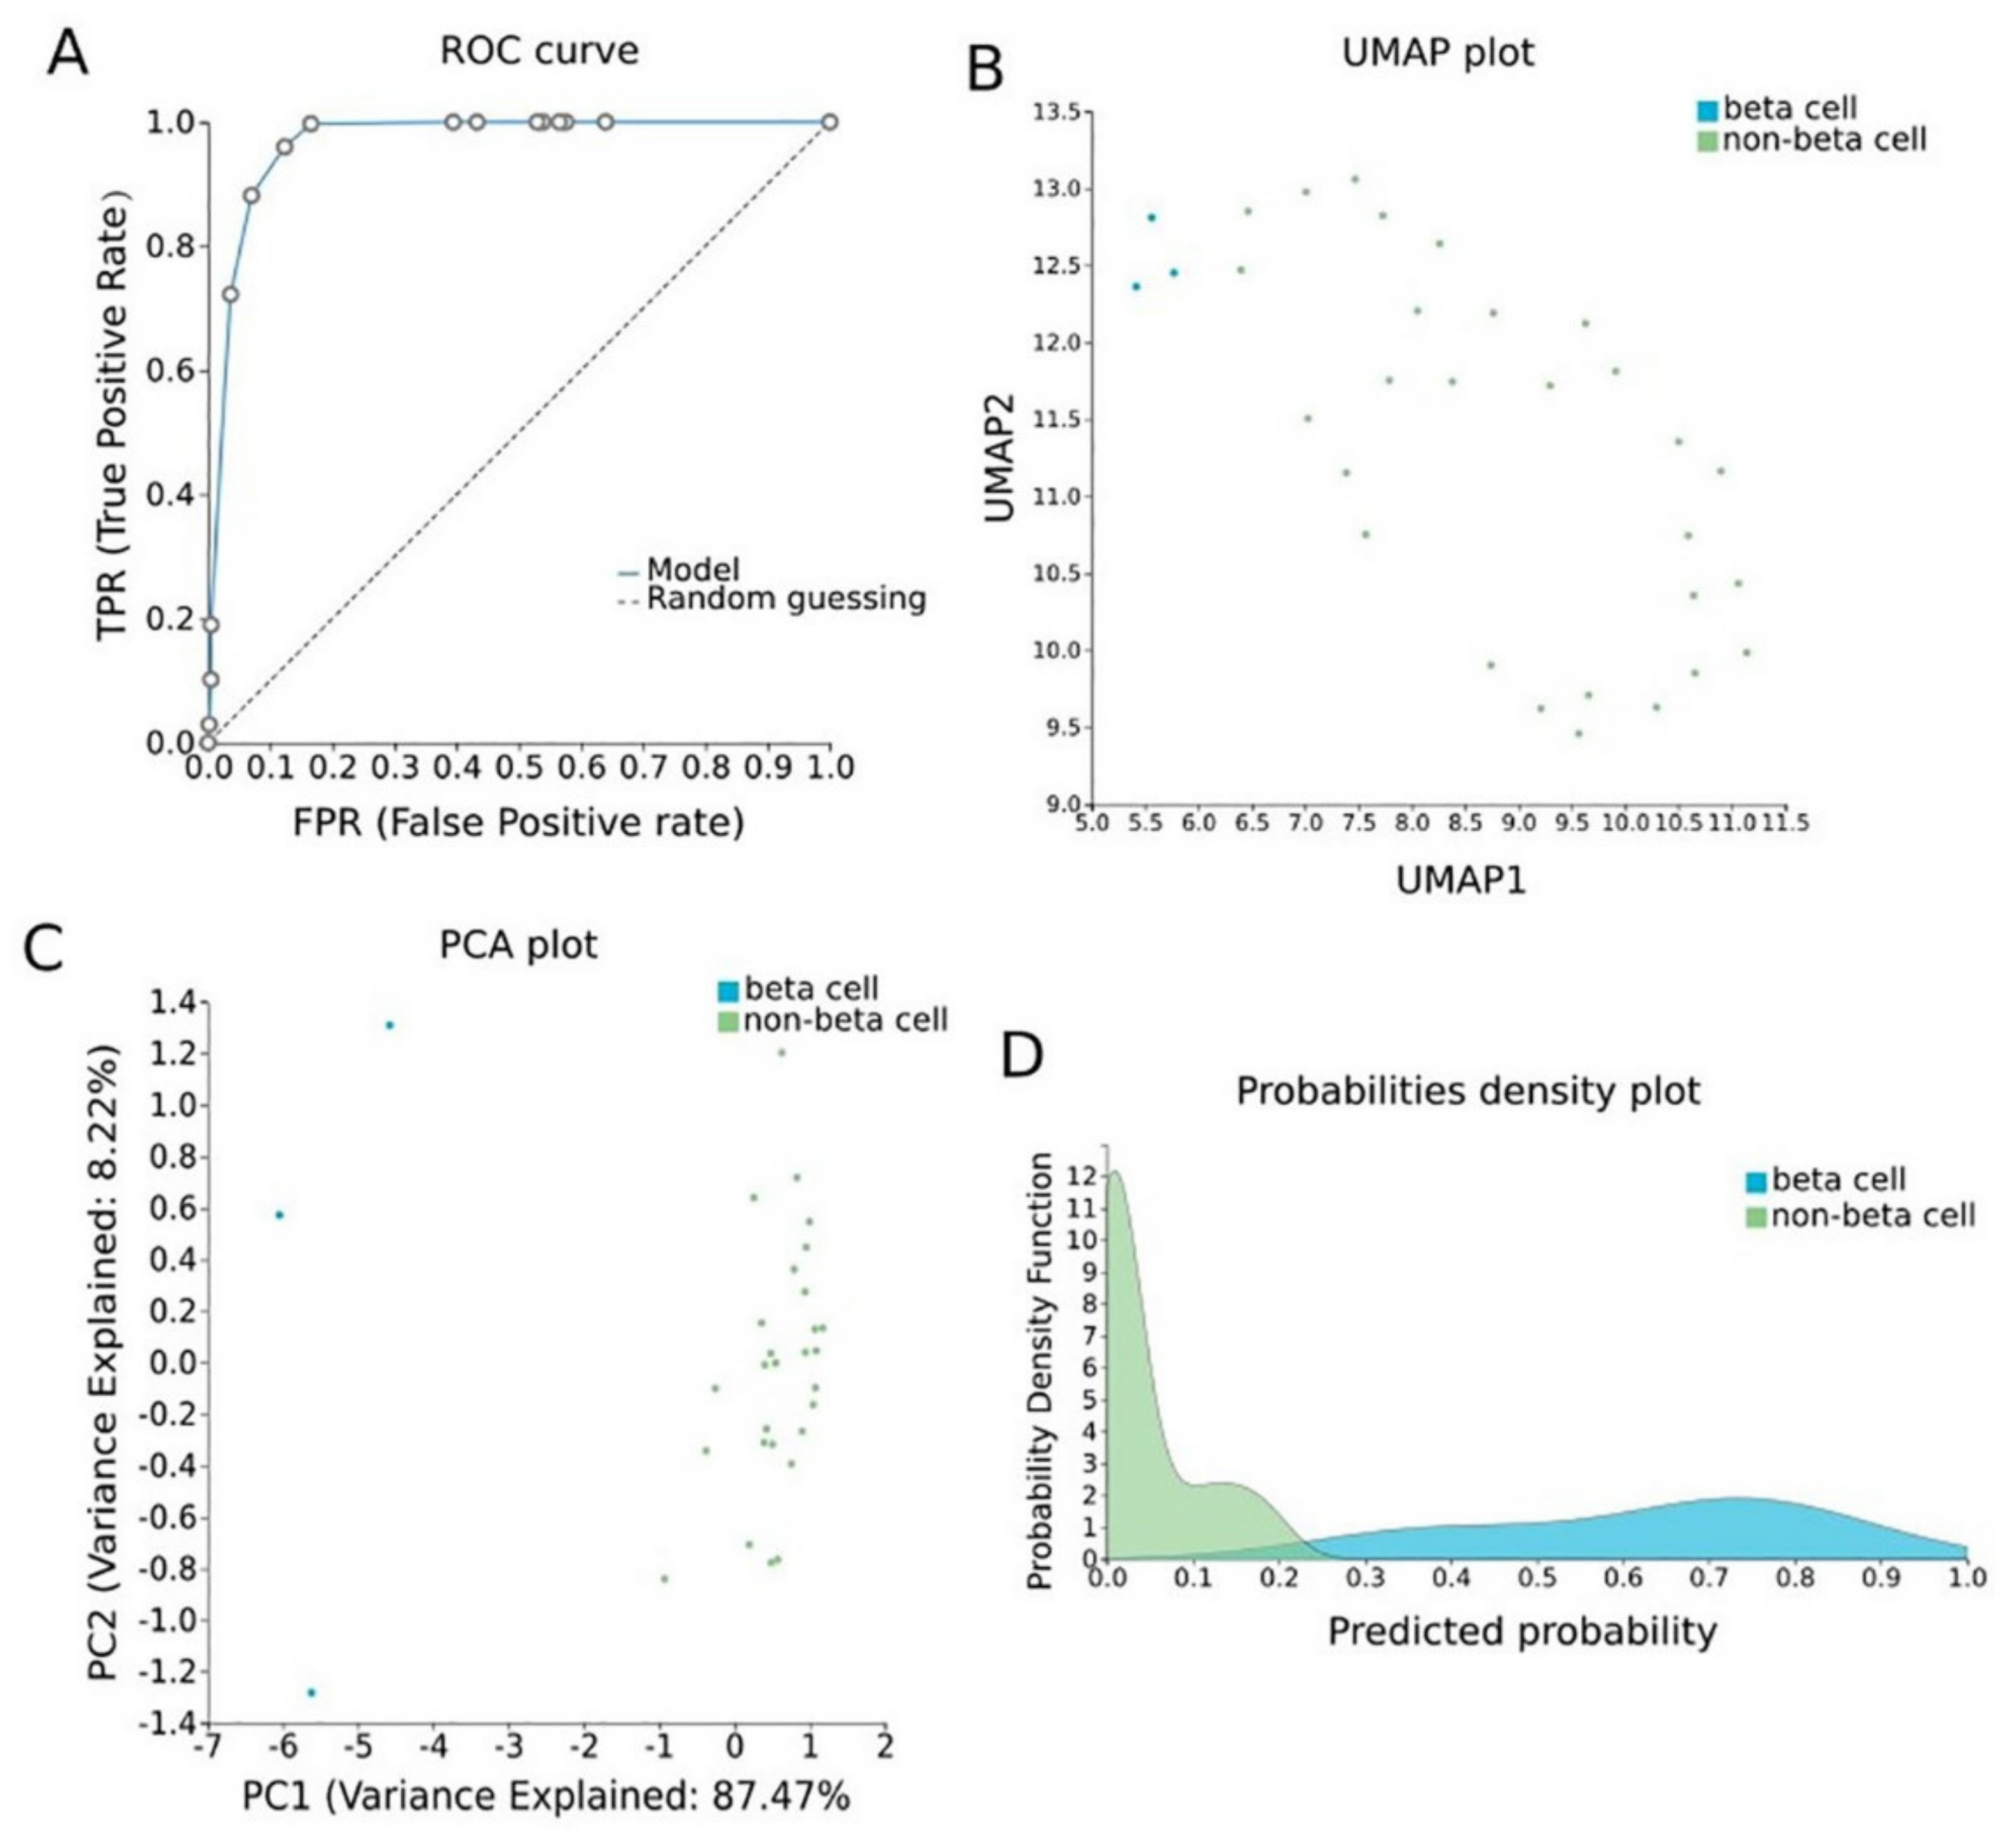
Figure 6. Pancreatic β-cell-specific methylation biosignature built using AutoML. (A) ROC curve of model. (B) UMAP plot shows separation between pancreatic β-cells (blue) and other tissues (green). (C) Supervised PCA plot (i.e., only considering the selected relevant biomarkers) presents separation between pancreatic β-cells (blue) and other tissues (green). (D) Out-of-sample probability density plot (i.e., probability predictions when samples were not used for training) depicts discrete distributions among studied classes. Abbreviations: ROC = receiver operating characteristic, PCA = principal component analysis, UMAP = uniform manifold approximation and projection.
Table 3. Differentially methylated genes selected in the pancreatic β-cell-specific signature built using AutoML analysis comparing methylomes of β-cells and other healthy tissues. Their biological characteristics and functions revealed by GO analysis as well as their methylation status are described.
| Signature Genes | Gene Type | Description | Pathway | GO—Molecular Function | GO—Cellular Components | GO—Biological Process | UniReD Score | Methylation in Pancreatic β Cells in Relation to Other Healthy Tissues |
|---|---|---|---|---|---|---|---|---|
| SCARNA6 | snoRNA | Small Cajal Body-Specific RNA 6 | NA | NA | nucleolus | RNA processing | ΝA | Hypomethylation |
| TXNRD3 | Protein Coding | Thioredoxin Reductase 3 | folate metabolism and mechanisms of CFTR activation by S-nitrosoglutathione | nucleotide binding, thioredoxin disulfide reductase activity, electron transfer activity, protein disulfide oxidoreductase activity | cell, nucleoplasm, cytoplasm, endoplasmic reticulum, cytosol | multicellular organism development, spermatogenesis, electron transport chain, cell differentiation | 5.5 | Hypomethylation |
| AC008741.1 | lncRNA | Novel Transcript, Antisense To ZKSCAN2 | NA | NA | NA | NA | ΝA | Hypomethylation |
| LENG8 | Protein Coding | Leukocyte Receptor Cluster Member | NA | protein binding | nucleus | NA | NA | Hypomethylation |
Abbreviations: AutoML: automated machine learning, GO: gene ontology, NA: non-available.
4.4. Biological Relevance of Genes Selected in the β-Cell-Specific Methylation Biosignature
GO analysis revealed that SCARNA6 is a nucleolus component and is involved in RNA processing. TXNRD3 has a nucleotide binding function, thioredoxin disulfide reductase activity, electron transfer activity and others (Table 3). It is a component of nucleoplasm and cytoplasm and is involved in many biological processes, such as cell differentiation. LENG8 participates in protein binding in the nucleus. For AC008741.1 no information about its molecular function, cellular component and biological process was available in the GeneCards database (Table 3).
Finally, the two protein-coding gene features were analyzed with UniReD, using a list of 10 protein-coding genes that are known to be related to diabetes pathophysiology—SLC2A2 [44], IAPP [45], GSK [46], INSR [47], IRS1 [48], PPARG [49], KCNJ11 [50], ABCC8 [51], TCF7L2 [52] and FTO [53]. Only TXNRD3 was found to be associated with diabetes-related pathways according to the KEGG pathway identification, reaching a score of 5.5 (Table 3).
References
- Kulis, M.; Esteller, M. 2–DNA Methylation and Cancer. In Advances in Genetics; Herceg, Z., Ushijima, T., Eds.; Academic Press: Cambridge, MA, USA, 2010; Volume 70, pp. 27–56.
- Richardson, B. DNA methylation and autoimmune disease. Clin. Immunol. 2003, 109, 72–79.
- Bansal, A.; Pinney, S.E. DNA methylation and its role in the pathogenesis of diabetes. Pediatr. Diabetes 2017, 18, 167–177.
- Ammal Kaidery, N.; Tarannum, S.; Thomas, B. Epigenetic Landscape of Parkinson’s Disease: Emerging Role in Disease Mechanisms and Therapeutic Modalities. Neurotherapeutics 2013, 10, 698–708.
- Roy, D.; Tiirikainen, M. Diagnostic Power of DNA Methylation Classifiers for Early Detection of Cancer. Trends Cancer 2020, 6, 78–81.
- Klughammer, J.; Kiesel, B.; Roetzer, T.; Fortelny, N.; Nemc, A.; Nenning, K.-H.; Furtner, J.; Sheffield, N.C.; Datlinger, P.; Peter, N.; et al. The DNA methylation landscape of glioblastoma disease progression shows extensive heterogeneity in time and space. Nat. Med. 2018, 24, 1611–1624.
- Henderson-Smith, A.; Fisch, K.M.; Hua, J.; Liu, G.; Ricciardelli, E.; Jepsen, K.; Huentelman, M.; Stalberg, G.; Edland, S.D.; Scherzer, C.R.; et al. DNA methylation changes associated with Parkinson’s disease progression: Outcomes from the first longitudinal genome-wide methylation analysis in blood. Epigenetics 2019, 14, 365–382.
- Lu, A.T.; Narayan, P.; Grant, M.J.; Langfelder, P.; Wang, N.; Kwak, S.; Wilkinson, H.; Chen, R.Z.; Chen, J.; Bawden, C.S.; et al. DNA methylation study of Huntington’s disease and motor progression in patients and in animal models. Nat. Commun. 2020, 11, 4529.
- Goud Alladi, C.; Etain, B.; Bellivier, F.; Marie-Claire, C. DNA Methylation as a Biomarker of Treatment Response Variability in Serious Mental Illnesses: A Systematic Review Focused on Bipolar Disorder, Schizophrenia, and Major Depressive Disorder. Int. J. Mol. Sci. 2018, 19, 3026.
- Marie-Claire, C.; Lejeune, F.X.; Mundwiller, E.; Ulveling, D.; Moszer, I.; Bellivier, F.; Etain, B. A DNA methylation signature discriminates between excellent and non-response to lithium in patients with bipolar disorder type 1. Sci. Rep. 2020, 10, 12239.
- Sigin, V.O.; Kalinkin, A.I.; Kuznetsova, E.B.; Simonova, O.A.; Chesnokova, G.G.; Litviakov, N.V.; Slonimskaya, E.M.; Tsyganov, M.M.; Ibragimova, M.K.; Volodin, I.V.; et al. DNA methylation markers panel can improve prediction of response to neoadjuvant chemotherapy in luminal B breast cancer. Sci. Rep. 2020, 10, 9239.
- Chatzaki, E.; Tsamardinos, I. Somatic copy number aberrations detected in circulating tumor DNA can hold diagnostic value for early detection of hepatocellular carcinoma. EBioMedicine 2020, 57, 102851.
- Lai, H.; Huang, H.; Keshavjee, K.; Guergachi, A.; Gao, X. Predictive models for diabetes mellitus using machine learning techniques. BMC Endocr. Disord. 2019, 19, 101.
- Cai, Z.; Xu, D.; Zhang, Q.; Zhang, J.; Ngai, S.M.; Shao, J. Classification of lung cancer using ensemble-based feature selection and machine learning methods. Mol. Biosyst. 2015, 11, 791–800.
- Aref-Eshghi, E.; Schenkel, L.C.; Ainsworth, P.; Lin, H.; Rodenhiser, D.I.; Cutz, J.-C.; Sadikovic, B. Genomic DNA Methylation-Derived Algorithm Enables Accurate Detection of Malignant Prostate Tissues. Front Oncol. 2018, 8, 100.
- Panagopoulou, M.; Karaglani, M.; Manolopoulos, V.G.; Iliopoulos, I.; Tsamardinos, I.; Chatzaki, E. Deciphering the Methylation Landscape in Breast Cancer: Diagnostic and Prognostic Biosignatures through Automated Machine Learning. Cancers 2021, 13, 1677.
- Karaglani, M.; Gourlia, K.; Tsamardinos, I.; Chatzaki, E. Accurate Blood-Based Diagnostic Biosignatures for Alzheimer’s Disease via Automated Machine Learning. J. Clin. Med. 2020, 9, 3016.
- Dogan, M.V.; Grumbach, I.M.; Michaelson, J.J.; Philibert, R.A. Integrated genetic and epigenetic prediction of coronary heart disease in the Framingham Heart Study. PLoS ONE 2018, 13, e0190549.
- Tiulpin, A.; Klein, S.; Bierma-Zeinstra, S.M.A.; Thevenot, J.; Rahtu, E.; Meurs, J.v.; Oei, E.H.G.; Saarakkala, S. Multimodal Machine Learning-based Knee Osteoarthritis Progression Prediction from Plain Radiographs and Clinical Data. Sci. Rep. 2019, 9, 20038.
- Enríquez, J.G.; Martínez-Rojas, A.; Lizcano, D.; Jiménez-Ramírez, A. A Unified Model Representation of Machine Learning Knowledge. J. Web Eng. 2020, 19, 2.
- Tsamardinos, I.; Charonyktakis, P.; Lakiotaki, K.; Borboudakis, G.; Zenklusen, J.C.; Juhl, H.; Chatzaki, E.; Lagani, V. Just Add Data: Automated Predictive Modeling and BioSignature Discovery. bioRxiv, 2020; in press.
- Moss, J.; Magenheim, J.; Neiman, D.; Zemmour, H.; Loyfer, N.; Korach, A.; Samet, Y.; Maoz, M.; Druid, H.; Arner, P.; et al. Comprehensive human cell-type methylation atlas reveals origins of circulating cell-free DNA in health and disease. Nature Commun. 2018, 9, 5068.
- Liu, X.; Ren, J.; Luo, N.; Guo, H.; Zheng, Y.; Li, J.; Tang, F.; Wen, L.; Peng, J. Comprehensive DNA methylation analysis of tissue of origin of plasma cell-free DNA by methylated CpG tandem amplification and sequencing (MCTA-Seq). Clin. Epigenetics 2019, 11, 93.
- Panagopoulou, M.; Karaglani, M.; Balgkouranidou, I.; Pantazi, C.; Kolios, G.; Kakolyris, S.; Chatzaki, E. Circulating cell-free DNA release in vitro: Kinetics, size profiling, and cancer-related gene methylation. J. Cell. Physiol. 2019, 234, 14079–14089.
- Narod, S.A.; Salmena, L. BRCA1 and BRCA2 mutations and breast cancer. Discov. Med. 2011, 12, 445–453.
- Li, M.; Wang, C.; Yu, B.; Zhang, X.; Shi, F.; Liu, X. Diagnostic value of RASSF1A methylation for breast cancer: A meta-analysis. Biosci. Rep. 2019, 39, BSR20190923.
- Dustin, D.; Gu, G.; Fuqua, S.A.W. ESR1 mutations in breast cancer. Cancer 2019, 125, 3714–3728.
- Li, X.; Chen, X.; Wen, L.; Wang, Y.; Chen, B.; Xue, Y.; Guo, L.; Liao, N. Impact of TP53 mutations in breast cancer: Clinicopathological features and prognosisImpact of TP53 mutations in breast CA. Thorac. Cancer 2020, 11, 1861–1868.
- Arsenic, R.; Lehmann, A.; Budczies, J.; Koch, I.; Prinzler, J.; Kleine-Tebbe, A.; Schewe, C.; Loibl, S.; Dietel, M.; Denkert, C. Analysis of PIK3CA mutations in breast cancer subtypes. Appl. Immunohistochem. Mol. Morphol. AIMM 2014, 22, 50–56.
- Zhang, Y.; Ye, L.; Tan, Y.; Sun, P.; Ji, K.; Jiang, W.G. Expression of breast cancer metastasis suppressor-1, BRMS-1, in human breast cancer and the biological impact of BRMS-1 on the migration of breast cancer cells. Anticancer. Res. 2014, 34, 1417–1426.
- Corso, G.; Veronesi, P.; Sacchini, V.; Galimberti, V. Prognosis and outcome in CDH1-mutant lobular breast cancer. Eur. J. Cancer Prev. 2018, 27, 237–238.
- Chimonidou, M.; Tzitzira, A.; Strati, A.; Sotiropoulou, G.; Sfikas, C.; Malamos, N.; Georgoulias, V.; Lianidou, E. CST6 promoter methylation in circulating cell-free DNA of breast cancer patients. Clin. Biochem. 2013, 46, 235–240.
- Carbognin, L.; Miglietta, F.; Paris, I.; Dieci, M.V. Prognostic and Predictive Implications of PTEN in Breast Cancer: Unfulfilled Promises but Intriguing Perspectives. Cancers 2019, 11, 1401.
- Keen, R.W.; Hart, D.J.; Lanchbury, J.S.; Spector, T.D. Association of early osteoarthritis of the knee with a Taq I polymorphism of the vitamin D receptor gene. Arthritis Rheum. 1997, 40, 1444–1449.
- Gleghorn, L.; Ramesar, R.; Beighton, P.; Wallis, G. A mutation in the variable repeat region of the aggrecan gene (AGC1) causes a form of spondyloepiphyseal dysplasia associated with severe, premature osteoarthritis. Am. J. Hum. Genet. 2005, 77, 484–490.
- Wei, F.Y.; Lee, J.K.; Wei, L.; Qu, F.; Zhang, J.Z. Correlation of insulin-like growth factor 1 and osteoarthritic cartilage degradation: A spontaneous osteoarthritis in guinea-pig. Eur. Rev. Med. Pharmacol. Sci. 2017, 21, 4493–4500.
- Verma, P.; Dalal, K. ADAMTS-4 and ADAMTS-5: Key enzymes in osteoarthritis. J. Cell. Biochem. 2011, 112, 3507–3514.
- Shen, J.; Li, S.; Chen, D. TGF-β signaling and the development of osteoarthritis. Bone Res. 2014, 2, 14002.
- Pullig, O.; Tagariello, A.; Schweizer, A.; Swoboda, B.; Schaller, P.; Winterpacht, A. MATN3 (matrilin-3) sequence variation (pT303M) is a risk factor for osteoarthritis of the CMC1 joint of the hand, but not for knee osteoarthritis. Ann. Rheum. Dis. 2007, 66, 279–280.
- Wang, M.; Sampson, E.R.; Jin, H.; Li, J.; Ke, Q.H.; Im, H.-J.; Chen, D. MMP13 is a critical target gene during the progression of osteoarthritis. Arthritis Res. Ther. 2013, 15, R5.
- Vikkula, M.; Palotie, A.; Ritvaniemi, P.; Ott, J.; Ala-Kokko, L.; Sievers, U.; Aho, K.; Peltonen, L. Early-onset osteoarthritis linked to the type ii procollagen gene. detailed clinical phenotype and further analyses of the gene. Arthritis Rheum. 1993, 36, 401–409.
- Raine, E.V.; Dodd, A.W.; Reynard, L.N.; Loughlin, J. Allelic expression analysis of the osteoarthritis susceptibility gene COL11A1 in human joint tissues. BMC Musculoskelet. Disord. 2013, 14, 85.
- Mustafa, Z.; Chapman, K.; Irven, C.; Carr, A.J.; Clipsham, K.; Chitnavis, J.; Sinsheimer, J.S.; Bloomfield, V.A.; McCartney, M.; Cox, O.; et al. Linkage analysis of candidate genes as susceptibility loci for osteoarthritis—Suggestive linkage of COL9A1 to female hip osteoarthritis. Rheumatology 2000, 39, 299–306.
- Laukkanen, O.; Lindström, J.; Eriksson, J.; Valle, T.T.; Hämäläinen, H.; Ilanne-Parikka, P.; Keinänen-Kiukaanniemi, S.; Tuomilehto, J.; Uusitupa, M.; Laakso, M. Polymorphisms in the SLC2A2 (GLUT2) gene are associated with the conversion from impaired glucose tolerance to type 2 diabetes: The Finnish Diabetes Prevention Study. Diabetes 2005, 54, 2256–2260.
- Kanatsuka, A.; Kou, S.; Makino, H. IAPP/amylin and β-cell failure: Implication of the risk factors of type 2 diabetes. Diabetol. Int. 2018, 9, 143–157.
- Henriksen, E.J.; Dokken, B.B. Role of glycogen synthase kinase-3 in insulin resistance and type 2 diabetes. Curr. Drug Targets 2006, 7, 1435–1441.
- Kazemi, B.; Seyed, N.; Moslemi, E.; Bandehpour, M.; Bikhof Torbati, M.; Saadat, N.; Eidi, A.; Ghayoor, E.; Azizi, F. Insulin receptor gene mutations in iranian patients with type II diabetes mellitus. Iran. Biomed. J. 2009, 13, 161–168.
- Zeggini, E.; Parkinson, J.; Halford, S.; Owen, K.R.; Frayling, T.M.; Walker, M.; Hitman, G.A.; Levy, J.C.; Sampson, M.J.; Feskens, E.J.M.; et al. Association Studies of Insulin Receptor Substrate 1 Gene (IRS1) Variants in Type 2 Diabetes Samples Enriched for Family History and Early Age of Onset. Diabetes 2004, 53, 3319–3322.
- Stumvoll, M.; Häring, H. The Peroxisome Proliferator-Activated Receptor-γ2 Pro12Ala Polymorphism. Diabetes 2002, 51, 2341–2347.
- Karaglani, M.; Ragia, G.; Panagopoulou, M.; Balgkouranidou, I.; Nena, E.; Kolios, G.; Papanas, N.; Manolopoulos, V.G.; Chatzaki, E. Search for Pharmacoepigenetic Correlations in Type 2 Diabetes Under Sulfonylurea Treatment. Exp. Clin. Endocrinol. Diabetes 2019, 127, 226–233.
- Zhou, X.; Chen, C.; Yin, D.; Zhao, F.; Bao, Z.; Zhao, Y.; Wang, X.; Li, W.; Wang, T.; Jin, Y.; et al. A Variation in the ABCC8 Gene Is Associated with Type 2 Diabetes Mellitus and Repaglinide Efficacy in Chinese Type 2 Diabetes Mellitus Patients. Intern. Med. 2019, 58, 2341–2347.
- Hattersley, A.T. Prime suspect: The TCF7L2 gene and type 2 diabetes risk. J. Clin. Investig. 2007, 117, 2077–2079.
- Chauhan, G.; Tabassum, R.; Mahajan, A.; Dwivedi, O.P.; Mahendran, Y.; Kaur, I.; Nigam, S.; Dubey, H.; Varma, B.; Madhu, S.V.; et al. Common variants of FTO and the risk of obesity and type 2 diabetes in Indians. J. Hum. Genet. 2011, 56, 720–726.
More