Your browser does not fully support modern features. Please upgrade for a smoother experience.
Please note this is a comparison between Version 6 by Conner Chen and Version 5 by Conner Chen.
The isolated micro-grid system can be composed of a variety of energy sources such as the Photovoltaic generator, the wind system, a methanation system, possibly even a hydraulic generator in such farm places. All these energy sources must be connected to serve the load part and when there is excessive production of electrical energy, an electrical storage system must appear.
- energy management
- micro-grid
1. Photovoltaic Generator
A photovoltaic generator is a set of solar panels that convert light energy (sunlight) into electrical energy that varies depending on the influence of light and temperature, using solar cells that are connected in series and/or parallel to each other to obtain desired characteristics such as power, voltage, and current. As shown in the diagram, the equivalent circuit of a solar photovoltaic (PV) has numerous types [1][2][3]. It is determined by the number of diodes connected in series. One parallel diode, shunt resistance, series resistance, a current source, and a diode are all included in the basic version. For a single diode model, the modeling step begins with expressing the output current as shown in Equation (1).as it is in [4]:
The current of a single cell is calculated by integrating the temperature and irradiation factors:
Equation (3) presents the current in the path of the diode:
The thermal voltage of a diode is given as in Equation (4).
The diode saturation current I0 depends on the temperature of the panel. IP is the current passing through the parallel resistance of the circuit. All of these parameters may be found in Equations (5) and (6), respectively.
Then, the expression (1), becomes as it is in Equation (7).
As a result, once the number of panels in serial or parallel is determined, the whole PV system voltage and current can be stated as in Equations (8) and (9), respectively.
The maximum power equals 1.5 kW that can be given by the built PV model. The model was built using the datasheet’s accessible information. Table 1 illustrates the PV module’s essential specifications. To develop a model of a 250 W solar photovoltaic module, a real PV module SUN EARTH SOLAR POWER TPB156x156-72-P 250 W was considered as a standard module.
Table 1. PV system parameters per PV panel.
| Parameters | Values | Parameters | Values |
|---|---|---|---|
| IPh | 7.9163 A | Ki | 0.07 %/deg.C |
| I0 | 1.3196 × 10⁻¹⁰ A | a | 0.9467 |
| Isc | 7.89 A | T | 273 + (10, 15, 25, 30) K |
| Voc | 43.4 V | Tn | 298 K |
| Rs | 0.53082 Ω | G | (500, 750, 1000) W/m2 |
| Rp | 159.1067 Ω | Gn | 1000 W/m2 |
| Vmp | 34.4 V | Imp | 7.27 A |
| K | 1.38 × 10⁻²³ J/K | Eg | 1.2 eV |
| q | 1.6 × 10⁻¹⁹ C | ns | 72 |
| PPV | 5 kW | VPV | 172 V |
| IPV | 29.069 A | Ns∗Np | 5*4 |
2. Wind Turbine
As it is known, the wind turbine system is made up of two main components. The mechanical subsystem, which describes the propeller part and the gearbox tool, which adapts the torque and speed from the two sides and converts the wind power to a mechanical power adapted to the electrical subsystem. This second subsystem is built on an electrical machine, which can be any of several different types of electrical machines [5]. At the end of this loop, a variety of converters and inverters are used to adapt the outputted voltage to the main load or charge. Figure 1 shows this loop. In this research work, the permanent magnet machine is used to build the global wind system. In the next section, the corresponding mathematical model is given and described [6].
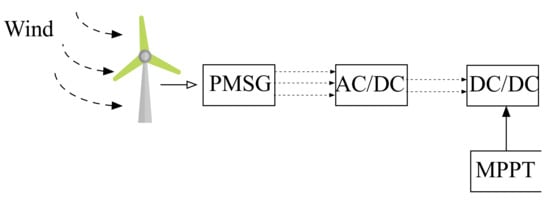
Figure 1. Wind system control loop.
2.1. Mechanical Subsystem
Equation (10) gives the mechanical power output of the wind turbine [7].
( Cp ) represents the power coefficient of the wind turbine. It is expressed in Equation (11).
λi is given by Equation (12) as:
Equation (13) presents The Tip speed ratio.
Generally, the wind turbine specification can be analyzed by the curve, which draws the evolution of the power coefficient Cp in concordance to the angle of orientation β of propellers and the specific speed of the main shaft of the propellers noted λ. Figure 2 gives this relationship. According to the law of Betz, this coefficient can reach a maximum value of 59% in theory but practically it can reach 40% for the most efficient wind turbines [8].
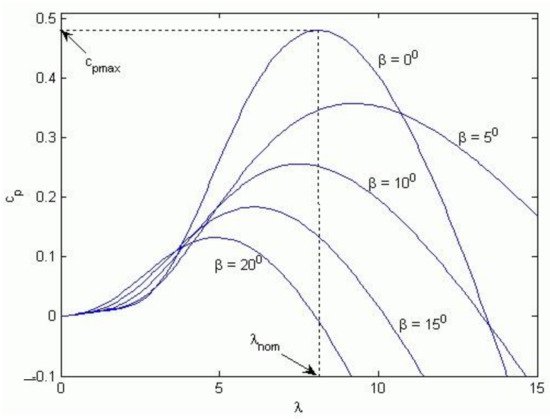
Figure 2. Wind system parameters according to the propeller orientation factor.
The mechanical angular speed of the turbine is calculated using the relationship between the electrical torque and the mechanical torque, which includes the mass of the generator and the turbine as in Equation (14).
2.2. Electrical Subsystem
For the final output desired physical parameter, which is the electrical current, an electrical machine is used to generate the electrical power. Modeling this block is necessary for completing all the generator block equations [9].
The use of the permanent magnet synchronous generator (PMSG) is preferable for WT technology. Due to its permanent magnets, the dynamic model of the PMSG does not depend on equations related to the rotor winding. For this, developing the dynamic model of the PMSG by using the equations of Voltage and flux. The voltage system of the equation noted (Vabcs) and magnetic flux system of the equation noted (Øabcs) can be visualized in Equations (15) and (16). All of these systems are created in a three-phase process (ABC) [10][11].
Jdωmdt=Te−Tm−F.ωm
The rotor reference frame can be used to characterize the PMSG’s dynamic model. As a result, the voltage system of equations in the d and q axes is:
Vqs=rs.iqs.Lq.diqs dt+ωr. Ld.ids.Øm
Vds=rs.ids+didsdt−ωr.Lq.iqs
The electromagnetic torque is given by:
Te=(32).(P2).(Øm. iqs+(Ld−Lq).iqs. ids)
The parameters of the wind system can be visualized in Table 2.
Table 2.
Wind system parameters.
| Mechanical Parameters | Electrical Parameters | ||||
|---|---|---|---|---|---|
| Parameter | Value | Parameter | Value | Parameter | Value |
| Pme | 13,500 W | C4 | 5 | Te | 50 N.m |
| Cp | 0.48 | C5 | 21 | P | 4 |
| Vw | -- m/s | C6 | 0.0068 | Øm | 0.1688 web |
| λ | 1.2 | S | 33.36 m2 | rs | 0.0918 Ω |
| Ω | 300 tr/min | ρ | 1.292 Kg/m | ωr | 314.159 tr/min |
| R | 3 m | J | 148.5 Kg.m2 | ||
| β | 0 deg | F | 1.4 N.m.s/rad | ||
| C1 | 0.5176 | ωm | 31.41 rad/s | ||
| C2 | 116 | Tm | 45 N.m | ||
| C3 | 0.4 | ||||
3. Lithium Battery Pack
The main component inside this energy loop is based on the electric energy accumulator, which is based on the lithium battery version. For assuring the needed simulation and studying correctly the comportment of this system, a mathematical battery model is required to characterize the electrical characteristics. The given mathematical model is based on a Second-Order RC Equivalent Circuit Model (ECM) to describe the external electrical performance of the battery, as shown in Figure 3. The ECM consists of an open circuit voltage source (OCV), an internal ohmic resistance R0, and two parallel RC arrays. Resistance R1 and capacity C1 are used to simulate the reactivity distribution to capture the local characteristics of the electrolyte. The charge transfer resistor R2 and the double-layer electrical capacity C2, are used to represent the interface impedance of the battery [12][13][14][15].
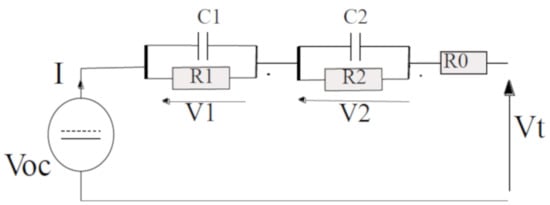
Figure 3.
Battery pack: equivalent electrical diagram.
The differential equations of the ECM are exposed in Equations (20)–(22).
dV1dt=−V1R1.C1+IC1
dV2dt=−V2R2.C2+IC2
Vt=Voc[SOC(t)]−V1−V2−I.R0
I is the current, R0 represents the Ohmic resistance of the storage device, V1 and V2 denote the polarization voltage over R1.C1 and R2.C2, respectively Vt is the terminal voltage, Voc represents the open-circuit voltage (OCV), which is a function of SOC.
The SOC value can be expressed as in Equation (23), where Qn is the battery rated capacity [16].
SOC(t1)=SOC(t0)−∫t10I(t)dtQn
The battery rated capacity depends on the effect of the capacity fading. The remaining battery capacity available is expressed in Equation (24) [17].
Qn=3600.Qinit.CCF
where CCF represents the Capacity correction factor and Qinit is the Initial battery capacity [Ah]. From the other side, the functioning of the battery system can be summarized by the following Equations (25) and (26).
Ech(t)=Ebat(t−1)+(EHES(t)−EL(t)).ηbat
Edis(t)=Ebat(t−1)−(EL(t)−EHES(t))
where Ech is the battery power in the charging, Edis is the battery power in the discharging, ηbat is the battery efficiency (%), EL is the load demand, and EHES is the power delivered from the energy system (W). Figure 4 shows the discharge characteristic example of the used battery. Table 3 shows the key specification of the considered battery.
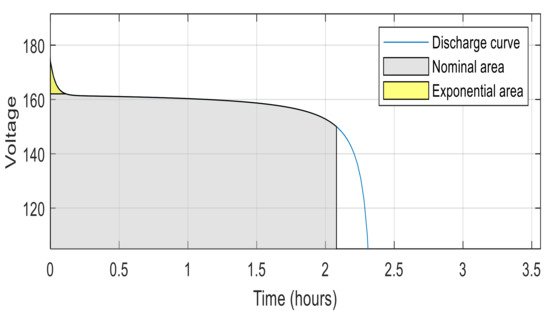
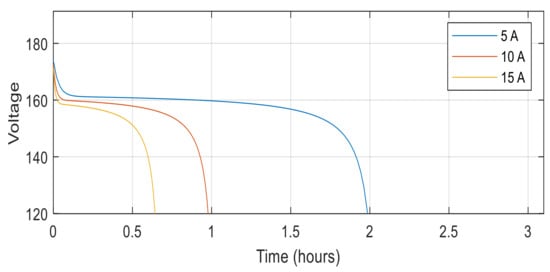
Figure 4. Discharge specification of the used battery.
Table 3. Battery system parameters.
| Parameter | Value |
|---|---|
| Pn | 1500 Wh |
| Vn | 150 V |
| Qn | 10 Ah |
| R0 | 0.15 Ω |
4. Converters
Basically, numerous inverters must be used for having a DC flow from the major energy sources. A three-phase static converter based on a diode bridge rectifier (not controlled) is used to convert the alternating type (AC) electrical energy produced by the wind turbine into continuous type electrical energy (DC), connected directly by a boost converter (DC/DC) to reach the MPPT [18][19]. This last converter has the same objective for the photovoltaic system. On the other hand, a buck-boost converter (DC/DC) is installed to control the charge and discharge of the battery pack.
Based on these specific works, cited as [20][21], related to the electronic converters, it is easy to express the input and output voltage of the boost converter as in Equation (27). Vint is the input voltage, Vout is the output voltage, D is duty cycling.
Vint=Vout1−D
The buck-boost converter has two operation modes. It depends on the position of the Isolate Gate Bipolar Transistor (IGBT), which can be found inside. Supposing that these two switches have the nomination of K10 and K11. The relationship between these two parameters can be expressed in Equation (28).
K11=1−K10
As this chopper will be connected to a battery pack from one side and a DC bus line from the other side, Vbat denotes the battery voltage side and Vdc denotes the DC bus voltage side. So, the relationship between the two voltages can be expressed as in Equation (29) and the output current can be formulated as in Equation (30).
Lbat. dibatdt+rbat.ibat=Vbat−Vdc.(1−K10)
Iout=Ibat.(1−K10)
References
- Rao, L.N.; Gairola, S. PV System Analysis under Partial Shading Using a Sine Model. Int. J. Renew. Energy Res. 2018, 8, 280–290.
- Radu, R.; Micheli, D.; Alessandrini, S.; Casula, I.; Radu, B. Modeling and Performance Analysis of an Integrated System: Variable Speed Operated Internal Combustion Engine Combined Heat and Power Unit–Photovoltaic Array. J. Energy Resour. Technol. 2015, 137, 32001–32010.
- Chenouard, R.; El-Sehiemy, R.A. An interval branch and bound global optimization algorithm for parameter estimation of three photovoltaic models. Energy Convers. Manag. 2020, 205, 112400.
- Said, M.; Shaheen, A.M.; Ginidi, A.R.; El-Sehiemy, R.A.; Mahmoud, K.; Lehtonen, M.; Darwish, M.M.F. Estimating Parameters of Photovoltaic Models Using Accurate Turbulent Flow of Water Optimizer. Processes 2021, 9, 627.
- Hammoumi, D.; El Bekkali, C.; Karim, M.; Taoussi, M.; El Ouanjli, N.; Bossoufi, B. Direct controls for wind turbine with PMSG used on the real wind profile of essaouira-Morocco City. Indones. J. Electr. Eng. Comput. Sci. 2019, 16, 1229–1239.
- Angala Parameswari, G.; Habeebullah Sait, H. A comprehensive review of fault ride-through capability of wind turbines with grid-connected doubly fed induction generator. Int. Trans. Electr. Energy Syst. 2020, 30, e12395.
- Asmine, M.; Brochu, J.; Fortmann, J.; Gagnon, R.; Kazachkov, Y.; Langlois, C.-E.; Larose, C.; Muljadi, E.; MacDowell, J.; Pourbeik, P.; et al. Model Validation for Wind Turbine Generator Models. IEEE Trans. Power Syst. 2011, 26, 1769–1782.
- Sørensen, P.; Andresen, B.; Fortmann, J.; Pourbeik, P. Modular structure of wind turbine models in IEC 61400-27-1. In Proceedings of the 2013 IEEE Power & Energy Society General Meeting, Vancouver, BC, Canada, 21–25 July 2013; pp. 1–5.
- Flah, A.; Irfan, A.K.; Agarwal, A.; Sbita, L.; Marcelo, G. Simoes Field-oriented control strategy for double-stator single-rotor and double-rotor single-stator permanent magnet machine: Design and operation. Comput. Electr. Eng. 2021, 90, 106953.
- Ogunjuyigbe, A.S.O.; Ayodele, T.R.; Adetokun, B.B. Modelling and Analysis of Dual Stator-Winding Induction Machine using Complex Vector Approach Engineering Science and Technology, an International Journal Modelling and analysis of dual stator-winding induction machine using complex vector approach. Eng. Sci. Technol. Int. J. 2018, 21, 351–363.
- Rajan Singaravel, M.M.; Arul Daniel, S. Sizing of hybrid PMSG-PV system for battery charging of electric vehicles. Front. Energy 2015, 9, 68–74.
- Rothenberger, M.J.; Safi, J.; Liu, J.; Anstrom, J.; Brennan, S.; Fathy, H.K. Improving Lithium-Ion Battery Pack Diagnostics by Optimizing the Internal Allocation of Demand Current for Parameter Identifiability. J. Dyn. Syst. Meas. Control 2017, 139, 081001.
- Scrosati, B.; Garche, J. Lithium batteries: Status, prospects and future. J. Power Sources 2010, 195, 2419–2430.
- Di Domenico, D.; Stefanopoulou, A.; Fiengo, G. Lithium-Ion Battery State of Charge and Critical Surface Charge Estimation Using an Electrochemical Model-Based Extended Kalman Filter. J. Dyn. Syst. Meas. Control 2010, 132, 061302.
- El-Sehiemy, R.A.; Hamida, M.A.; Mesbahi, T. Parameter identification and state-of-charge estimation for lithium-polymer battery cells using enhanced sunflower optimization algorithm. Int. J. Hydrogen Energy 2020, 45, 8833–8842.
- Kraiem, H.; Flah, A.; Mohamed, N.; Alowaidi, M.; Bajaj, M.; Mishra, S.; Sharma, N.K.; Sharma, S.K. Increasing Electric Vehicle Autonomy Using a Photovoltaic System Controlled by Particle Swarm Optimization. IEEE Access 2021, 9, 72040–72054.
- Hajia, N.; Venkatesh, B. SOC model of high power Lithium-Ion battery. In Proceedings of the 2015 IEEE Electrical Power and Energy Conference, London, ON, Canada, 24 October 2015; pp. 112–119.
- Rezzak, D.; Boudjerda, N. Management and control strategy of a hybrid energy source fuel cell/supercapacitor in electric vehicles. Int. Trans. Electr. Energy Syst. 2017, 27, e2308.
- Tankari, M.A.; Camara, M.B.; Dakyo, B. DC-bus voltage control for multi-sources systems—Battery and Supercapacitors. In Proceedings of the IECON 2011—37th Annual Conference of the IEEE Industrial Electronics Society, Melbourne, VIC, Australia, 7–10 November 2011; pp. 1270–1275.
- Reshma Gopi, R.; Sreejith, S. Converter topologies in photovoltaic applications—A review. Renew. Sustain. Energy Rev. 2018, 94, 1–14.
- Patin, N. 2—DC/AC Converters. In Power Electronics Applied to Industrial Systems and Transports; Elsevier: Amsterdam, The Netherlands, 2015; Volume 2, pp. 35–100. ISBN 978-1-78548-001-0.
More