The photoacoustic (PA) effect is the generation of pressure perturbations in a medium due to its heating with non-stationary electromagnetic radiation. A new generation of sensors can be engineered based on the sensing of several markers to satisfy the conditions of the multimodal detection principle. From this point of view, photoacoustic-based sensing approaches are essential. The photoacoustic effect relies on the generation of light-induced deformation (pressure) perturbations in media, which is essential for sensing applications since the photoacoustic response is formed due to a contrast in the optical, thermal, and acoustical properties. It is also particularly important to mention that photoacoustic light-based approaches are flexible enough for the measurement of thermal/elastic parameters. Moreover, the photoacoustic approach can be used for imaging and visualization in material research and biomedical applications. The advantages of photoacoustic devices are their compact sizes and the possibility of on-site measurements, enabling the online monitoring of material parameters. The latter has significance for the development of various sensing applications, including biomedical ones, such as monitoring of the biodistribution of biomolecules. To extend sensing abilities and to find reliable measurement conditions, one needs to clearly understand all the phenomena taking place during energy transformation during photoacoustic signal formation.
1. Introduction
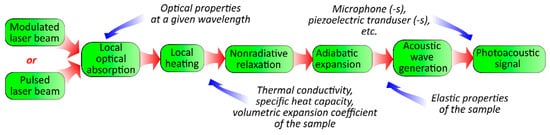
The photoacoustic (PA) effect is the generation of pressure perturbations in a medium due to its heating with non-stationary electromagnetic radiation. One of the main mechanisms responsible for the effect is the heating of the medium because of the non-radiation relaxation of elementary excitations (electrons, phonons, etc.). The relaxations arise due to the absorption of the radiation, and the subsequent thermal expansion leads to the formation of an acoustical vibration in the materials (see
Figure 1)
[1]. Thus, the PA response is sensitive to the optical, thermal, and elastic properties of the medium. Moreover, PA methods are a powerful group of approaches for the sensing of various material properties. These can be applied for the investigation of systems in gas, liquid, and solid phases
[2,3,4,5][2][3][4][5].
Figure 1.
Physical processes involved in PA signal formation.
2. Physical Principles of Photoacoustic Imaging
The discovery of the PA effect also stimulated the development of various approaches for the visualization of the object, which was later called photoacoustic imaging (PAI)
[76][6]. The first low-resolution and contrast images were focused on obtaining information from various inorganic materials, such as metallic and semiconducting structures
[77][7]. The limitations of this technique were due to the inherent drawbacks of the systems related to focusing monochromatic optical radiation and positioning the beam on the sample. Subsequent technical progress has played an important role in the development of this technique. The modern PAI technique reconstructs the simultaneous real-time imaging of surface and subsurface structures with high contrast and micron-scale spatial resolution
[78,79,80][8][9][10]. In this section,
the weresearchers introduce technical advances and the applicability of the photoacoustic technique in microscale imaging. In addition,
we the researchers briefly emphasize the role of nanostructures in improving the visualization of objects using the PAI technique.
PAI methods have several advantages over optical microscopy, namely (i) they provide a deeper imaging depth (up to hundreds of micrometres for PAM and up to several centimetres for PAT), (ii) they do not need optical sectioning to provide a 3D PA image, and (iii) they can analyze the samples that are too absorbing, too scattering, or too transparent for optical microscopy methods.
According to the configurations of optical excitation sources and PA signal detection methods, the implementations of PAI can be classified into two broad categories
[81][11]:
- Photoacoustic microscopy (PAM), a common low-cost method where a focused modulated laser beam is used to achieve high-spatial-resolution imaging at small depths;
- Photoacoustic tomography (PAT), is a hybrid imaging technique that combines optical excitation and acoustic detection to realize imaging with relatively deep penetration in the studied object.
2.1. Photoacoustic Microscopy: Areas of Application, Advantages, and Drawbacks
At present, PAM is known to be one of the most powerful techniques for the non-destructive testing of surface flaws and subsurface inhomogeneities of the studied objects. This concept is provided by using a non-stationary laser with the ability to move its beam through the sample’s surface and detect the PA response This is achieved, for example, by moving the sample itself using stepper motors or manipulating the beam using acousto-optic deflectors. According to the process of PA signal registration, the most commonly used PAM detection schemes are the gas–microphone technique and a method that uses a piezoelectric transducer.
In the case of the low-frequency modulation of the laser (from Hz to kHz), the PA signal depends on (a) the optical absorption of the sample, (b) the generation and propagation of thermal waves, and (c) elastic waves. Thus, many factors contribute to the characterization of a sample based on the analysis of its PA response.
A combination of PAM with other methods can provide aggregate information about the target sample, complementing different types of imaging
[81,82,83][11][12][13]. As scanning modes, it is possible to use various methods for recording the PA response, methods such as optical images for the transmission or reflection of light, the photoelectric (PE) method, etc. The choice of the scanning mode depends on the possibility of adapting the system to the structural features of the sample, as well as the research objectives.
In particular, PAM, complemented by images in the PE mode of semiconductor materials, can visualize any irregularities that are elastically stressed regions, disturb the propagation of the thermal diffusion wave, and/or affect the optical absorption coefficient that is difficult to see with an optical microscope (for example, subsurface voids, microcracks, the crystallographic defects of substrates, and the delamination of layered materials)
[83][13]. Furthermore, the use of confocal microscopy coupled with the PA approach offers the possibility of estimating the size of the nanoparticle’s agglomeration
[84][14].
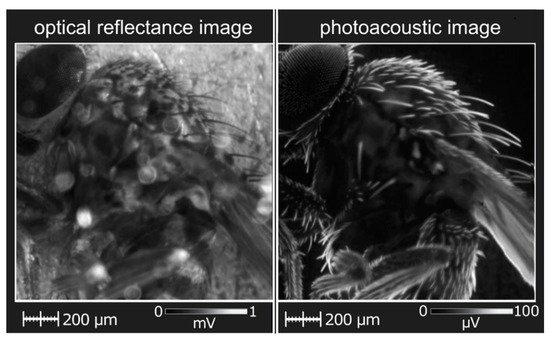
The use of a dual-mode PAM/optical imaging system has been implemented, for example, for visualizing organic objects, such as the Drosophila fly (see
Figure 2)
[82][12]. The obtained PA images complement the images based on the reflected light and reveal the features of the microscopic anatomy of the insect that can be accurately seen only with high-precision and expensive devices such as SEM.
Figure 2. PAT images of a Drosophila fly obtained by a bi-modal system in the reflected light and PA mode.
It should be noted that low-frequency PA microscopy, along with its advantages, also has several technical and engineering problems that need to be solved. Among them, motion artefacts (if a living object is used as a target), imaging field limitations, and low scanning speed play an important role. In addition, most modern PAM systems are applicable only for the visualization of small areas (up to several hundred square millimetres), limited both by instrumental factors (slow scanning speed, the capabilities of sensors for detecting the PA signal, etc.) and by the nature of photothermoacoustic processes (fast extinction of the heat-wave in the sample, etc.).
To overcome motion artefacts from living objects under study, they are typically well-fixed and/or in anaesthesia. However, the anaesthetic or uncomfortable fixation effect may affect physiological functions, such as neuron activities and metabolism, contrary to normal conditions. These factors can give a false picture of the vital signs of the object during various kinds of research. The issue of analyzing conscious living organisms using PAM methods at this stage has not been resolved and requires significant engineering solutions (the miniaturization of a cell, its incorporation into an organism, a significant reduction in scanning time, etc.).
2.2. Adaptation of Photoacoustic Tomography for Preclinical and Clinical Applications
Photoacoustic tomography (PAT) characterizes the optical properties of a studied sample from acoustic signals excited by the absorption of modulated electromagnetic radiation. The imaging of optical absorption reveals important information about the internal environment in phantom or biological tissues
[85,86][15][16]. In general, the PA response is excited by pulsed laser radiation with a pulse duration of ~10 ns in the visible and near-infrared spectral range, and the acoustic waves, which appear after the absorption of radiation and are caused by the thermoelastic expansion of the media, are detected by various broadband sensors, analyzed in detail in
[87][17].
In PAT, images are reconstructed by applying appropriate tomographic algorithms to the acquired time-resolved signals for an accurate reconstruction of imaging. To create a high-quality image, several hundred to tens of thousands of detector positions are usually used. To achieve this high number of sensors, several approaches could be applied. Dean-Ben et al.
[88][18] developed a volumetric multispectral optoacoustic tomography platform for imaging a neural activation deep in scattering brains. Such a platform contains 512 elements, which allow us to obtain single-shot, 3D tomographic images. The reconstruction of an image by applying a 3D algorithm can be performed by a curved array rotating relative to the studied object, emulating a spherical array with thousands of virtual sensor points
[89][19]. A PAT image can be reconstructed by a series of 2D sectional images generated by a ring-shaped array that encloses the studied object and is then translated along the ring axis
[90,91][20][21]. Additionally, one can independently analyze each 2D slice. The latter allows for more precision, considering the time-dependent processes in a slice. For instance, Paltauf et al. presented an array of extended, line-shaped detectors that generate 2D projections of the photoacoustic sources for photoacoustic tomography
[92,93][22][23].
The possibility of the noncontact piezoelectric detection of photoacoustic signals in tissue phantoms was analyzed in
[94][24] in detail. The authors studied human blood flow in a silicon rubber tube mimicking a blood vessel with an inner diameter of 4 mm. The photoacoustic time traces were recorded by the transducers, which were located at a 7.5 mm distance from the phantom interface, at different frequencies. It was shown that the sensitivity of the air-coupled ultrasound transducers is sufficient to detect PA signals generated by an artificial blood vessel. The latter allows for the integration of PA noncontact piezoelectric detection simultaneously with the X-ray mammographic screening procedure.
Gao et al.
[95][25] applied the piezoelectric photoacoustic method based on a simplified thermoelastic theory to evaluate the thermal diffusivities of some biological tissues. Particularly, the thermal diffusivities of porcine tissues (skin, fat, muscle, heart, liver, and kidney) with different preparation conditions were assessed. They showed that the thermal diffusivities of the fresh tissues are higher in comparison with those of the dried and specially prepared tissues. This may occur because evaporating the tissues increases the discontinuity in the tissues and fixing the proteins and fats of the tissues increases the thermal resistance. Both these effects decreased the thermal diffusivities of the tissues. The obtained results show that the photoacoustic method with piezoelectric detection is effective for evaluating the effective thermal diffusivities of the tissues with micro-inhomogeneities.
Kolkman et al.
[96][26] demonstrated the possibility of the application of photoacoustic imaging (PAI) in the detection of blood vessels inside the tissue in a non-invasive way. The biological tissue is irradiated by a short light pulse, which is partly absorbed by the particles, such as red blood cells. The resulting acoustic wave propagates through the tissue and can be detected at the surface by a piezoelectric transducer.
The photoacoustic technique with piezoelectric detection (by using a fast PZT-ceramic acoustic transducer) also allowed for the in vitro and in vivo study of individual cells and nanoparticles in
[97][27]. The latter offers the possibility for the diagnosis of breast cancer labelled with gold nanoparticles. Together with further hyperthermia treatment, this allows us to develop an efficient theranostic approach for breast cancer.
Among other areas in therapy, the analysis of the glucose level in blood or interstitial fluid is crucial for diabetic diagnosis. Kottmann et al. studied glucose concentration in the human epidermis by the PA method for the first time
[98,99][28][29]. They used an external-cavity quantum-cascade laser and a gas–microphone method for the detection of acoustic signals described above. The detection limits of glucose concentration were obtained in the physiological range of 30–500 mg/dL. Nevertheless, for monitoring the glucose levels non-invasively, some improvements are necessary. In
[100][30], a tunable pulsed laser for a photoacoustic method with piezoelectric detection was used for measurements of glucose concentration. However, a significant disadvantage of such studies is the need to use expensive microphones and quantum cascade lasers.
Bayrakli et al.
[101][31] developed a PA sensor with an inexpensive piezoelectric film transducer as an acoustic detection module and an amplitude-stabilized external cavity diode laser source. A wavelength equal to 1050 nm of the source was chosen for glucose concentration analysis. This sensor offers the possibility of achieving a detection limit of 900 mg/dL. In
[102][32], the theory of liquid photoacoustic resonance was developed. The relation between signal characteristics and the concentration of the glucose solution was obtained. The experimental results show that a liquid’s photoacoustic resonance can enhance the signal and the resolution thus achieved is 20 mg/dL. Therefore, the proposed method overcomes the issue of low sensitivity and inaccurate detection in nonresonant cases.
3. Physical Principles of Photoacoustic FT-IR Spectroscopy
Fourier transform infrared spectroscopy (FT-IR) is currently one of the widely used systems for the analysis and identification of functional groups in solids, liquids, and gases. FT-IR spectra can be used for sensing chemical substances and bonds.
The main problem with the FT-IR analysis of semi-solid and solid materials is that almost all of these materials are too opaque for the direct analysis of optical transmission in the mid-infrared region of the spectrum
[103][33]. Another significant problem is the scattering of the IR light, which can significantly perturb the spectra from nanostructured materials and biological tissue.
From this point of view, the most versatile solution to the problems of opacity and scattering in the mid-infrared range is Fourier transform photoacoustic infrared spectroscopy (PA FT-IR).
The PA FT-IR method is based on the photoacoustic effect. Generally, the illumination of samples in different aggregate states with electromagnetic radiation is carried out in the IR wavelength range. The absorption of this radiation causes local changes in temperature inside the sample, leading to its thermal expansion. These processes create acoustic waves in the near-surface region of the sample, isolated from the environment, which is captured by a highly sensitive microphone, the vibration amplitude of which is measured using a laser interferometer
[104][34]. In the current section,
wthe researche
rs will consider the application of the PAS in the characterization of solid and liquid samples with nanostructured phases.
3.1. Gas-Phase Photoacoustic FT-IR Spectroscopy
Gas–microphone configuration is the most used configuration for PA FT-IR measurements. There are several solutions presented in stock that are compatible with different FT-IRs
[17][35].
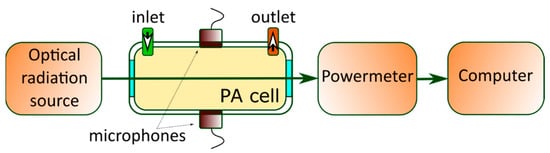
As described above, in PAS, the absorbing gas medium enclosed in a specially designed PA cell (see
Figure 3)
[105][36] absorbs laser radiation at the desired frequency. The energy absorbed by the gas is translated into gas pressure variations through non-radiative relaxation processes, which cause acoustic waves inside the PA cell to be detected by microphones. In the resonance, the PA configuration’s frequency of modulation is chosen from standing waves in the considered cell
[106][37].
Figure 3. Schematic sketch view of the PAS setup’s configuration.
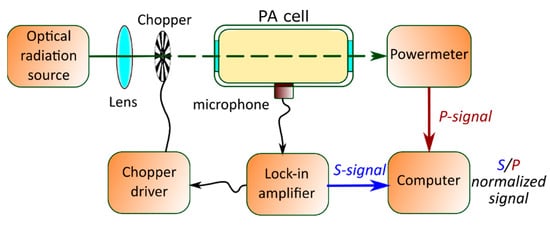
The respective frequency of modulation can be achieved by the interruption of the continuous wave laser radiation by a mechanical chopper operating at an acoustic resonance frequency of the PA cell. It is then focused by a lens and directed through the resonant PA cell. In such a configuration (see Figure 4), the transmitted laser power (signal P) can also be detected with a power meter. Moreover, the PA signal (S) can be analyzed with a lock-in amplifier and the normalized absorption can then be deduced as the S/P ratio.
Figure 4. A typical setup for PAS measurements with resonance PA cells.
A typical application of PA spectroscopy is the detection of atmospheric CH
4, CO
2 [107][38] ppm, NO
2 [108][39], and N
2O, and sensitivity in the range of a few parts per billion could be achieved
[109][40]. For further insight regarding PA gas sensing, one can refer to the recent reviews
[2,105,106][2][36][37].
3.2. Solid- and Liquid-Phase Photoacoustic FT-IR Spectroscopy
The physical principle of PA-based IR spectroscopy is similar to the one described in previous sections. In this case, the gas–microphone and piezoelectric configurations are often used for signal detections
[1]. However, some specificity of the signal formation should be considered to distinguish the optical properties of the considered media with good precision.
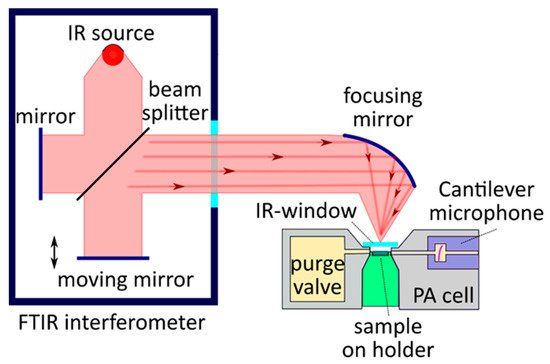
A sketch of an IR spectrometer with PA cells for the analysis of solid and liquid samples is presented in
Figure 5 [17][35]. This setup consists of an IR spectrometer, a focusing system, and a PA cell with a sample. IR radiation from the spectrometer is focused on the sample’s surface and causes local heating of the sample. The magnitude of the heating depends on the absorption at the specific wavelength. Thus, scattering phenomena do not directly influence the registered signal. One can associate the absorbed portion of light at a specific depth with the surface temperature based on thermal problems similar to the ones described in
Section 2.
Figure 5. Schematic view of a typical photoacoustic Fourier transform infrared (PA FT-IR) setup. Reprinted with permission from ref.
[17][35]. Copyright 2021 Gasera Ltd. Oy.
At the moment, condenser microphones remain the most common sensors for measuring the PA response from a sample during its analysis by photoacoustic spectroscopy
[110][41]. The alternative piezoelectric transducer is not so widely used in such types of systems due to the significant mismatching of the acoustical impedance between the piezoelectric material and the surrounding gas.
A cantilever pressure sensor is another promising sensor type that has begun to be used in modern PA FT-IR spectroscopy
[111,112,113][42][43][44]. The main advantages of the cantilever over other types of sensors are its wide dynamic range of motion and low string constant, which is several orders of magnitude less than for membranes of other sensors. The movement of the cantilever can be tens of micrometres, without any limiting and non-linear effects. To avoid damping due to the probe and to maintain a wide dynamic range, it is necessary to provide an interferometric measurement of the cantilever tip’s motion
[114][45].
An example of the widespread use of a cantilever pressure sensor with significantly improved sensitivity for PAS applications is the sensor developed and patented by Gasera. This cantilever is fabricated from silicon using a controlled double-sided micro-etching process for silicon-on-insulator (SOI) wafers
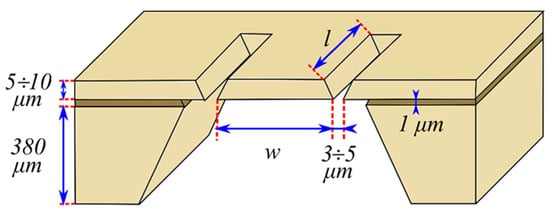
[115][46]. The movement of this sensor, caused by the differential pressure over the console, is similar to the movement of a saloon door. The cantilever itself is usually a few microns thick and rests on thicker frames, the thickness of which reaches several hundred microns. The cantilever is surrounded on three sides by a micrometric gap that separates it from the frame structure. A schematic drawing of a cantilever’s structure and its typical dimensions is shown in
Figure 6 [116][47].
Figure 6. Silicon cantilever sensor. Typical dimensions for width
w and length
l are a few millimetres [116]. are a few millimetres [47].
The presented solution for the design of a cantilever is capable of providing ultra-high-sensitivity PA spectra in a few seconds, which is difficult to achieve with alternative available photoacoustic sensors. In addition, in this system, it is sufficient to use ambient air as a carrier gas to obtain the signal-to-noise ratio, since this still gives a better result in comparison with other PA detectors that use helium as a carrier gas
[117][48].
For example, in
[104][34], the results of the application of FT-IR spectroscopy are presented, where a cantilever was used as a sensor to determine the organic composition of mixed linker metal-organic frameworks. It was shown that this setup makes it possible to distinguish between azido and amino linkers on three different MOF platforms with a sensitivity that is 2 orders of magnitude higher than when using classical IR spectroscopy.