Delta-9-tetrahydrocannabinol (THC) and cannabidiol (CBD) are the two s the main phytocannabinoids found in plants of the Cannabis genus. Although THC has exactly the same chemical formula as CBDcannabidiol (CBD) (i.e., C21H30O2), there is a slight difference in their atomic arrangement in that THC contains a cyclic ring, whereas CBD contains a hydroxyl group (Figure S1) [1,2]. Due to the difference in chemical structure, THC and CBD are found to have different pharmacological effects. THC is considered the main psychotropic constituent of cannabis, acting as a partial agonist at cannabinoid type 1 (CB1) and type 1 (CB2) receptors of the endocannabinoid system.
- delta-9-tetrahydrocannabinol
- cannabidiol
- Alzheimer’s disease
- radial arm water maze test
- amyloid-β
- APP/PS1 transgenic mice
1. Introduction
2. THC and CBD Reduced the Production of Aβ1–42 Peptide in N2a/APPswe Cells
In this regard, treatment with CBD alone and in combination with THC were included as positive controls was the in vitro study to examine whether the inhibitory effect of THC alone on Aβ production in N2a/APPswe cells was comparable to that of CBD alone and CBD + THC. In this experiment, ELISA was used to examine the effect of THC and CBD treatment alone or in combination on the production of Aβ1–40 and Aβ1–42 in N2a/APPswe cells that constitutively produce high levels of Aβ protein due to the transfected mutant APP gene. As shown in
Figure 2A, treatment with 10 nM THC, 100 nM THC, 100 nM CBD, and 100 nM of THC and CBD in combination for 24 h significantly decreased the Aβ1–40 production in N2a/APPswe cells by 23% (p < 0.05), 27% (p < 0.01), 21% (p < 0.05), and 32% (p < 0.001), respectively. The mean Aβ1–40 level in N2a/APPswe cells treated with 10 nM CBD was not significantly different from that of the vehicle control (1A, treatment with 10 nM THC, 100 nM THC, 100 nM CBD, and 100 nM of THC and CBD in combination for 24 h significantly decreased the Aβ1–40 production in N2a/APPswe cells by 23% (p < 0.05), 27% (p < 0.01), 21% (p < 0.05), and 32% (p < 0.001), respectively. The mean Aβ1–40 level in N2a/APPswe cells treated with 10 nM CBD was not significantly different from that of the vehicle control (
Figure 2A.). Treatment with 10 nM THC, 100 nM THC, 10 nM CBD, 100 nM CBD, and 100 nM of THC and CBD in combination for 24 h significantly decreased the Aβ1–42 production in N2a/APPswe cells by 28% (p < 0.001), 35% (p < 0.001), 18% (p < 0.05), 19% (p < 0.05), and 31% (p < 0.001), respectively (1A.). Treatment with 10 nM THC, 100 nM THC, 10 nM CBD, 100 nM CBD, and 100 nM of THC and CBD in combination for 24 h significantly decreased the Aβ1-42 production in N2a/APPswe cells by 28% (p < 0.001), 35% (p < 0.001), 18% (p < 0.05), 19% (p < 0.05), and 31% (p < 0.001), respectively (
Figure 2B). Moreover, the inhibitory effect of 100 nM THC on Aβ1–42 production was significantly greater than that of 10 nM CBD (p < 0.05.1B). Moreover, the inhibitory effect of 100 nM THC on Aβ1–42 production was significantly greater than that of 10 nM CBD (P < 0.05.
Figure 2). Treatment with THC and CBD alone or in combination for 42 h had no significant effect on the production of Aβ1–40 and Aβ1–42 in N2a/APPswe cells (p > 0.05 for all,1). Treatment with THC and CBD alone or in combination for 42 h had no significant effect on the production of Aβ1–40 and Aβ1–42 in N2a/APPswe cells (p > 0.05 for all,
Figure 2C,D) although treatments with 10 and 100 nM of THC for 42 h were able to decrease the Aβ1–42 production in N2a/APPswe cells by 16% and 24%, respectively (1C,D) although treatments with 10 and 100 nM of THC for 42 h were able to decrease the Aβ1–42 production in N2a/APPswe cells by 16% and 24%, respectively (
Figure 2D).1D).
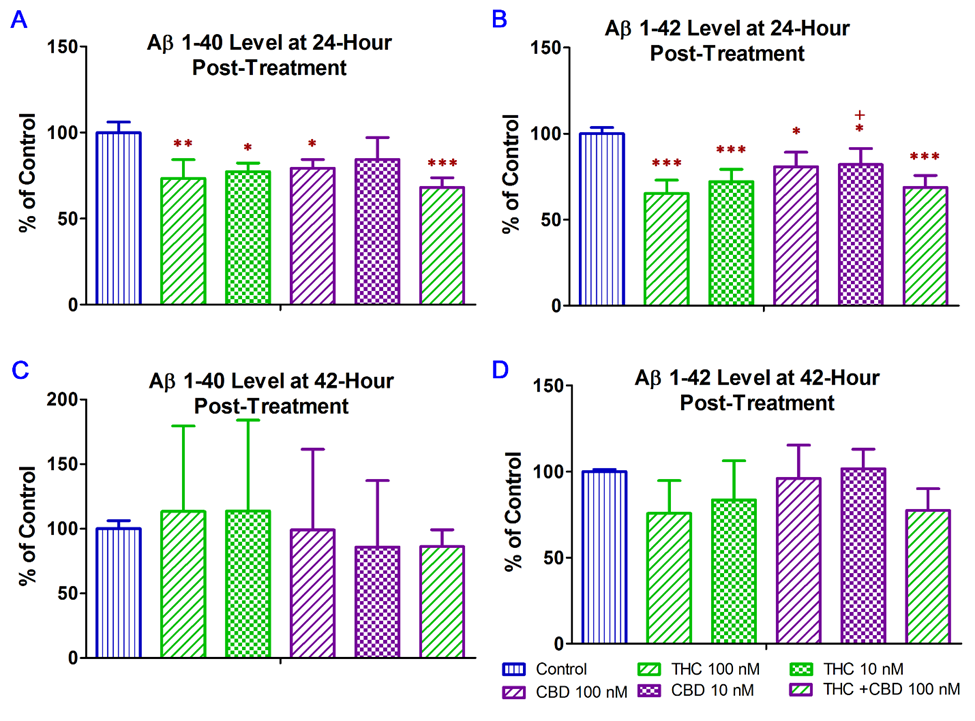
Effect of THC and CBD treatment alone or in combination on Aβ1–40 and Aβ1–42 production in N2a/APPswe cells at 24 (
A)for Aβ1–40; (
B)for Aβ1–42) and 42 (
C)for Aβ1–40; (
D) for Aβ1–42) hours after the treatment. The production of Aβ1–40 and Aβ 1–42 in the cell culture supernatant was determined by ELISA. After N2a/APPswe cells were treated with THC and CBD alone or in combination for 24 h, Aβ1–40 and Aβ 1–42 levels in the supernatant reduced significantly by 16~32% and 18~35%, respectively, compared with those in the non-treated control samples. No significant changes in the Aβ1–40 and Aβ 1–42 levels in the supernatant were found between the non-treated and treated samples after the 42-h treatment. Data are expressed as mean ± SD (N = 4). SD is denoted by the error bars. * p < 0.05, ** p < 0.01, and *** p < 0.001 compared with the control group and + p < 0.05 compared with the 100 nM THC treatment group using one-way ANOVA followed by the Tukey–Kramer post hoc multiple comparison test.) for Aβ1–42) hours after the treatment. The production of Aβ1–40 and Aβ 1–42 in the cell culture supernatant was determined by ELISA. After N2a/APPswe cells were treated with THC and CBD alone or in combination for 24 h, Aβ1–40 and Aβ 1–42 levels in the supernatant reduced significantly by 16~32% and 18~35%, respectively, compared with those in the non-treated control samples. No significant changes in the Aβ1–40 and Aβ 1–42 levels in the supernatant were found between the non-treated and treated samples after the 42-h treatment. Data are expressed as mean ± SD (N = 4). SD is denoted by the error bars. * p < 0.05, ** p < 0.01, and *** p < 0.001 compared with the control group and +p < 0.05 compared with the 100 nM THC treatment group using one-way ANOVA followed by the Tukey–Kramer post hoc multiple comparison test.
3. THC Treatment Improved Impaired Spatial Memory Performance of Aged APP/PS1 Mice
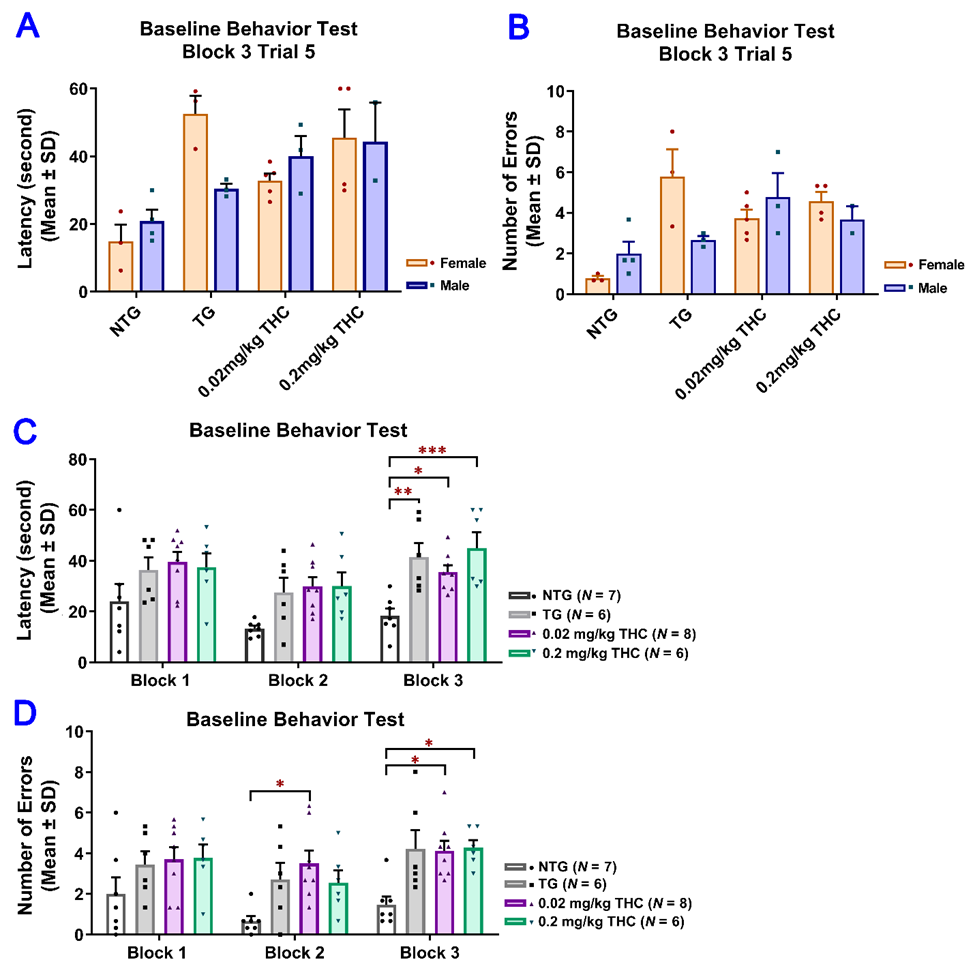
To evaluate the effect of low-dose THC exposure on the spatial reference memory of aged APP/PS1 transgenic mice, individual single-housed aged APP/PS1 transgenic mice were evaluated for the time taken to locate the escape platform (latency) and the number of errors using the RAWM test before and after vehicle or THC treatment and compared with the age-matched control of the non-transgenic (NTG) mice (Table S1). To evaluate the effect of low-dose THC exposure on the spatial reference memory of aged APP/PS1 transgenic mice, individual single-housed aged APP/PS1 transgenic mice were evaluated for the time taken to locate the escape platform (latency) and the number of errors using the RAWM test before and after vehicle or THC treatment and compared with the age-matched control NTG mice. There was no significant effect of sex on either the latency or number of errors before the start of the treatments, suggesting the insignificance of effect modification by sex (
Figure 3A,B). Therefore, the data from male and female mice were pooled for subsequent statistical analyses including the two-sample t test, one-way ANOVA with the post-hoc Bonferroni’s multiple comparisons test, and two-way ANOVA. Results of the two-way ANOVA for the baseline latency revealed a significant effect of time (F(2, 46) = 7.61, p = 0.0014) and group interaction (F(3, 23) = 7.24, p = 0.0014), while there was no significant effect for the time × group interaction (F(6, 46) = 0.759, p = 0.606). The post-hoc analysis indicated a significant difference in latency between the non-transgenic (NTG) control and individual transgenic groups, but no difference among the three transgenic groups in Trial 3 of the last block on Day 3 (2A,B). Therefore, the data from male and female mice were pooled for subsequent statistical analyses including the two-sample t test, one-way ANOVA with the post-hoc Bonferroni’s multiple comparisons test, and two-way ANOVA. Results of the two-way ANOVA for the baseline latency revealed a significant effect of time (F(2, 46) = 7.61, p = 0.0014) and group interaction (F(3, 23) = 7.24, p = 0.0014), while there was no significant effect for the time × group interaction (F(6, 46) = 0.759, p = 0.606). The post-hoc analysis indicated a significant difference in latency between the non-transgenic (NTG) control and individual transgenic groups, but no difference among the three transgenic groups in Trial 3 of the last block on Day 3 (
Figure 3C). Results of two-way ANOVA for the baseline number of errors also showed a significant effect of time (F(2, 46) = 3.84, p = 0.0286) and group interaction (F(3, 23) = 9.65, p = 0.0003), but not for the time × group interaction (F(6, 64) = 0.393, p =0.88). The post hoc analysis indicated a significant difference in the number of errors between the NTG control and transgenic 0.02 mg/kg THC group in Trial 3 of the last block on day 2 and between the NTG control and transgenic 0.02 mg/kg and 0.2 mg/kg THC groups in Trial 3 of the last block on day 3. No difference was found among the three transgenic groups in Trial 3 of the last block on day 3 (2C). Results of two-way ANOVA for the baseline number of errors also showed a significant effect of time (F(2, 46) = 3.84, p = 0.0286) and group interaction (F(3, 23) = 9.65, p = 0.0003), but not for the time × group interaction (F(6, 64) = 0.393, p =0.88). The post hoc analysis indicated a significant difference in the number of errors between the NTG control and transgenic 0.02 mg/kg THC group in Trial 3 of the last block on day 2 and between the NTG control and transgenic 0.02 mg/kg and 0.2 mg/kg THC groups in Trial 3 of the last block on day 3. No difference was found among the three transgenic groups in Trial 3 of the last block on day 3 (
Figure 3D). Taken together, it was demonstrated that the APP/PS1 mice displayed significant spatial memory deficits compared to the NTG mice before the THC treatment was initiated. The APP/PS1 mice were grouped based on the RAWM results so that there was no overt detectable difference in spatial memory among the three study groups.2D). Taken together, it was demonstrated that the APP/PS1 mice displayed significant spatial memory deficits compared to the NTG mice before the THC treatment was initiated. The APP/PS1 mice were grouped based on the RAWM results so that there was no overt detectable difference in spatial memory among the three study groups.

Evaluation of the baseline spatial reference memory of 14-month-old APP/PS1 mice in three study groups (i.e., the control transgenic control (TG), 0.02 mg/kg and 0.2 mg/kg THC treatment groups as well as 14-month-old non-transgenic (NTG) mice using the radial arm water maze (RAWM) test. Individual mice were subjected to five blocks of trials each day for three days with each block containing three trials. (
A) No significant difference in baseline latency between male and female mice within individual study groups (p = 0.56, p = 0.06, p = 0.51 and p = 0.947 for NTG, TG, 0.02 mg/kg and 0.2 mg/kg THC groups, respectively, using the Independent sample t test). () No significant difference in baseline latency between male and female mice within individual study groups (p = 0.56, p = 0.06, p = 0.51 and p = 0.947 for NTG, TG, 0.02 mg/kg and 0.2 mg/kg THC groups, respectively, using the Independent sample t test). (
B) No significant difference in baseline number of errors between male and female mice within individual study groups (p = 0.356, p = 0.299, p = 0.513, and p = 0.513 for NTG, TG, 0.02 mg/kg, and 0.2 mg/kg THC groups, respectively, using the Independent sample t test). () No significant difference in baseline number of errors between male and female mice within individual study groups (p = 0.356, p = 0.299, p = 0.513, and p = 0.513 for NTG, TG, 0.02 mg/kg, and 0.2 mg/kg THC groups, respectively, using the Independent sample t test). (
C) Significant increase in the baseline latency in TG (p < 0.01), 0.02 mg/kg THC (p < 0.05), and 0.2 mg/kg THC (p < 0.001) groups compared with the NTG control group in Trial 3 of the last block on day 3. () Significant increase in the baseline latency in TG (p < 0.01), 0.02 mg/kg THC (p < 0.05), and 0.2 mg/kg THC (p < 0.001) groups compared with the NTG control group in Trial 3 of the last block on day 3. (
D) Significant increase in the baseline latency in TG (p < 0.01), 0.02 mg/kg THC (p < 0.05), and 0.2 mg/kg THC (p < 0.001) groups compared with the NTG control group in Trial 3 of the last block on day 3. Data are expressed as mean ± SD. SD is denoted by the error bars. A comparison of mean latency and number of errors between female and male animals in individual study groups was made with multiple t-tests with correction for multiple comparisons using the Holm–Sidak method. Comparison of mean baseline latency and number of errors among different study groups were conducted using one-way ANOVA with the post hoc Bonferroni’s multiple comparisons test. * p < 0.05, ** p < 0.01, and *** p < 0.001 compared between the control NTG (N = 7), control TG (N = 6), 0.02 mg/kg THC (N = 8), and 0.2 mg/kg THC (N = 6) groups.) Significant increase in the baseline latency in TG (p < 0.01), 0.02 mg/kg THC (p < 0.05), and 0.2 mg/kg THC (p < 0.001) groups compared with the NTG control group in Trial 3 of the last block on day 3. Data are expressed as mean ± SD. SD is denoted by the error bars. A comparison of mean latency and number of errors between female and male animals in individual study groups was made with multiple t-tests with correction for multiple comparisons using the Holm–Sidak method. Comparison of mean baseline latency and number of errors among different study groups were conducted using one-way ANOVA with the post hoc Bonferroni’s multiple comparisons test. * p < 0.05, ** p < 0.01, and *** p < 0.001 compared between the control NTG (N = 7), control TG (N = 6), 0.02 mg/kg THC (N = 8), and 0.2 mg/kg THC (N = 6) groups.
Since the results of the RAWM test obtained after the 3-month vehicle or THC treatment indicated that the effect of sex on either the latency or number of errors was not significant, the data from male and female mice were pooled for subsequent statistical analyses (
Figure 4A,B). Results of two-way ANOVA for the latency revealed a significant main effect of treatment (F(3, 23) = 10.51, p < 0.001) and time (F(4, 92) = 10.41, p < 0.001), but not for the time × treatment interaction (F(12, 92) = 1.14, p = 0.338). Results of two-way ANOVA for the number of errors showed a significant main effect of treatment (F(3, 23) = 16.74, p < 0.001) and the time × treatment interaction (F(12, 92) = 2.28, p = 0.014), but not for the time (F(4, 92) = 1.30, p = 0.277). Results of one-way ANOVA with post hoc Bonferroni’s multiple comparisons test demonstrated that the vehicle-treated aged APP/PS1 mice took a significantly longer time to locate the escape platform and made more errors than the aged NTG mice during the last three interval-separating blocks of training trials (p < 0.001.3A,B). Results of two-way ANOVA for the latency revealed a significant main effect of treatment (F(3, 23) = 10.51, p < 0.001) and time (F(4, 92) = 10.41, p < 0.001), but not for the time × treatment interaction (F(12, 92) = 1.14, p = 0.338). Results of two-way ANOVA for the number of errors showed a significant main effect of treatment (F(3, 23) = 16.74, P < 0.001) and the time × treatment interaction (F(12, 92) = 2.28, p = 0.014), but not for the time (F(4, 92) = 1.30, p = 0.277). Results of one-way ANOVA with post hoc Bonferroni’s multiple comparisons test demonstrated that the vehicle-treated aged APP/PS1 mice took a significantly longer time to locate the escape platform and made more errors than the aged NTG mice during the last three interval-separating blocks of training trials (p < 0.001.
Figure 4C,D). In contrast, in Trial 5 Block 5, APP/PS1 mice treated with 0.02 and 0.2 mg/kg THC showed a significant decrease in the latency and number of errors compared with the vehicle group (p < 0.01 and p < 0.001 for 0.02 mg/kg and 0.2 mg/kg THC groups, respectively). No significant differences in the latency and number of errors were observed between the THC-treated APP/PS1 mice and aged NTG control mice (3C,D). In contrast, in Trial 5 Block 5, APP/PS1 mice treated with 0.02 and 0.2 mg/kg THC showed a significant decrease in the latency and number of errors compared with the vehicle group (p < 0.01 and p < 0.001 for 0.02 mg/kg and 0.2 mg/kg THC groups, respectively). No significant differences in the latency and number of errors were observed between the THC-treated APP/PS1 mice and aged NTG control mice (
Figure 4C,D). These observations indicate that the spatial learning and memory of THC-treated APP/PS mice were superior to those of the vehicle-treated APP/PS1 mice and comparable to those of the NTG control mice. Overall, the superiority of THC-treated APP/PS1 mice over the control APP/PS1 mice was evident in that the control APP/PS1 mice consistently exhibited inferior acquisition with little improvement in the spatial memory throughout the RAWM test sessions, while the performance of THC-treated APP/PS1 mice improved markedly over the same training period. In addition, no significant difference in latencies and number of errors was found between the NTG control mice and THC-treated APP/PS1 mice (p > 0.05.3C,D). These observations indicate that the spatial learning and memory of THC-treated APP/PS mice were superior to those of the vehicle-treated APP/PS1 mice and comparable to those of the NTG control mice. Overall, the superiority of THC-treated APP/PS1 mice over the control APP/PS1 mice was evident in that the control APP/PS1 mice consistently exhibited inferior acquisition with little improvement in the spatial memory throughout the RAWM test sessions, while the performance of THC-treated APP/PS1 mice improved markedly over the same training period. In addition, no significant difference in latencies and number of errors was found between the NTG control mice and THC-treated APP/PS1 mice (p > 0.05.
Figure 4C,D), implicating that the memory deficits in aged APP/PS1 mice are reversed with THC treatment.3C,D), implicating that the memory deficits in aged APP/PS1 mice are reversed with THC treatment.
Evaluation of the effect of THC treatment on improving the spatial reference memory of 14-month-old APP/PS1 mice using the RAWM test. Individual mice were subjected to five trials per day for 15 consecutive days with each block containing 15 trials. (
A) No significant difference in latency between male and female mice within individual study groups in Trial 5 of Block 5 (p = 0.998, p = 0.996, p = 0.998, and p = 0.996 for NTG, TG, 0.02 mg/kg, and 0.2 mg/kg THC groups, respectively, using the Independent sample t test). () No significant difference in latency between male and female mice within individual study groups in Trial 5 of Block 5 (p = 0.998, p = 0.996, p = 0.998, and p = 0.996 for NTG, TG, 0.02 mg/kg, and 0.2 mg/kg THC groups, respectively, using the Independent sample t test). (
B) No significant difference in number of errors between male and female mice within individual study groups in Trial 5 of Block 5 (p = 0.992, p = 0.979, p = 0.992, and p = 0.992 for NTG, TG, 0.02 mg/kg, and 0.2 mg/kg THC groups, respectively, using the Independent sample t test). () No significant difference in number of errors between male and female mice within individual study groups in Trial 5 of Block 5 (p = 0.992, p = 0.979, p = 0.992, and p = 0.992 for NTG, TG, 0.02 mg/kg, and 0.2 mg/kg THC groups, respectively, using the Independent sample t test). (
C) Significant decrease in the latency in NTG control (p < 0.001), 0.02 mg/kg THC (p < 0.01, and 0.2 mg/kg THC (p < 0.001) groups compared with the TG control group in Block 5 Trial 5. Significant decrease in latency was also found in the NTG control (p < 0.001) and 0.2 mg/kg THC (p < 0.05) groups compared to the TG control group in Block 4 Trial 5. () Significant decrease in the latency in NTG control (p < 0.001), 0.02 mg/kg THC (p < 0.01, and 0.2 mg/kg THC (p < 0.001) groups compared with the TG control group in Block 5 Trial 5. Significant decrease in latency was also found in the NTG control (p < 0.001) and 0.2 mg/kg THC (p < 0.05) groups compared to the TG control group in Block 4 Trial 5. (
D) Significant decrease in the number of errors in 0.02 mg/kg THC (p < 0.01) and 0.2 mg/kg THC (p < 0.001) groups compared with the TG control group in Block 5 Trial 5. Significant decrease in the number of errors was also found in the NTG control (p < 0.001) and 0.2 mg/kg THC (p < 0.01) groups compared with the TG control group in Block 4 Trial 5. Data are expressed as mean ± SD. SD is denoted by the error bars. Comparison of mean latency and number of errors between female and male animals in individual study groups was made by multiple t-tests with correction for multiple comparisons using the Holm–Sidak method. Comparison of mean latency and number of errors among different study groups were made using one-way ANOVA with post hoc Bonferroni’s multiple comparisons test. * p < 0.05, ** p < 0.01 and *** p < 0.001 compared between the control NTG (N = 7), control TG (N = 6), 0.02 mg/kg THC (N = 8), and 0.2 mg/kg THC (N = 6) groups.) Significant decrease in the number of errors in 0.02 mg/kg THC (p < 0.01) and 0.2 mg/kg THC (p < 0.001) groups compared with the TG control group in Block 5 Trial 5. Significant decrease in the number of errors was also found in the NTG control (p < 0.001) and 0.2 mg/kg THC (p < 0.01) groups compared with the TG control group in Block 4 Trial 5. Data are expressed as mean ± SD. SD is denoted by the error bars. Comparison of mean latency and number of errors between female and male animals in individual study groups was made by multiple t-tests with correction for multiple comparisons using the Holm–Sidak method. Comparison of mean latency and number of errors among different study groups were made using one-way ANOVA with post hoc Bonferroni’s multiple comparisons test. * p < 0.05, ** p < 0.01 and *** p < 0.001 compared between the control NTG (N = 7), control TG (N = 6), 0.02 mg/kg THC (N = 8), and 0.2 mg/kg THC (N = 6) groups.
4. THC Treatment Resulted in Decreased Oligomeric Aβ Levels in Hippocampi of APP/PS1 Mice
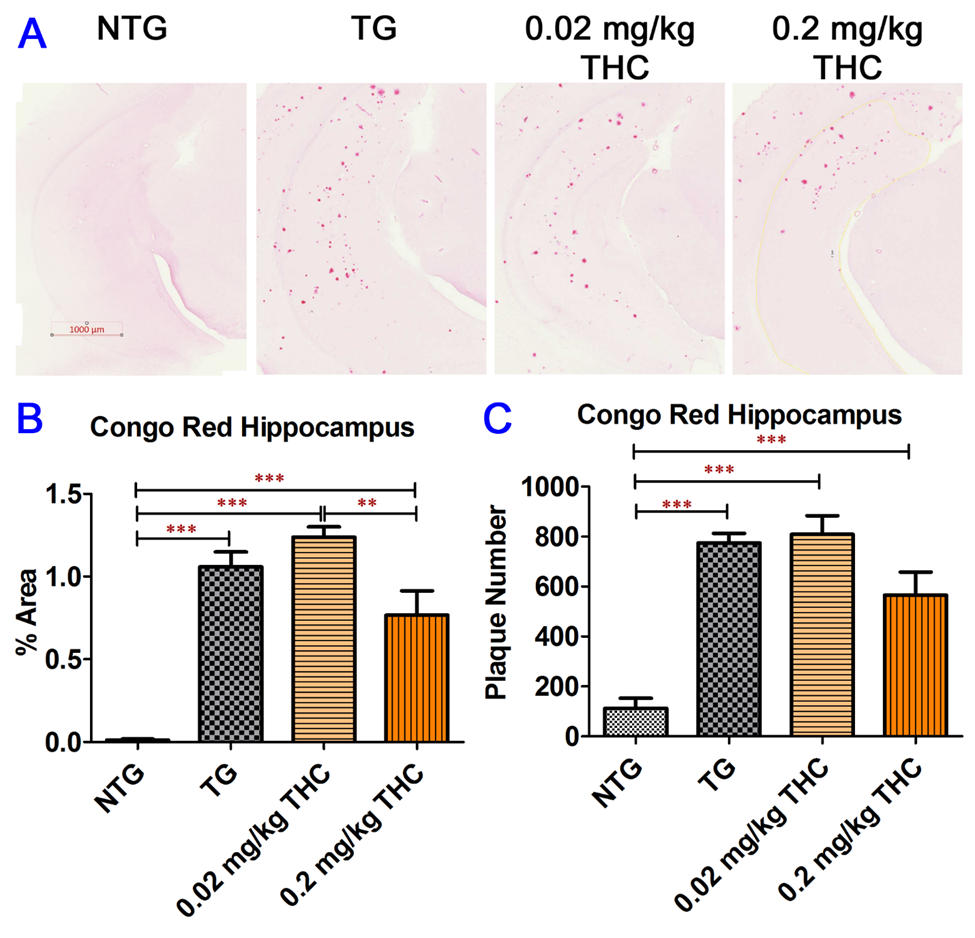
Congo Red staining of Aβ plaques in mouse hippocampi. (
A) Representative Congo Red staining images acquired under light microscopy. (
B) Quantification of Congo red staining shown as the percentage of Congo red-positive area compared to the hippocampus tissue area per field. (
C) Quantification of Congo red staining shown as the number of Congo red stained plague in the hippocampus area. The non-transgenic (NTG) mice had significantly fewer Aβ plaques than all the APP/PS1 transgenic (TG) mice regardless of treatment (p < 0.001 for all). No significant differences in Aβ plaque area and number of Aβ plaques were found between the vehicle control and 0.02 or 0.2 mg/kg THC treated APP/PS1 mice. However, the Aβ plaque area in hippocampi sections of APP/PS1 mice treated with 0.2 mg/kg THC was significantly lower than those treated with 0.02 mg/kg THC (p < 0.01). Data are expressed as mean ± SD (N = 7 for the control NTG group, N = 6 for the control TG, and 0.2 mg/kg THC groups, and N = 8 for the 0.02 mg/kg THC group). Error bars denote the SD. ** p < 0.01 and *** p < 0.001 compared between the control NTG mice, control APP/PS1 mice, and APP/PS1 mice treated with 0.02 and 0.2 mg/kg THC using one-way ANOVA followed by the Tukey–Kramer post hoc multiple comparison test.) Quantification of Congo red staining shown as the number of Congo red stained plague in the hippocampus area. The non-transgenic (NTG) mice had significantly fewer Aβ plaques than all the APP/PS1 transgenic (TG) mice regardless of treatment (p < 0.001 for all). No significant differences in Aβ plaque area and number of Aβ plaques were found between the vehicle control and 0.02 or 0.2 mg/kg THC treated APP/PS1 mice. However, the Aβ plaque area in hippocampi sections of APP/PS1 mice treated with 0.2 mg/kg THC was significantly lower than those treated with 0.02 mg/kg THC (p < 0.01). Data are expressed as mean ± SD (N = 7 for the control NTG group, N = 6 for the control TG, and 0.2 mg/kg THC groups, and N = 8 for the 0.02 mg/kg THC group). Error bars denote the SD. ** p < 0.01 and *** p < 0.001 compared between the control NTG mice, control APP/PS1 mice, and APP/PS1 mice treated with 0.02 and 0.2 mg/kg THC using one-way ANOVA followed by the Tukey–Kramer post hoc multiple comparison test.
5. Conclusions
References
- Mechoulam, R.; Hanuš, L.O.; Pertwee, R.; Howlett, A.C. Early phytocannabinoid chemistry to endocannabinoids and beyond. Nat. Rev. Neurosci. 2014, 15, 757–764.
- Nelson, K.M.; Bisson, J.; Singh, G.; Graham, J.G.; Chen, S.-N.; Friesen, J.B.; Dahlin, J.L.; Niemitz, M.; Walters, M.A.; Pauli, G.F. The Essential Medicinal Chemistry of Cannabidiol (CBD). J. Med. Chem. 2020, 63, 12137–12155.
- Ashton, C.H. Pharmacology and effects of cannabis: A brief review. Br. J. Psychiatry J. Ment. Sci. 2001, 178, 101–106.
- Esposito, G.; De Filippis, D.; Carnuccio, R.; Izzo, A.; Iuvone, T. The marijuana component cannabidiol inhibits β-amyloid-induced tau protein hyperphosphorylation through Wnt/β-catenin pathway rescue in PC12 cells. Klin. Wochenschr. 2006, 84, 253–258.
- Maroon, J.; Bost, J. Review of the neurological benefits of phytocannabinoids. Surg. Neurol. Int. 2018, 9, 91.
- Corrada, M.M.; Brookmeyer, R.; Paganini-Hill, A.; Berlau, D.; Kawas, C.H. Dementia incidence continues to increase with age in the oldest old: The 90+ study. Ann. Neurol. 2010, 67, 114–121.
- Polanco, J.C.; Li, C.; Bodea, L.-G.; Mármol, R.M.; Meunier, F.A.; Götz, J. Amyloid-β and tau complexity—Towards improved biomarkers and targeted therapies. Nat. Rev. Neurol. 2018, 14, 22–39.
- DeTure, M.A.; Dickson, D.W. The neuropathological diagnosis of Alzheimer’s disease. Mol. Neurodegener. 2019, 14, 32.
- Ewers, M.; Sperling, R.A.; Klunk, W.E.; Weiner, M.W.; Hampel, H. Neuroimaging markers for the prediction and early diagnosis of Alzheimer’s disease dementia. Trends Neurosci. 2011, 34, 430–442.
- Sevigny, J.; Chiao, P.; Bussière, T.; Weinreb, P.H.; Williams, L.; Maier, M.; Dunstan, R.; Salloway, S.; Chen, T.; Ling, Y.; et al. The antibody aducanumab reduces Aβ plaques in Alzheimer’s disease. Nature 2016, 537, 50–56.
- Tucker, S.; Möller, C.; Tegerstedt, K.; Lord, A.; Laudon, H.; Sjödahl, J.; Söderberg, L.; Spens, E.; Sahlin, C.; Waara, E.R.; et al. The Murine Version of BAN2401 (mAb158) Selectively Reduces Amyloid-β Protofibrils in Brain and Cerebrospinal Fluid of tg-ArcSwe Mice. J. Alzheimer’s Dis. 2014, 43, 575–588.
- Watt, G.; Karl, T. In vivo Evidence for Therapeutic Properties of Cannabidiol (CBD) for Alzheimer’s Disease. Front. Pharmacol. 2017, 8, 20.
- Janefjord, E.; Maag, J.L.; Harvey, B.S.; Smid, S.D. Cannabinoid Effects on β Amyloid Fibril and Aggregate Formation, Neuronal and Microglial-Activated Neurotoxicity In Vitro. Cell. Mol. Neurobiol. 2013, 34, 31–42.
- Scuderi, C.; Steardo, L.; Esposito, G. Cannabidiol Promotes Amyloid Precursor Protein Ubiquitination and Reduction of Beta Amyloid Expression in SHSY5Y APP+ Cells Through PPARγ Involvement. Phytother. Res. 2014, 28, 1007–1013.
- Esposito, G.; De Filippis, D.; Maiuri, M.C.; De Stefano, D.; Carnuccio, R.; Iuvone, T. Cannabidiol inhibits inducible nitric oxide synthase protein expression and nitric oxide production in β-amyloid stimulated PC12 neurons through p38 MAP kinase and NF-κB involvement. Neurosci. Lett. 2006, 399, 91–95.
- Martín-Moreno, A.M.; Reigada, D.; Ramírez, B.G.; Mechoulam, R.; Innamorato, N.; Cuadrado, A.; de Ceballos, M.L. Cannabidiol and Other Cannabinoids Reduce Microglial Activation In Vitro and In Vivo: Relevance to Alzheimer’s Disease. Mol. Pharmacol. 2011, 79, 964–973.
- Harvey, B.S.; Ohlsson, K.S.; Maag, J.; Musgrave, I.; Smid, S. Contrasting protective effects of cannabinoids against oxidative stress and amyloid-β evoked neurotoxicity in vitro. NeuroToxicology 2012, 33, 138–146.
- Cheng, D.; Spiro, A.S.; Jenner, A.M.; Garner, B.; Karl, T. Long-Term Cannabidiol Treatment Prevents the Development of Social Recognition Memory Deficits in Alzheimer’s Disease Transgenic Mice. J. Alzheimer’s Dis. 2014, 42, 1383–1396.
- Esposito, G.; Scuderi, C.; Savani, C.; Steardo, L., Jr.; De Filippis, D.; Cottone, P.; Iuvone, T.; Cuomo, V.; Steardo, L. Cannabidiol in vivo blunts β-amyloid induced neuroinflammation by suppressing IL-1β and iNOS expression. Br. J. Pharmacol. 2007, 151, 1272–1279.
- Esposito, G.; Scuderi, C.; Valenza, M.; Togna, G.I.; Latina, V.; De Filippis, D.; Cipriano, M.; Carratù, M.R.; Iuvone, T.; Steardo, L. Cannabidiol Reduces Aβ-Induced Neuroinflammation and Promotes Hippocampal Neurogenesis through PPARγ Involvement. PLoS ONE 2011, 6, e28668.
- Aso, E.; Sánchez-Pla, A.; Vegas-Lozano, E.; Maldonado, R.; Ferrer, I. Cannabis-Based Medicine Reduces Multiple Pathological Processes in AβPP/PS1 Mice. J. Alzheimer’s Dis. 2014, 43, 977–991.
- Aso, E.; Andrés-Benito, P.; Ferrer, I. Delineating the Efficacy of a Cannabis-Based Medicine at Advanced Stages of Dementia in a Murine Model. J. Alzheimer’s Dis. 2016, 54, 903–912.
- Casarejos, M.J.; Perucho, J.; Gomez, A.; Muñoz, M.P.; Fernandez-Estevez, M.; Sagredo, O.; Ruiz, J.F.; Guzman, M.; de Yebenes, J.G.; Mena, M.A. Natural Cannabinoids Improve Dopamine Neurotransmission and Tau and Amyloid Pathology in a Mouse Model of Tauopathy. J. Alzheimer’s Dis. 2013, 35, 525–539.
- Cao, C.; Li, Y.; Liu, H.; Bai, G.; Mayl, J.; Lin, X.; Sutherland, K.; Nabar, N.; Cai, J. The Potential Therapeutic Effects of THC on Alzheimer’s Disease. J. Alzheimer’s Dis. 2014, 42, 973–984.
- Bilkei-Gorzo, A.; Albayram, O.; Draffehn, A.; Michel, K.; Piyanova, A.; Oppenheimer, H.; Dvir-Ginzberg, M.; Rácz, I.; Ulas, T.; Imbeault, S.; et al. A chronic low dose of Δ9-tetrahydrocannabinol (THC) restores cognitive function in old mice. Nat. Med. 2017, 23, 782–787.
- Nidadavolu, P.; Bilkei-Gorzo, A.; Krämer, M.; Schürmann, B.; Palmisano, M.; Beins, E.C.; Madea, B.; Zimmer, A. Efficacy of Δ9-Tetrahydrocannabinol (THC) Alone or in Combination with a 1:1 Ratio of Cannabidiol (CBD) in Reversing the Spatial Learning Deficits in Old Mice. Front. Aging Neurosci. 2021, 13, 560.
- Sarne, Y.; Toledano, R.; Rachmany, L.; Sasson, E.; Doron, R. Reversal of age-related cognitive impairments in mice by an extremely low dose of tetrahydrocannabinol. Neurobiol. Aging 2018, 61, 177–186.
- Mori, H.; Takio, K.; Ogawara, M.; Selkoe, D.J. Mass spectrometry of purified amyloid beta protein in Alzheimer’s disease. J. Biol. Chem. 1992, 267, 17082–17086.
- Jarrett, J.T.; Berger, E.P.; Lansbury, P.T., Jr. The carboxy terminus of the beta. amyloid protein is critical for the seeding of amyloid formation: Implications for the pathogenesis of Alzheimer’s disease. Biochemistry 1993, 32, 4693–4697.
- Attems, J.; Lintner, F.; Jellinger, K.A. Amyloid β peptide 1-42 highly correlates with capillary cerebral amyloid angiopathy and Alzheimer disease pathology. Acta Neuropathol. 2004, 107, 283–291.
- Dickey, C.A.; Loring, J.F.; Montgomery, J.; Gordon, M.N.; Eastman, P.S.; Morgan, D. Selectively Reduced Expression of Synaptic Plasticity-Related Genes in Amyloid Precursor Protein + Presenilin-1 Transgenic Mice. J. Neurosci. 2003, 23, 5219–5226.
- Ewers, M.; Morgan, D.G.; Gordon, M.N.; Woodruff-Pak, D.S. Associative and motor learning in 12-month-old transgenic APP+PS1 mice. Neurobiol. Aging 2006, 27, 1118–1128.