Festuca indigesta Boiss. is a polyploid Iberian−Maghreb species, which, in the Iberian Peninsula, is represented by the subsp. indigesta. This taxon has great ecological importance and dominates many plant communities that characterize the high mountains of southeastern Spain, where it is endemic. This study investigates the cytogenetic variability throughout the geographic range of this taxon, the possible edaphic preferences of each cytotype, and the morphological variation of cytotypes. The flow cytometry analyzes and chromosome counting reveal a high cytogenetic diversity in the taxon (6x, 8x and 12x). Morphological differences associated with cytogenetic variability were detected. We found no relationship between substrate type and cytotype. Our results suggest that each mountain range could act as a reservoir of morphologically cryptic genetic diversity regarding this taxon.
1. Introduction
Festuca L. (Poaceae) is, from the phylogenetic, morphological, and cytogenetic perspective, considered to be a complex genus. One of the main driving forces behind its diversification has been postulated as being polyploidization events
[1]. The genus includes many polyploid species (about 70%) and comprises a large variation in cytotypes, ranging from 2n = 2
x = 14 to 2n = 14
x = 98
[2]. In the Iberian territory, a great taxonomic diversity of the genus is concentrated in the Baetic Range (southeast of Spain), which harbors several endemic fescues. The orographic diversity of the Baetic Cordillera, together with the variability of temperatures and edaphic conditions, provided numerous opportunities for the occurrence of hybridization and stimulated the emergence of polyploids, leading to the formation of new entities
[3]. Some studies have shown that substrate type affinity also represents a major driver of plant evolutionary diversification
[4][5][6][4,5,6]. This fact is quite evident in the genus
Festuca, as many endemic species show a strong preference for either calcareous or siliceous substrate (substrate specificity)
[7]. In the Baetic mountain range, most of these taxa tend to be concentrated in disjunct mountains, also called “highland islands”
[8], where the vegetation is composed mainly of xerophytic shrubs and open hard-leaved grasslands on poorly developed calcareous or siliceous soils. Not surprisingly, this territory is one of the most important hotspots of plant diversity in the Mediterranean Basin, with the two main endemic centers being Sierra Nevada and Serranía de Ronda
[9].
Festuca indigesta Boiss.
(Festuca sect.
Festuca) is a polyploid Iberian−Maghreb species, which, in the Iberian Peninsula, is represented by the subsp.
indigesta. This taxon has great ecological importance and dominates many plant communities that characterize the high mountains of southeastern Spain, where it is endemic
[7]. Since it was described by Boissier
[10], it has been assumed that the taxon is distributed throughout the siliceous oro-mediterranean bioclimatic belt (at 1800–2800 m.a.s.l.) of the Sierra Nevada National Park (provinces of Granada and Almería). In terms of lithology, this area mostly consists of dark schist and feldspar-bearing mica-schists from the Nevado-Filabride metamorphic complex
[11]. However, this taxon was recently also found in calcareous mountains (
Figure 1)
[7][12][7,12].
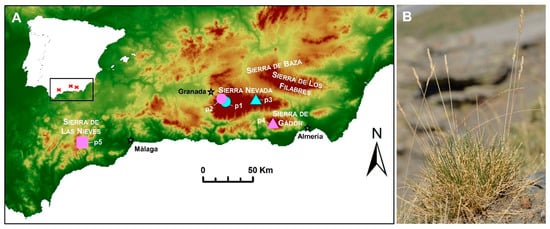
Figure 1. (A) Location of the sampled populations of Festuca indigesta subsp. indigesta in Spain (p1–p4). The three main mountain ranges (Sierra Nevada, Sierra de Gádor, and Sierra de las Nieves) where the subspecies is found are highlighted. Ploidy levels detected in each population are represented by symbols (hexaploid, circles; octoploid, triangles; and dodecaploid, square) and substrate nature by colors (siliceous, blue; and calcareous, pink). Variation in elevation is indicated by a gradient color map. p1, Peñones de San Francisco; p2, Collado de Las Sabinas; p3, Puerto de la Ragua; p4, Sierra de Gádor; p5, Sierra de las Nieves. (B) Habit of Festuca indigesta subsp. indigesta.
2. Genome Size, DNA Ploidy Level, and Chromosome Numbers
This
enst
rudy shows that
F. indigesta subsp.
indigesta is formed of a polyploid series that comprises hexaploid (2n=6
x=42), octoploid (2n=8
x=56), and dodecaploid (2n=12
x=84) individuals (
Figure 2). Moreover, genome size estimations confirmed these cytotypes, with values (ranging from 12.99 to 25.33 pg/2C), which were quite similar to those obtained in closer
Festuca taxa
[2][13][14][15][2,21,22,23].
ReseaOur
chers' study provides additional data to those previously carried out and supports flow cytometry as a reliable method to estimate ploidy levels in the
Festuca genus. It is not uncommon to find cytogenetic variability at the intraspecific level in the Poaceae family (e.g.,
[16][17][13][14][15][18,20,21,22,23]), and different chromosome numbers have even been found in subspecies of
Festuca with great taxonomic complexity
[2][17][13][2,20,21]. In addition to the already known hexaploid level
[18][19][20][24,25,26], the octoploid level was detected in
our
esearchers' study.
ResearchersWe found the octoploid level in all the samples from Puerto de La Ragua, and in those from the Sierra de Gádor, for which no cytogenetic data have been available until now. The dodecaploid level is new to the species and was found in the western populations. These data represent the second record of this ploidy level in the genus (the first was detected in
F. yvesii subsp.
summilusitana [2]). The decaploid level that would complete the chromosome series (2n = 6
x–12
x) has not been found in
our
esearchers' study.
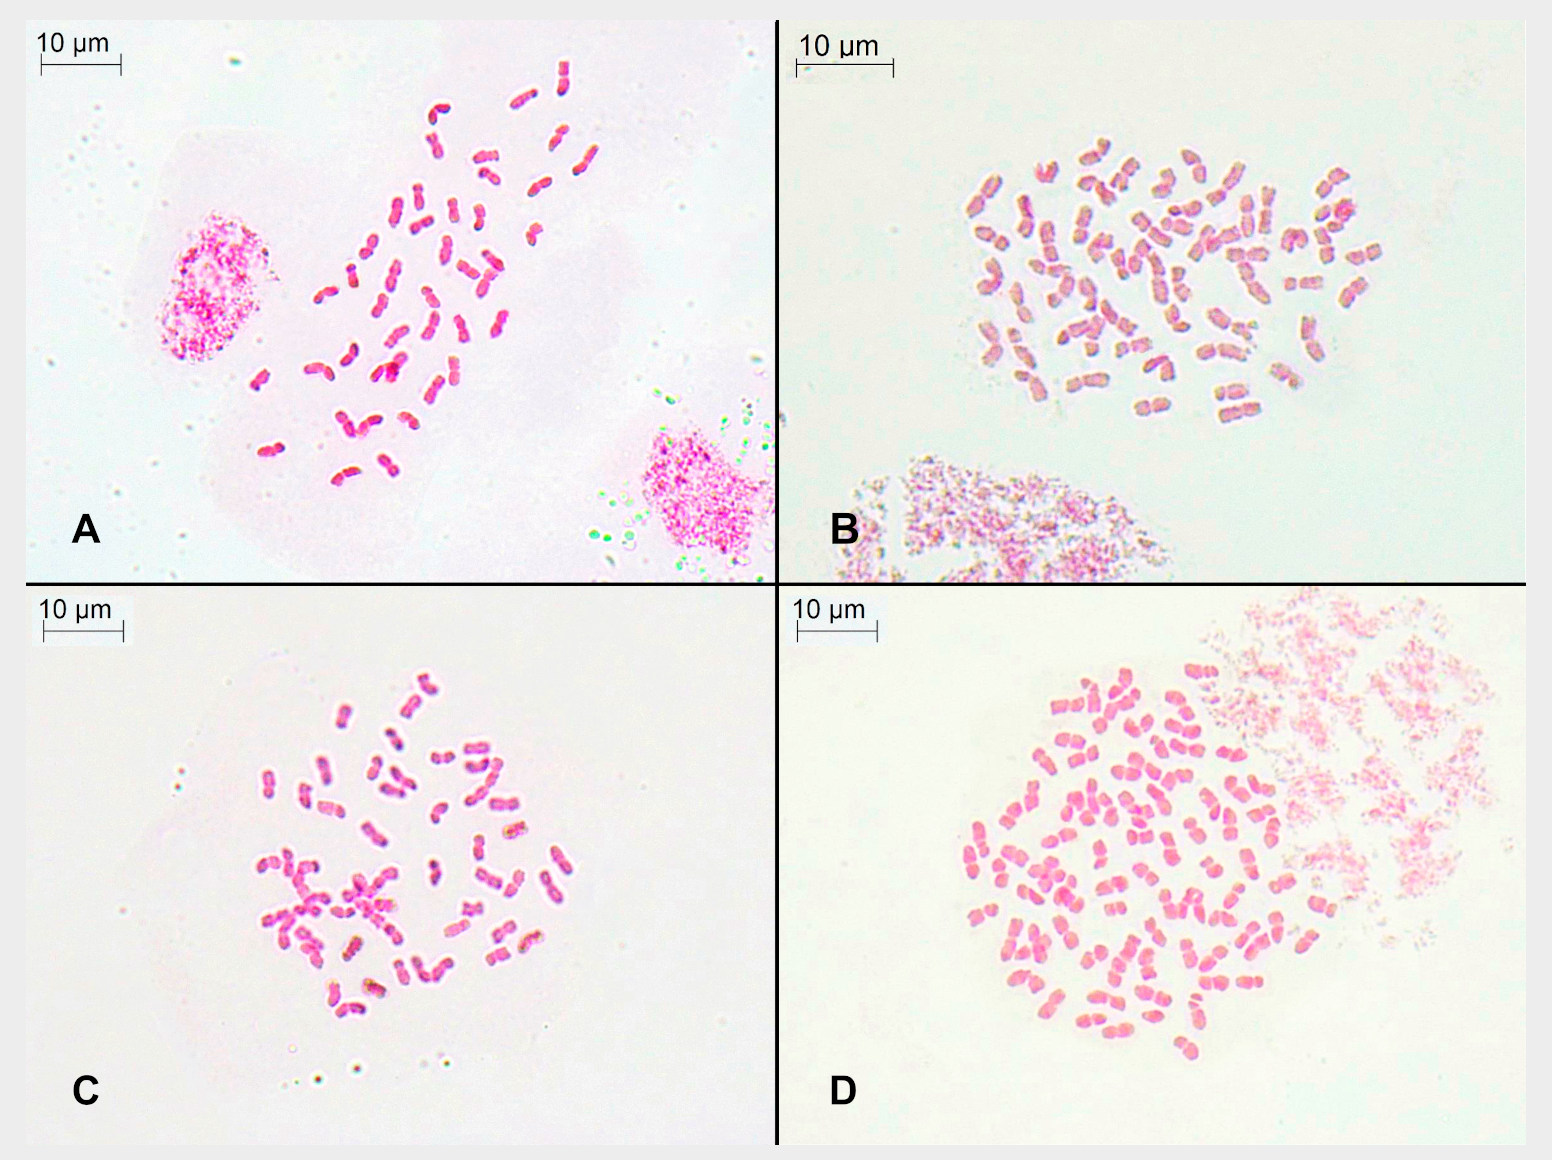 Figure 2.
 Somatic metaphase of individuals from the sampled populations: (
A) Collado de Las Sabinas, p2 (2n = 6
x = 42 chromosomes); (
B) Puerto de la Ragua, p3 (2n = 8
x = 56 chromosomes); (
C) Sierra de Gádor, p4 (2n = 8
x = 56 chromosomes); and (
D) Sierra de las Nieves, p5 (2n = 12
x = 84 chromosomes).

3. Cytotype Distribution and Ecological Parameters
A geographical distribution pattern of the cytotypes was observed. The easternmost part of the Baetic mountain range hosts a mosaic of hexaploid and octoploid populations, with the hexaploids occupying a narrower niche in the Nevadense core, with the octoploids having a more extensive distribution to the east, while the dodecaploids exclusively inhabit the western disjunct mountains. All populations showed cytotype uniformity (i.e., no mixed ploidy populations were detected). Although the chemical composition of the rocks can trigger evolutionary divergence and have an important influence on the flora and vegetation
[4][5][6][21][22][4,5,6,27,28], the distribution and diversity of cytotypes of
F. indigesta subsp.
indigesta did not show any patterns associated with the substrate nature (or the lithological group). Hexaploids and octoploids were able to grow on siliceous and calcareous bedrock, although dodecaploids were only found on calcareous bedrock. The lack of cytotype-specific associations with substrate type has also been detected in other plant groups (e.g.,
Brassica arenosa group) in which random colonization processes and genetic drift could have played a role in cytotype segregation
[23][29]. In fact, this parameter could be less restrictive for the presence and growth of
F. indigesta subsp.
indigesta than has previously been assumed, as it is capable of growing in a wide range of edaphic conditions. The limiting factors for the survival of the subspecies are probably the bioclimatic profile (i.e., elevational gradient) and the habitat type. These types of ecosystems where the subspecies grows are particularly sensitive to slight climatic changes and to different types of human impact or pressures
[24][30]. Given the peculiarity and fragility of these ecosystems, germplasm banks and conservation plans should consider the entire cytogenetic variability detected for the subspecies.
4. Morphological Variation among Cytotypes
Polyploidy is positively related to the size of the morphological characters in many plant groups
[25][31]. However, the morphological differences among cytotypes of the same taxon (species or subspecies) are, in many cases, not very clear, as has been seen previously in many complex taxonomic groups
[2][16][26][27][2,18,32,33]. In this
enst
rudy, a notable morphological difference between hexaploid and dodecaploid individuals was observed (
Figure 3), with octoploids being difficult to distinguish from the former cytotypes owing to an overlapping gradient of variation. The morphological differences among the ploidy levels are not sufficiently great to be able to fully distinguish the cytotypes, as a broad overlap among cytotypes was observed, even for the most discriminant morphological characters (e.g., lengths of spikelet, lemma, glumes, anthers, and stomata). There are high levels of phenotypic variation in the species of
Festuca, which are probably related to the relatively recent diversification (in the Pleistocene, ca. 2 Ma
[28][34]) and with an ongoing differentiation
[2][7][2,7]. The length of the stomatal guard cell pairs has been used to predict ploidy level in many groups of grasses
[29][30][35,36], but the wide variation in the size within each ploidy level makes the use of this inference very difficult in the case of
Festuca. Moreover, the size (and density) of the stomata may also be associated with environmental variables, which may mask the effect of whole genome duplications
[31][32][37,38]. The cytotype diversity found throughout the distribution range of
F. indigesta subsp.
indigesta, coupled with the absence of spatial overlap among cytotypes at the intrapopulation level, suggests that the mountains of the Baetic Cordillera may act as evolutionary laboratories that could play a significant role in promoting the genetic diversification of the taxon, which is not clearly perceived morphologically by its recent evolutionary history.
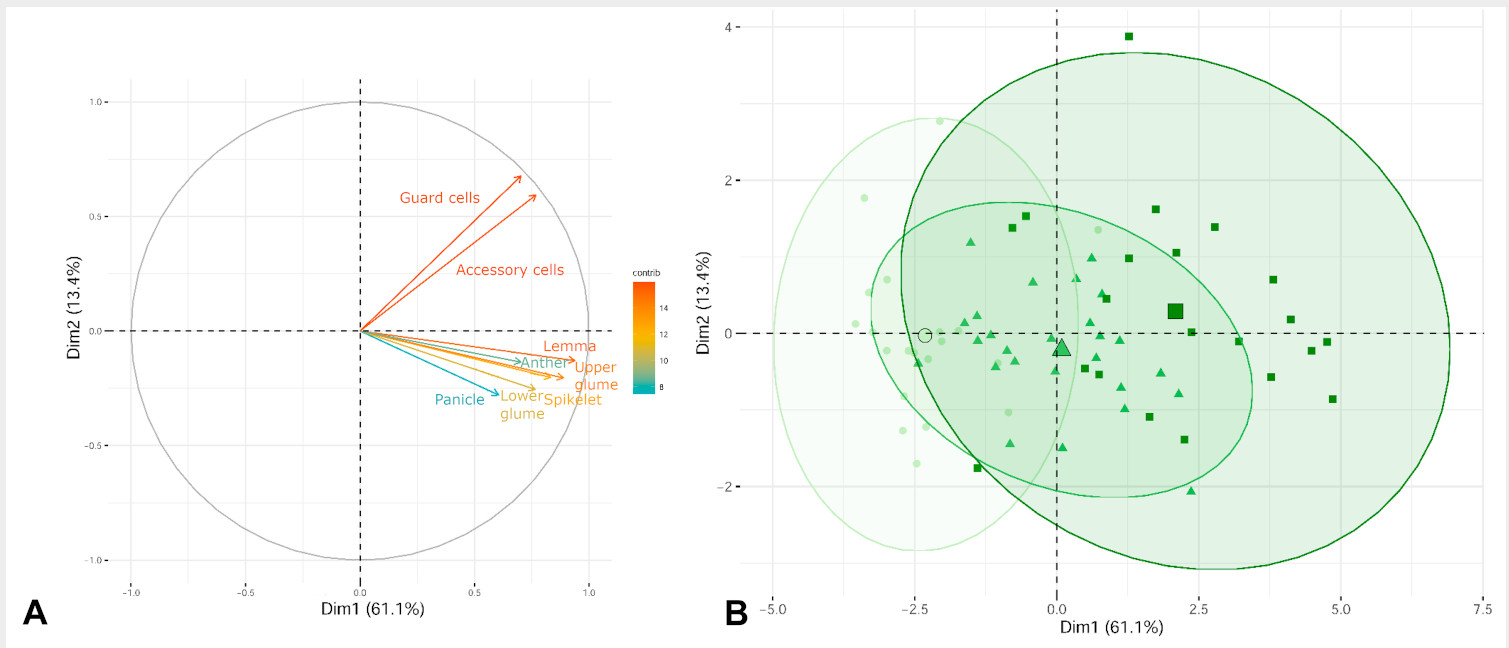
Figure 3. Principal components analysis (PCA). (A) Explanatory variables (n = 8) are shown as vectors and the most contributing variables are highlighted on the correlation plot. (B) Biplot of the principal component analysis PC1 vs. PC2. A 95% confidence ellipse for each grouping is shown around each group centroid (the largest symbol of each ellipse). The three different ploidy levels are represented by a green gradient and by symbols (6x individuals, circles; 8x individuals, triangles; and 12x individuals, squares).