Your browser does not fully support modern features. Please upgrade for a smoother experience.
Please note this is a comparison between Version 2 by Rita Xu and Version 1 by Xudong Sun.
The LATERAL ORGAN BOUNDARIES DOMAIN (LBD) gene family comprises plant-specific transcription factors that control cell proliferation and differentiation during growth and development in many plant species. However, to date, no studies of the LBD gene family in Dendrobium catenatum have been reported.
- Dendrobium catenatum
- LBD transcription factor family
- phylogenetic analysis
1. Introduction
The LATERAL ORGAN BOUNDARIES DOMAIN (LBD) transcription factors play important roles in the growth and development of many plant species. LBD genes are involved in the initiation, growth, metabolic regulation, and secondary growth of roots, stems, leaves, and corollas, establishment of the boundary between lateral organ and terminal meristem primordia, and have an important influence on the formation and development of aboveground and belowground organs in higher plants. In addition, LBD genes are involved in anthocyanin and nitrogen metabolism [1,2,3,4][1][2][3][4].
The LBD gene family is plant specific and is characterized by a highly conserved LATERAL ORGAN BOUNDARIES (LOB) domain. The length of the LOB domain is about 100 amino acids. The LOB domain comprises a C-block, which contains conserved cysteine residues in the CX2CX6CX3C motif required for DNA-binding activity. A Gly–Ala–Ser (GAS) block and a complete leucine zipper-like coiled-coil motif (LX6LX3LX6L) are responsible for protein dimerization [5,6][5][6]. On the basis of protein sequence analyses, LBD proteins can be classified into two groups (class I and class II). All LBD proteins contain the C-block, but LBD proteins of class I also include a leucine zipper structure, whereas class II proteins lack a complete leucine zipper structure and cannot form a spiral coil [7,8,9][7][8][9]. Previous studies have demonstrated that LBD proteins play important roles in plant growth, development, signal transduction, and stress response development [10,11,12,13,14,15,16][10][11][12][13][14][15][16].
Dendrobium catenatum has a broad distribution and a long history as a traditional medicinal plant in China, and has attracted considerable attention from local and international researchers on account of its high medicinal value [17]. In recent years, pharmacological research on the species has mainly focused on its antioxidant, anti-tumor, immunoregulatory, antifatigue, and diabetes-alleviating properties [18,19][18][19].
In previous studies, LBD transcription factors have been identified in many plant species. For example, Malus domestica has 58 LBD genes [20], Fragaria vesca has 35 LBD genes [21], Vitis vinifera has 40 LBD genes [22], Zea mays has 44 LBD genes [23], Morus notabilis has 31 LBD genes [24], Brassica rapa var. rapa has 59 LBD genes [25], and Hordeum vulgare has 24 LBD genes [26].
2. Identification of LBD Family Genes in D. catenatum
To identify the LBD proteins in the genome of D. catenatum, a local BLAST search of the hidden Markov models (HMMs) of the SMART and Pfam databases was conducted. In total, 24 LBD genes from the complete D. catenatum genome were isolated. All of the deduced LBD proteins possessed a conserved LOB domain. WResearchers reconstructed a phylogenetic tree from an alignment of LBD protein sequences from Arabidopsis thaliana and D. catenatum. The DcaLBD genes were annotated based on the similarity of the protein sequences to those of A. thaliana (Figure 1).
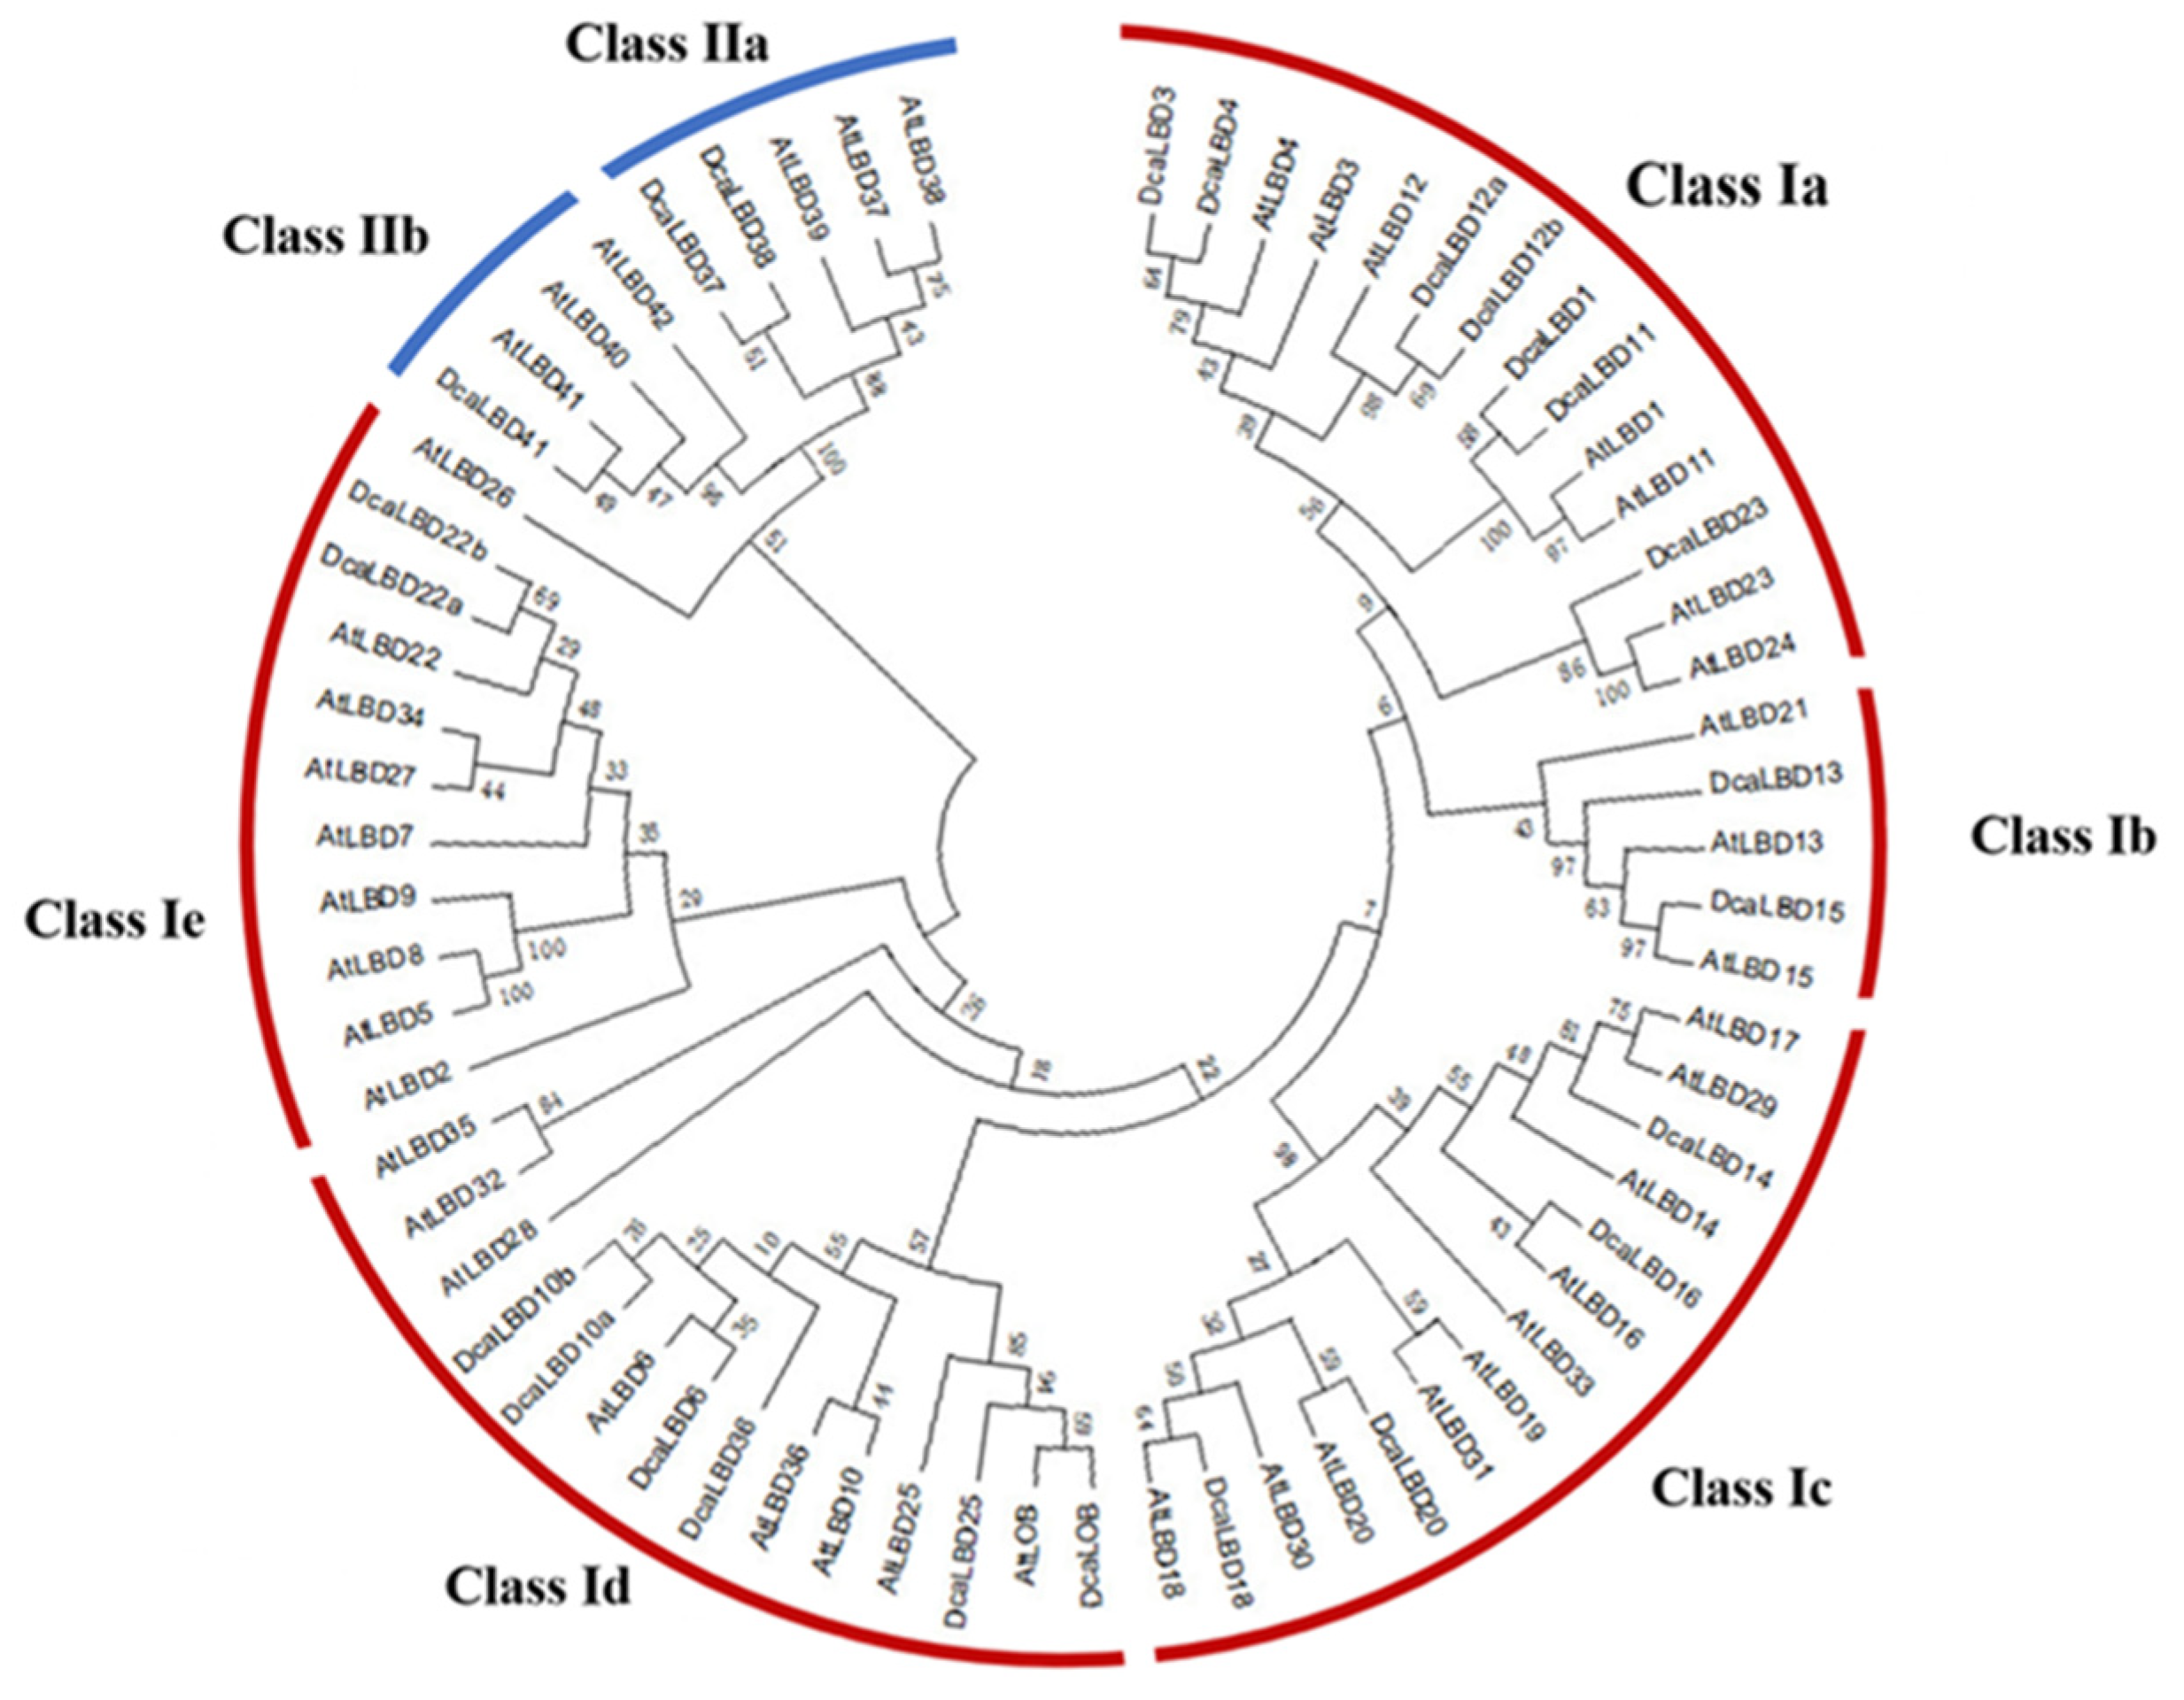
Figure 1. Phylogenetic tree of LBD proteins from D. catenatum and Arabidopsis was generated using the neighbor-joining (NJ) method implemented in MEGA 7.0 software. Bootstrap analysis was conducted with 1000 iterations.
On the basis of the phylogenetic analysis, the LBD proteins of D. catenatum were resolved into two monophyletic groups (classes I and II), of which 21 LBD proteins belonged to class I and three LBD proteins belonged to class II. Sequence analysis revealed that AtLBD1, 3, 4, 6, 10, 11, 12, 13, 14, 15, 16, 18, 20, 22, 23, 25, 36, 37, 38, 41, and LOB have orthologs in D. catenatum of which DcaLBD10, 12, and 22 comprised multiple orthologs.
The length of the DcaLBD proteins ranged from 148 to 307 aa, the molecular weight ranged from 17.06 to 34.33 KDa, the theoretical isoelectric point value ranged from 4.61 to 9.33, and the calculated grand average of hydrophobicity value ranged from −0.529 to 0.114. Most of the proteins were hydrophobic with the exception of DcaLBD4 and DcaLBD16 (Table 1).
Table 1. Identification and characteristics of LBD genes in D. catenatum.
| Gene Name | Accession Number | CDS Length (bp) | Protein Size (aa) | MW (kD) | PI | GRAVY |
|---|---|---|---|---|---|---|
| DcaLBD1 | XP_020695176.1 | 591 | 196 | 21.6 | 5.77 | −0.172 |
| DcaLBD3 | XP_020704279.1 | 579 | 192 | 20.84 | 8.98 | −0.049 |
| DcaLBD4 | XP_020673109.1 | 567 | 188 | 20.27 | 6.93 | 0.114 |
| DcaLBD6 | XP_020676861.1 | 606 | 201 | 21.37 | 8.56 | −0.115 |
| DcaLBD10a | XP_020702209.1 | 639 | 212 | 22.85 | 7.64 | −0.323 |
| DcaLBD10b | XP_020700451.1 | 528 | 175 | 19.53 | 9.28 | −0.225 |
| DcaLBD11 | XP_020701018.1 | 576 | 191 | 20.79 | 6.40 | −0.020 |
| DcaLBD12a | XP_020682070.1 | 513 | 170 | 18.84 | 6.07 | −0.152 |
| DcaLBD12b | XP_020701020.1 | 495 | 164 | 18.36 | 6.94 | −0.291 |
| DcaLBD13 | XP_020682962.1 | 573 | 190 | 21.06 | 8.27 | −0.247 |
| DcaLBD14 | XP_020677496.1 | 642 | 213 | 23.32 | 6.11 | −0.139 |
| DcaLBD15 | XP_020682881.2 | 660 | 219 | 23.82 | 8.85 | −0.235 |
| DcaLBD16 | XP_020701180.1 | 876 | 291 | 31.13 | 9.33 | 0.047 |
| DcaLBD18 | XP_020699320.1 | 738 | 245 | 25.76 | 8.26 | −0.212 |
| DcaLBD20 | XP_020693551.1 | 744 | 247 | 26.93 | 6.35 | −0.300 |
| DcaLBD22a | XP_020686925.1 | 834 | 277 | 31.15 | 4.61 | −0.465 |
| DcaLBD22b | XP_020682680.1 | 924 | 307 | 34.33 | 5.15 | −0.443 |
| DcaLBD23 | XP_028557256.1 | 447 | 148 | 17.06 | 8.70 | −0.418 |
| DcaLBD25 | XP_028549413.1 | 681 | 226 | 24.66 | 5.96 | −0.345 |
| DcaLBD36 | XP_020698423.1 | 843 | 280 | 31.14 | 6.81 | −0.529 |
| DcaLOB | XP_020678334.1 | 570 | 189 | 21.32 | 8.26 | −0.108 |
| DcaLBD37 | XP_028551170.1 | 591 | 196 | 21.76 | 6.17 | −0.297 |
| DcaLBD38 | XP_020688010.1 | 645 | 214 | 23.37 | 8.74 | −0.257 |
| DcaLBD41 | XP_020703175.1 | 810 | 269 | 29.17 | 7.56 | −0.442 |
3. Motif Analysis and Gene Structure
To further explore the diversity of LBD genes in D. catenatum, the conserved motifs of the DcaLBD proteins were analyzed. A neighbor-joining (NJ) tree was constructed based on a multiple alignment of the DcaLBD protein sequences. The MEME online tool was used to predict the conserved motif composition of the DcaLBD proteins. The number of motifs ranged from three to seven. A LOB domain, motif 2, was detected in all DcaLBDs. In addition, motif 3 was detected in all class I members, indicating that the class I proteins have a specific structure (Figure 2).
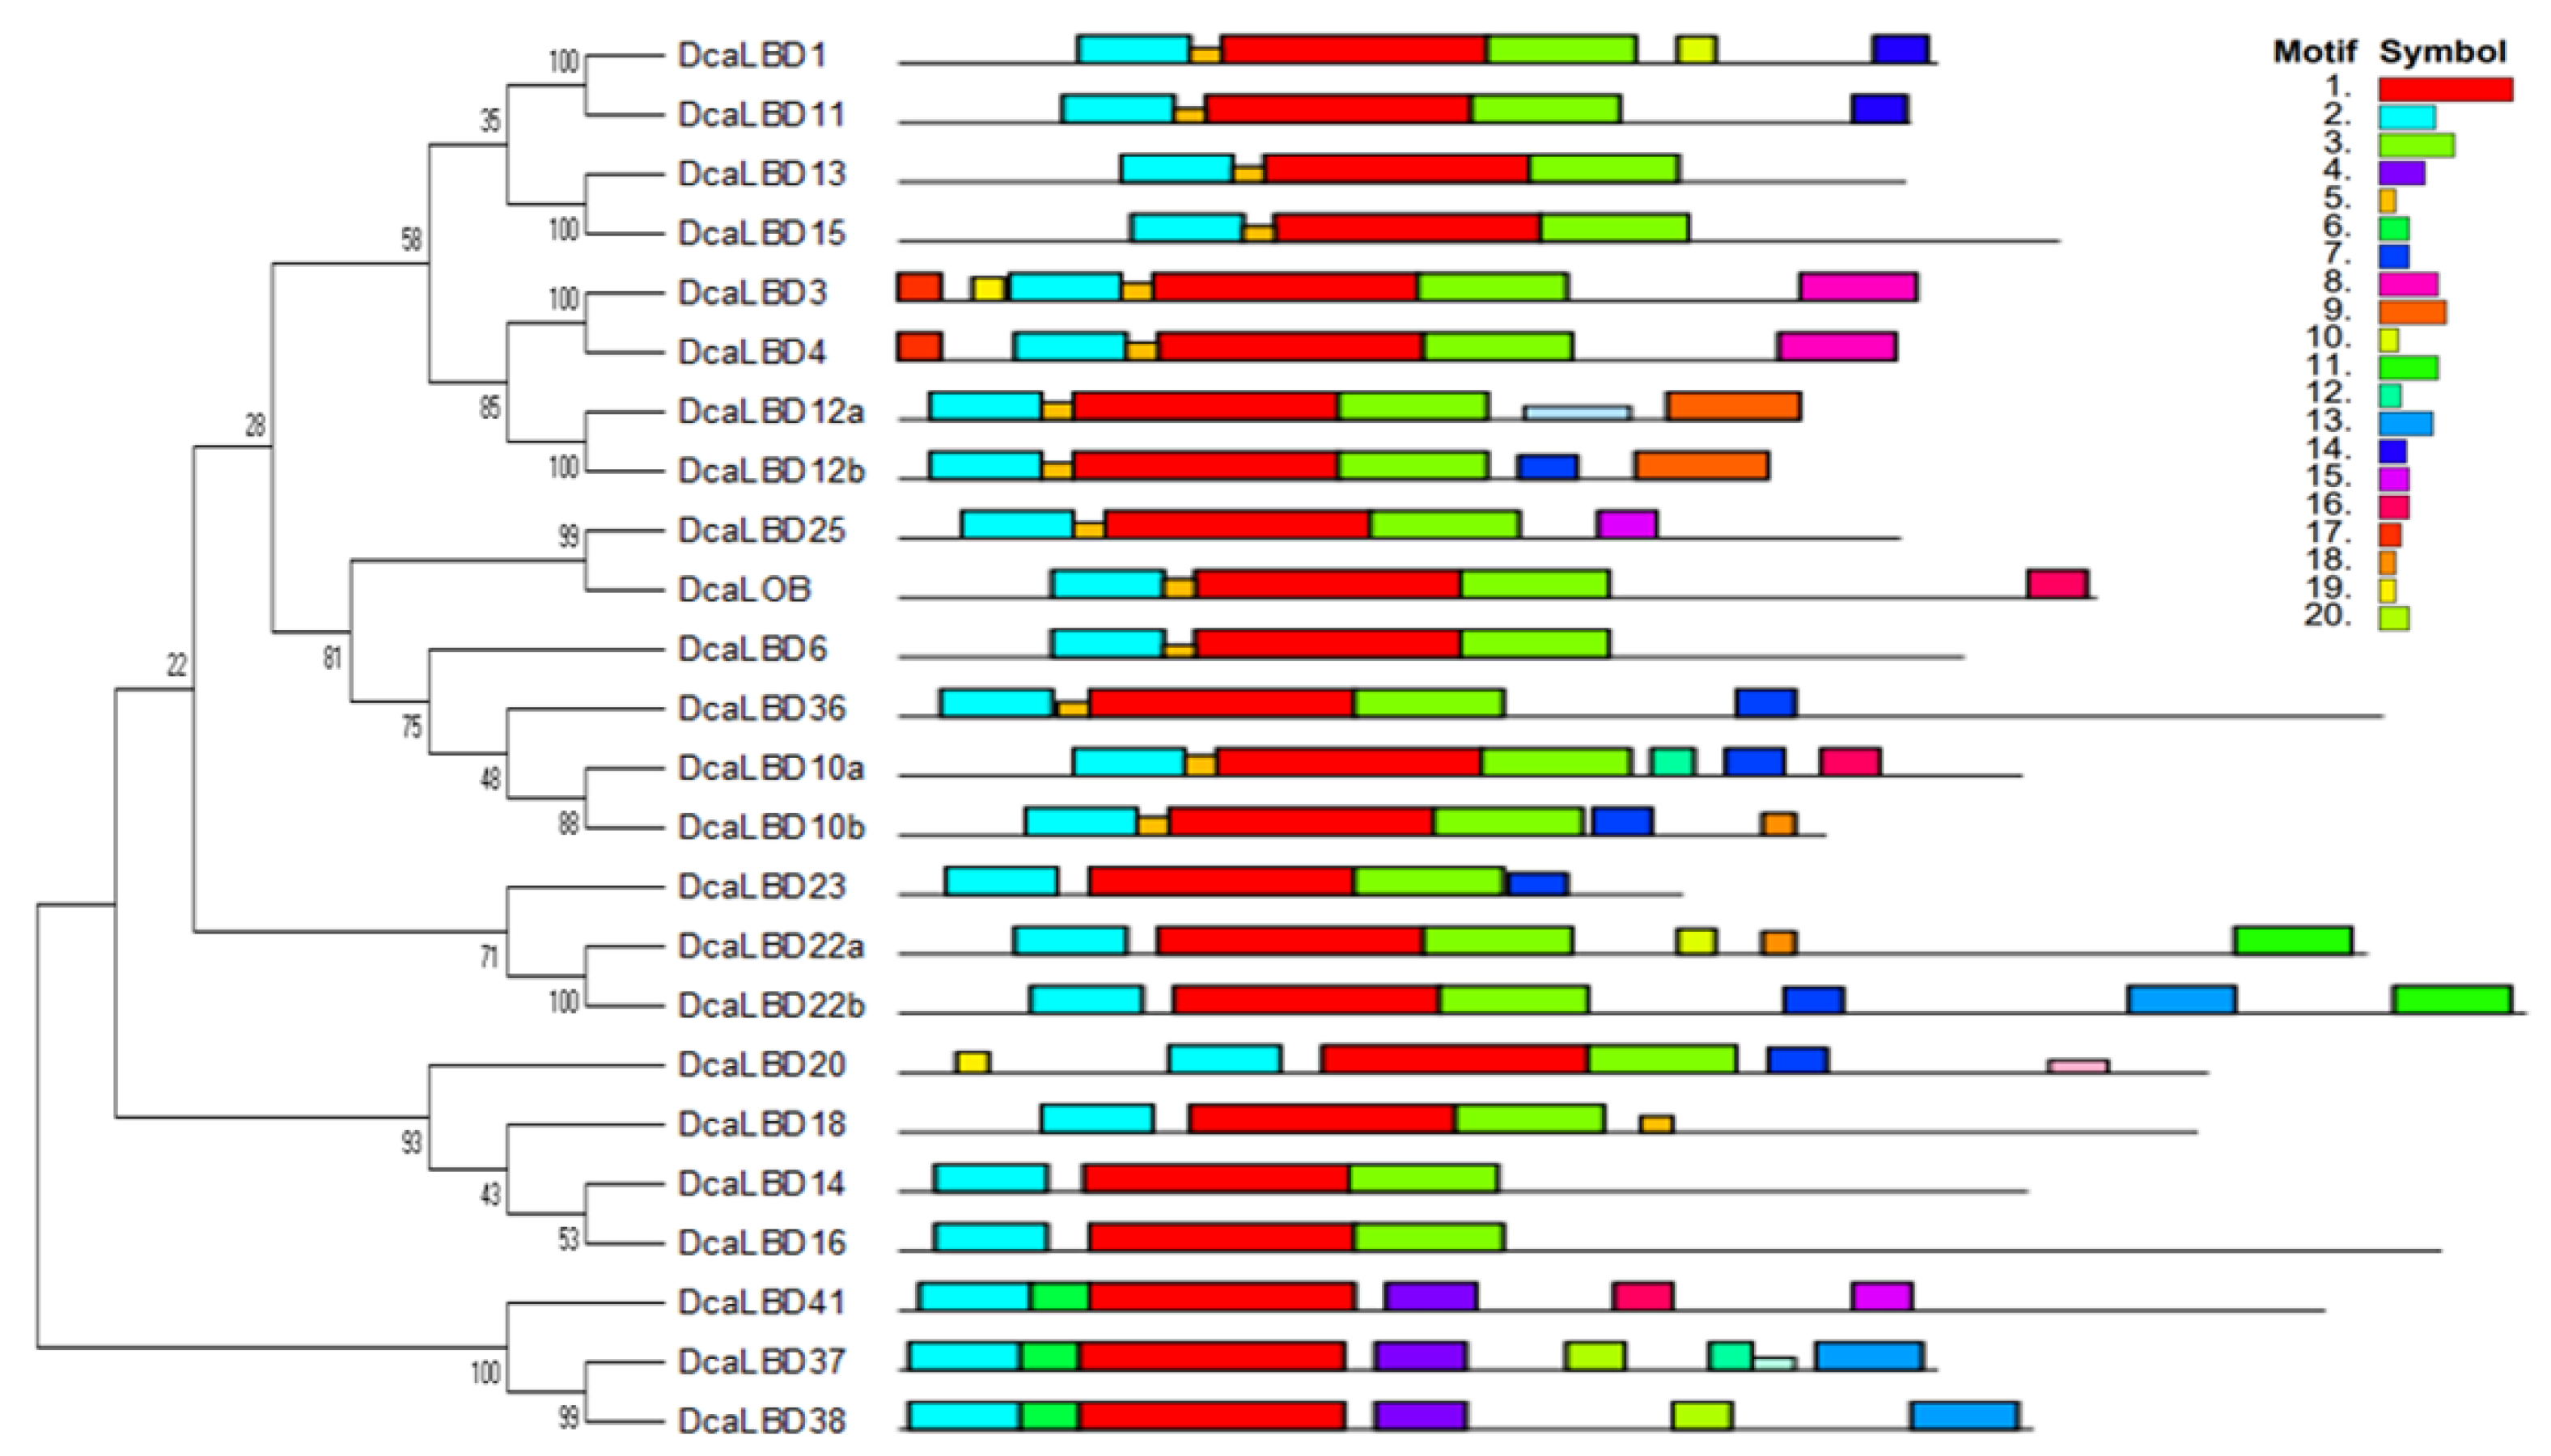
Figure 2. Genomic structure and motif composition of D. catenatum LBDs, phylogenetic tree of D. catenatum LBD proteins. The conserved motifs in D. catenatum LBD proteins were identified using MEME, each motif is shown in a specific color.
On this basis, wresearchers further analyzed the DcaLBD protein sequences using the DNAMAN tool. The multiple sequence alignment indicated that a sequence comprising more than 100 amino acids was conserved in all DcaLBDs (Figure 3). For the class I proteins, a string consisting of a C-block, GAS-block, and L-rich block was detected. The C-block in DcaLBDs can be summarized as CX2CX6CX3C. The GAS-block began with a FX2V/AH motif and ended with a DPV/IYG motif. All class II DcaLBDs contained the conserved C-block similar to class I proteins and lacked the GAS-block and Leu-zipper-like domain.
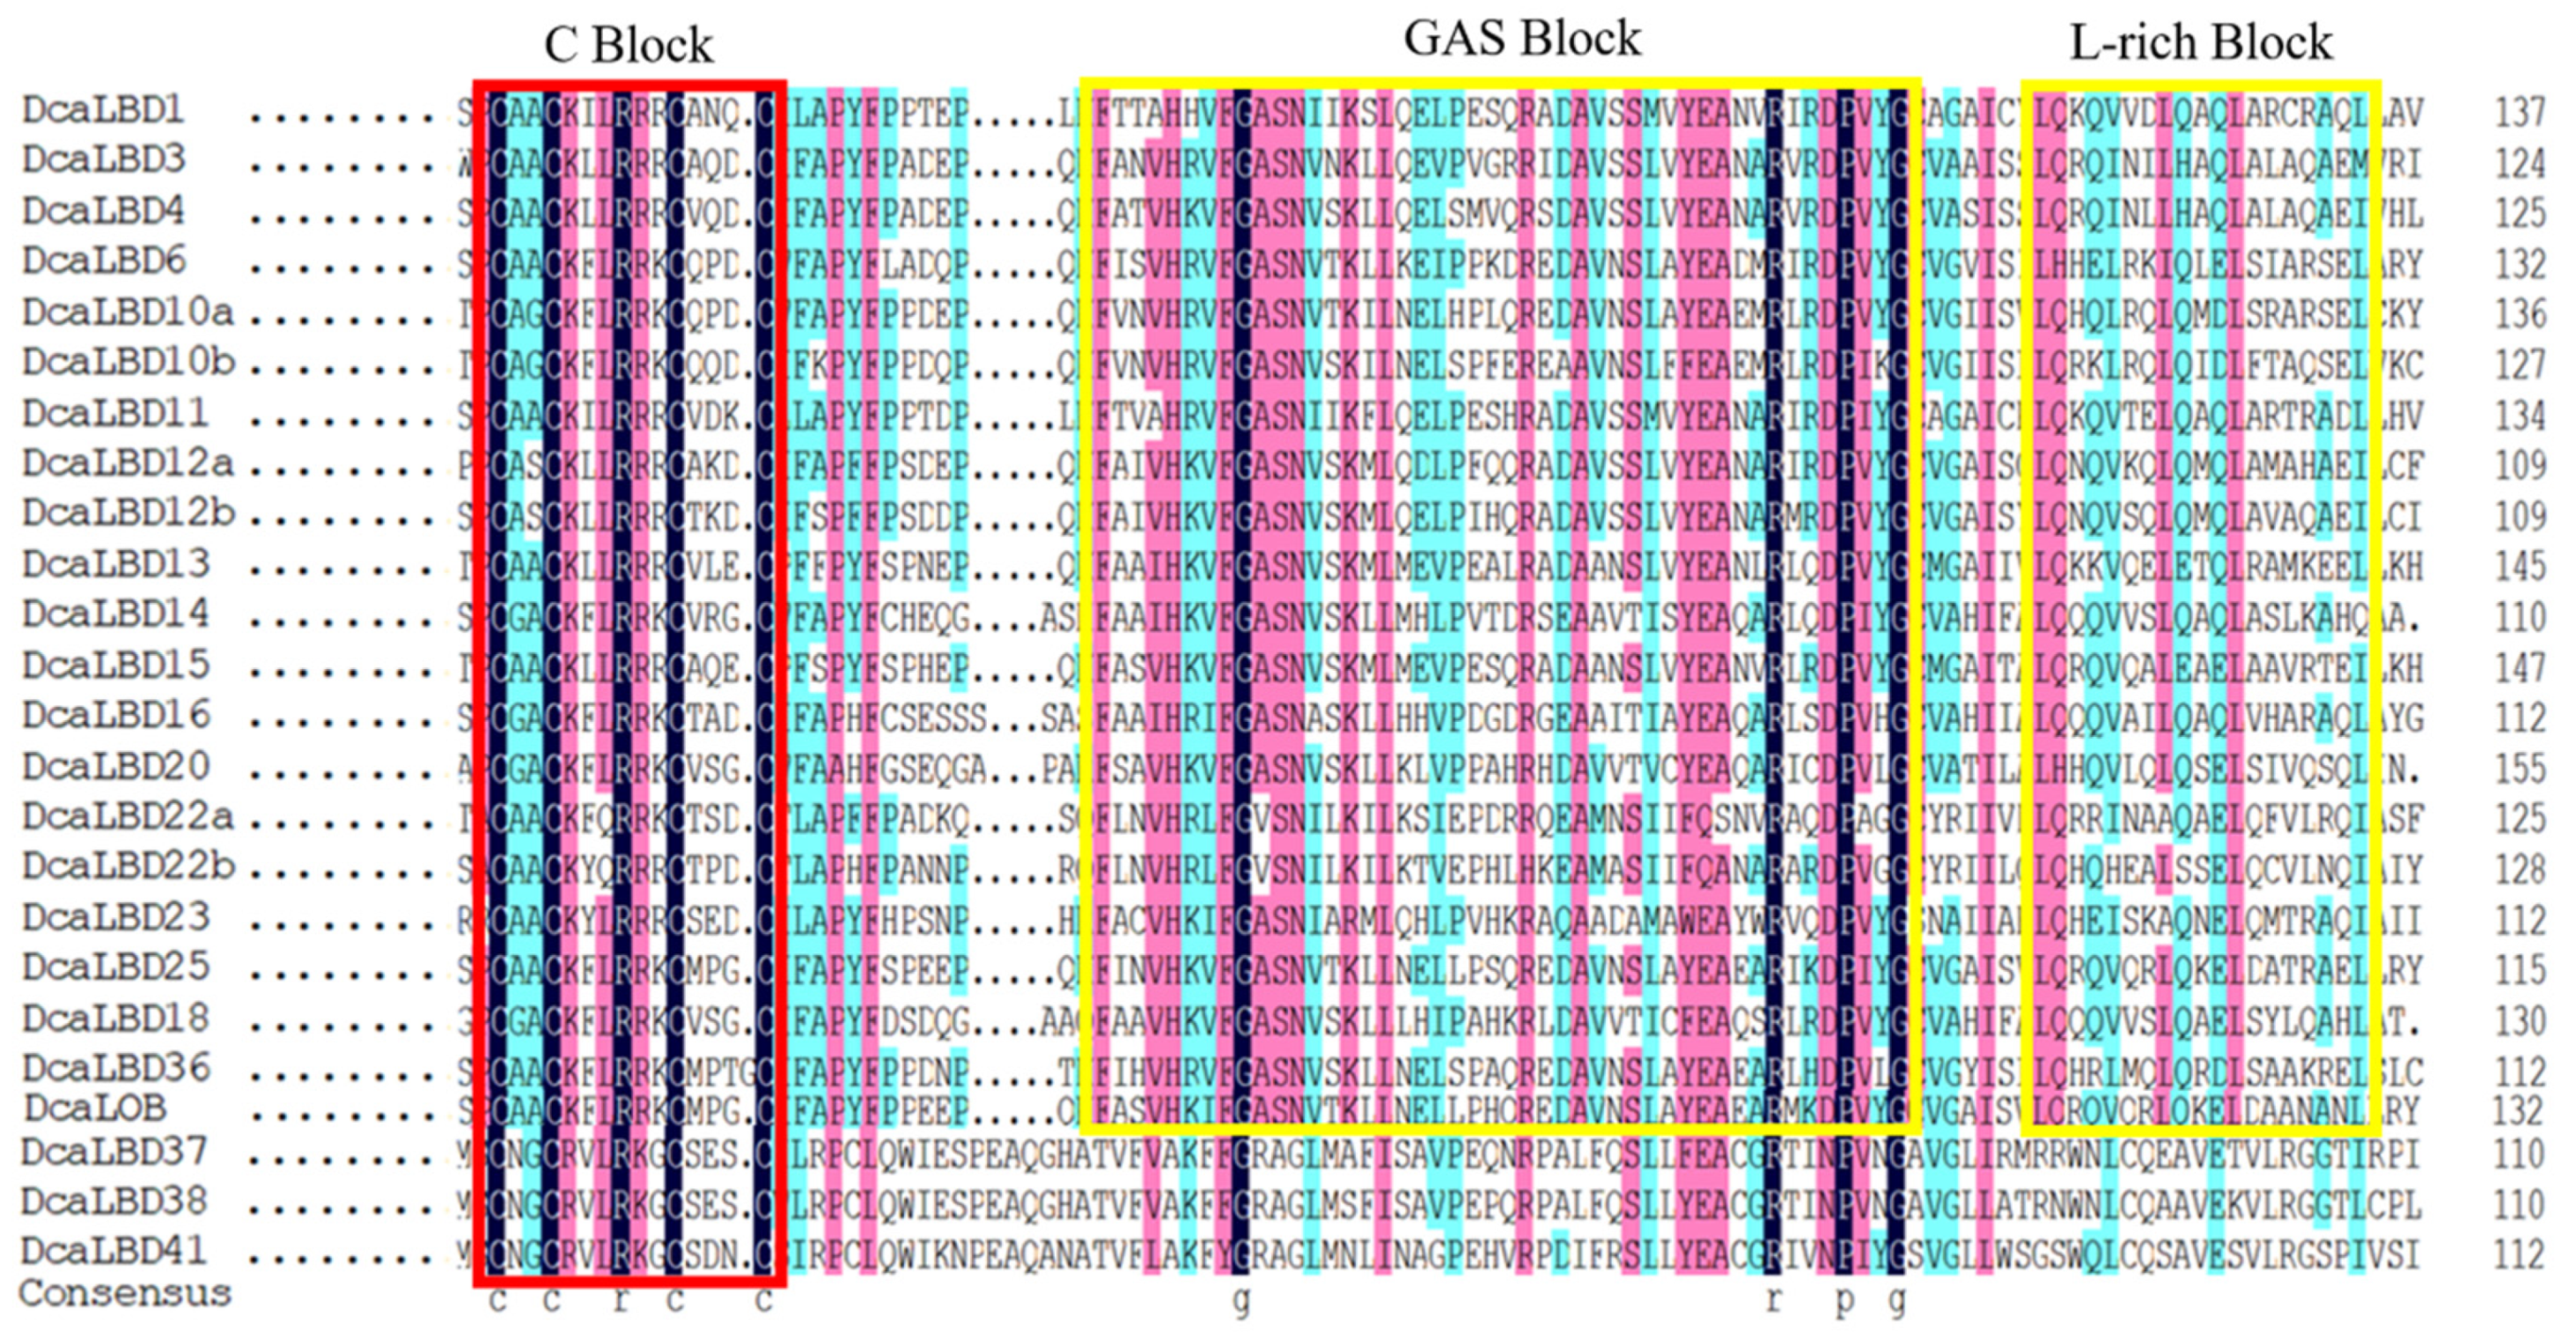
Figure 3. LBD-domain alignment and corresponding logo of DcaLBDs. The conserved C–block in all DcaLBDs protein is indicated by a red box. The GAS block and L-rich block in class II of DcaLBDs protein are indicated by yellow boxes.
4. Subcellular Localization
WResearchers predicted that the LBD gene family were transcription factors localized in the nucleus to play roles in regulating plant growth and development. To support this hypothesis, wresearchers conducted a subcellular localization analysis for DcaLBD6 and DcaLBD18 from class I and DcaLBD37 and DcaLBD41 from class II. The respective DcaLBD gene was fused with the green fluorescent protein (GFP) gene and co-injected into Nicotiana benthamiana leaves. The transfected plants were cultured in a greenhouse for 3 days. The fluorescence in the injected leaves was observed under a microscope (Olympus FV1000, Tokyo, Japan) after 4′,6-diamidino-2-phenylindole (DAPI) injection. Fluorescent signal from the DcaLBD–GFP protein was detected in the nucleus, consistent with the proteins functioning as transcription factors (Figure 4).
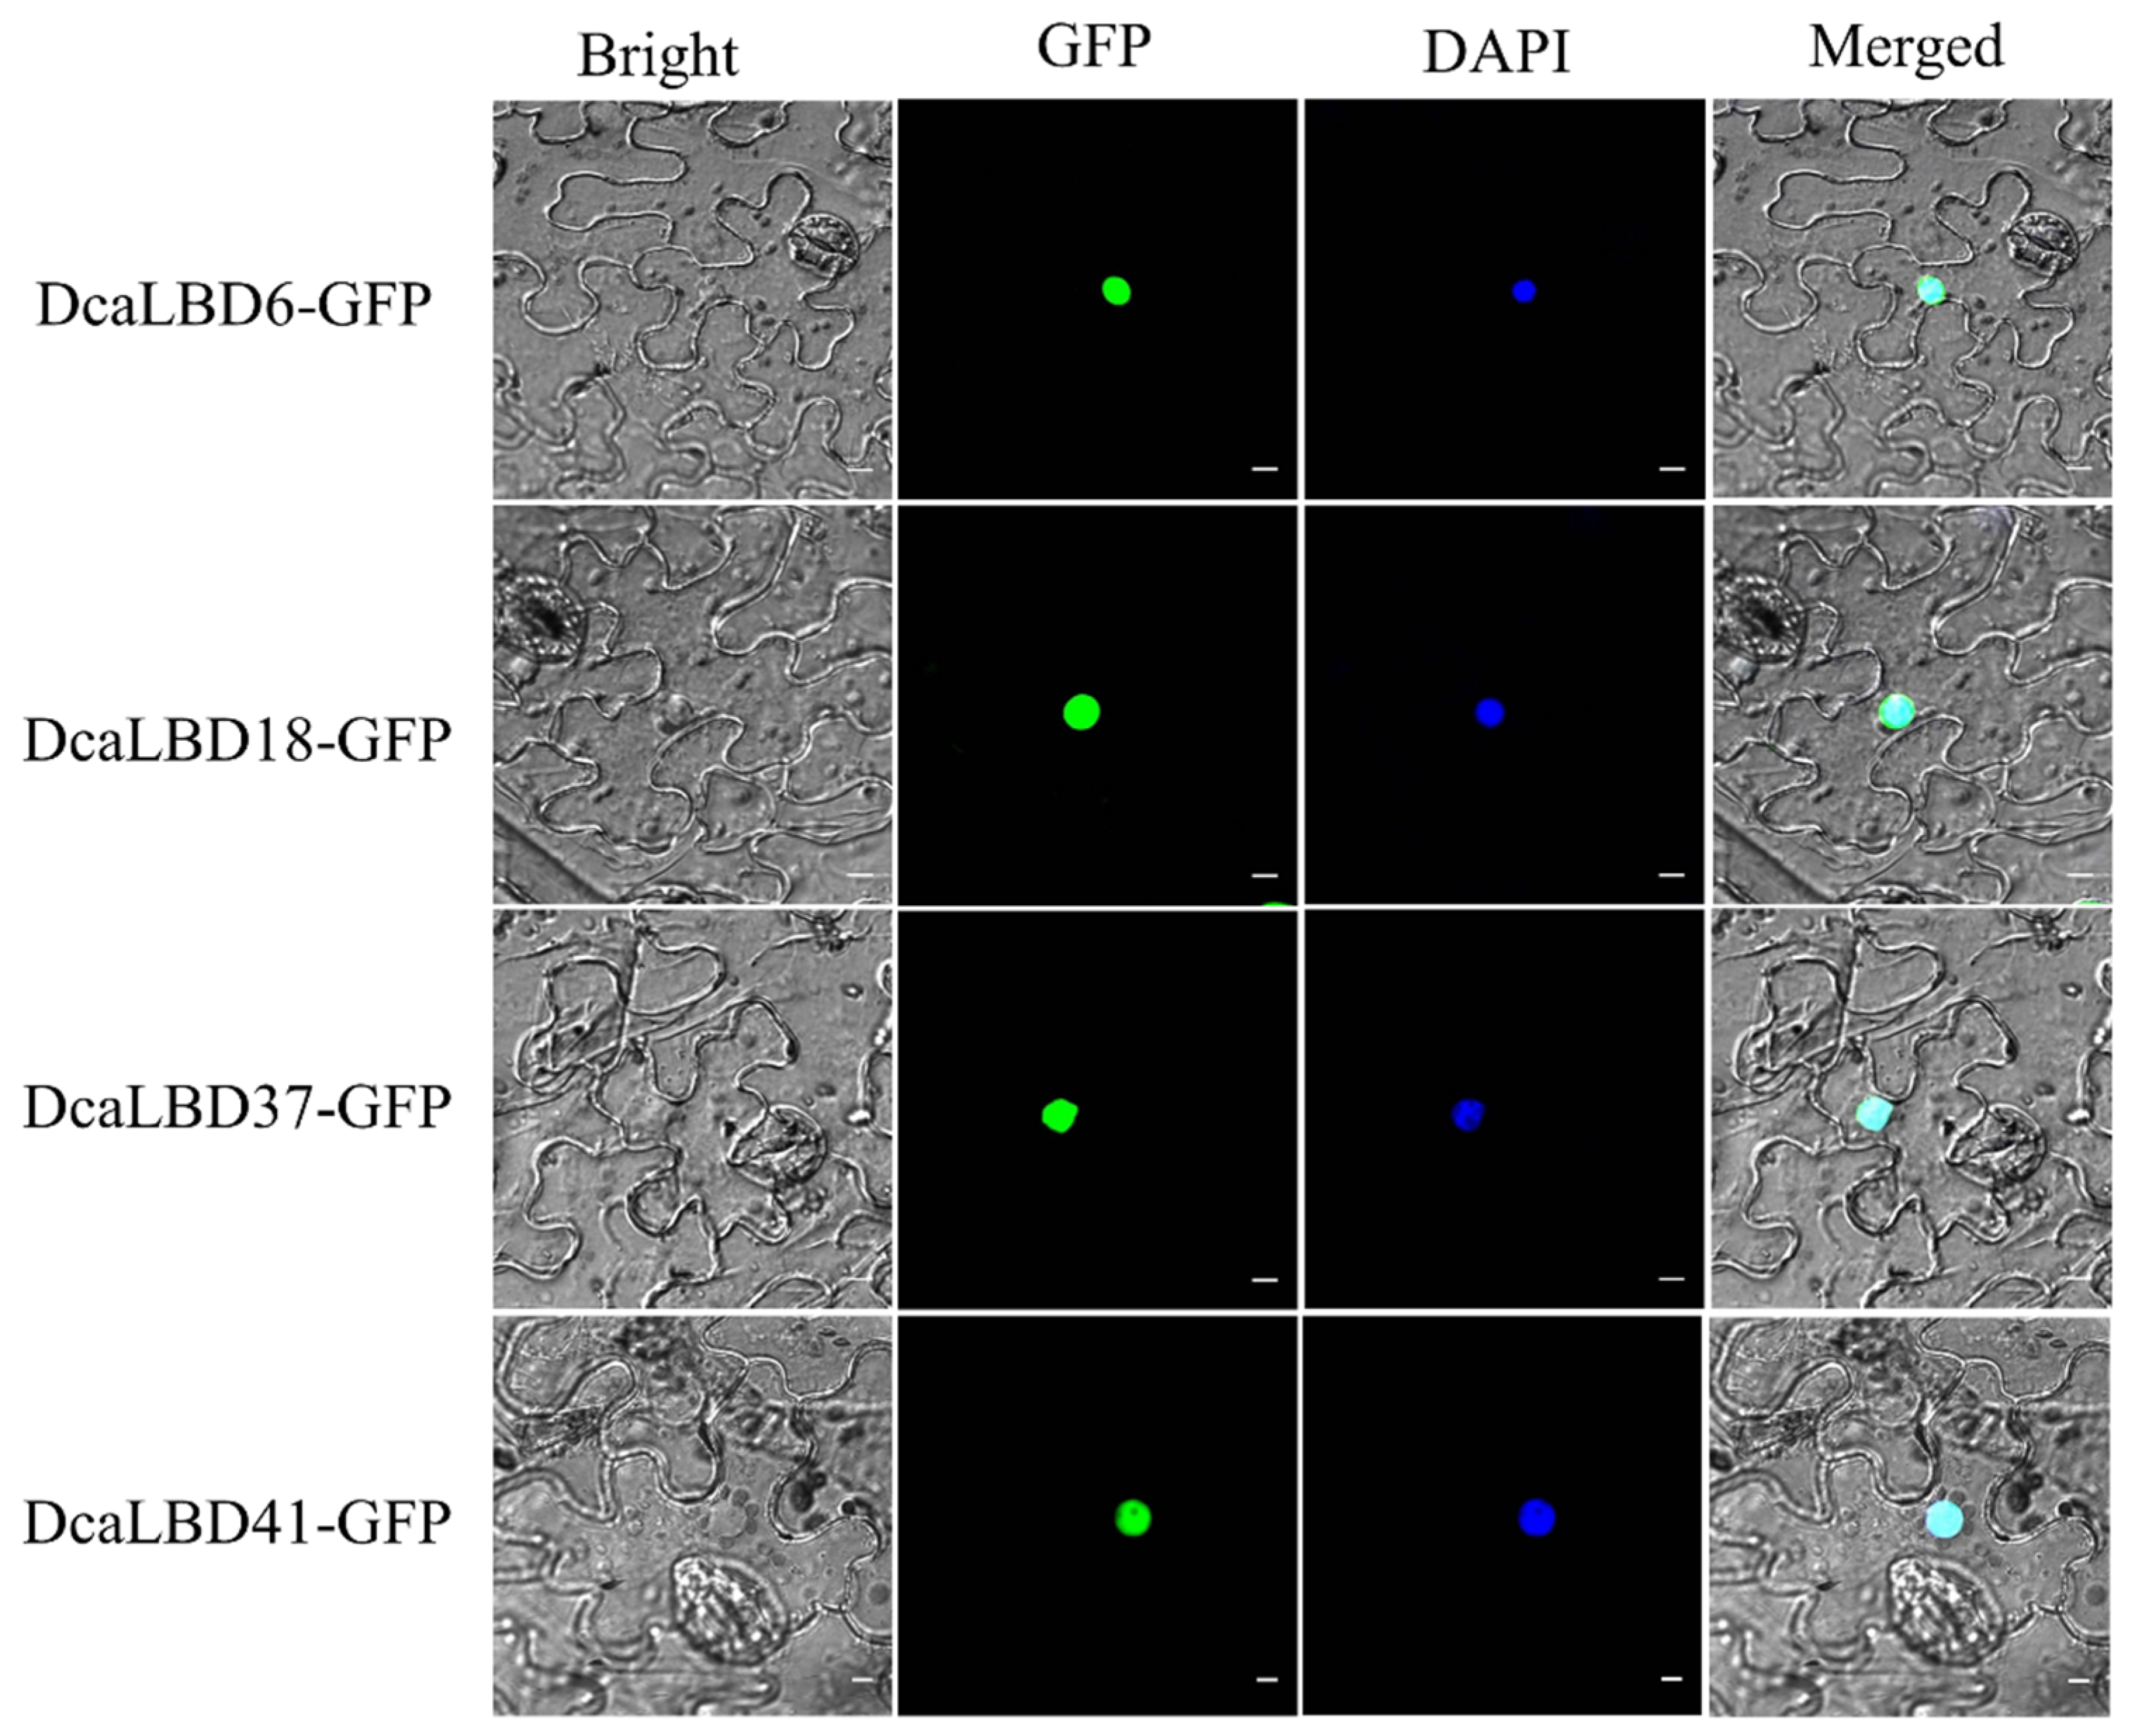
Figure 4. Subcellular localization of 35S:DcaLBD-GFP in Nicotiana benthamiana leaves. DcaLBD6-GFP, DcaLBD18-GFP, DcaLBD37-GFP and DcaLBD41-GFP were localized in the nucleus. Bar = 10 μm.
5. Class I and II LBDs Regulate VND7 Expression
Previous studies have shown that members of the LBD family have a positive feedback-regulatory effect on the master regulator VASCULAR-RELATED NAC-DOMAIN 7 (VND7) [27]. Therefore, wresearchers speculated that the DcaLBD family members may also regulate the expression of VND7. To test this hypothesis, wresearchers co-injected the ProAtVND7:LUC promoter with class I (35S:DcaLBD6 and 35S:DcaLBD18) or class II (35S:DcaLBD37 and 35S:DcaLBD41) gene constructs (Figure 5). When the ProAtVND7:LUC reporter plasmid was co-injected with the 35S:DcaLBD37 or 35S:DcaLBD41 effector plasmid, intense luciferase (LUC) fluorescence signal was detected. These results indicated that DcaLBD37 and DcaLBD41 directly activated expression of AtVND7. In contrast, when the ProAtVND7:LUC reporter plasmid was co-injected with the 35S:DcaLBD6 effector plasmid, faint LUC fluorescence signal was detected, but when injected without the effector plasmid the LUC fluorescence signal was weaker. Thus, DcaLBD6 restrained expression of AtVND7. Co-injection of the ProAtVND7:LUC reporter plasmid with the 35S:DcaLBD18 effector plasmid resulted in LUC fluorescence signal similar to that of the ProAtVND7:LUC. These results are consistent with previous studies of LBD family members in suggesting that DcaLBD family members exhibit different functions or even antagonistic roles [28].
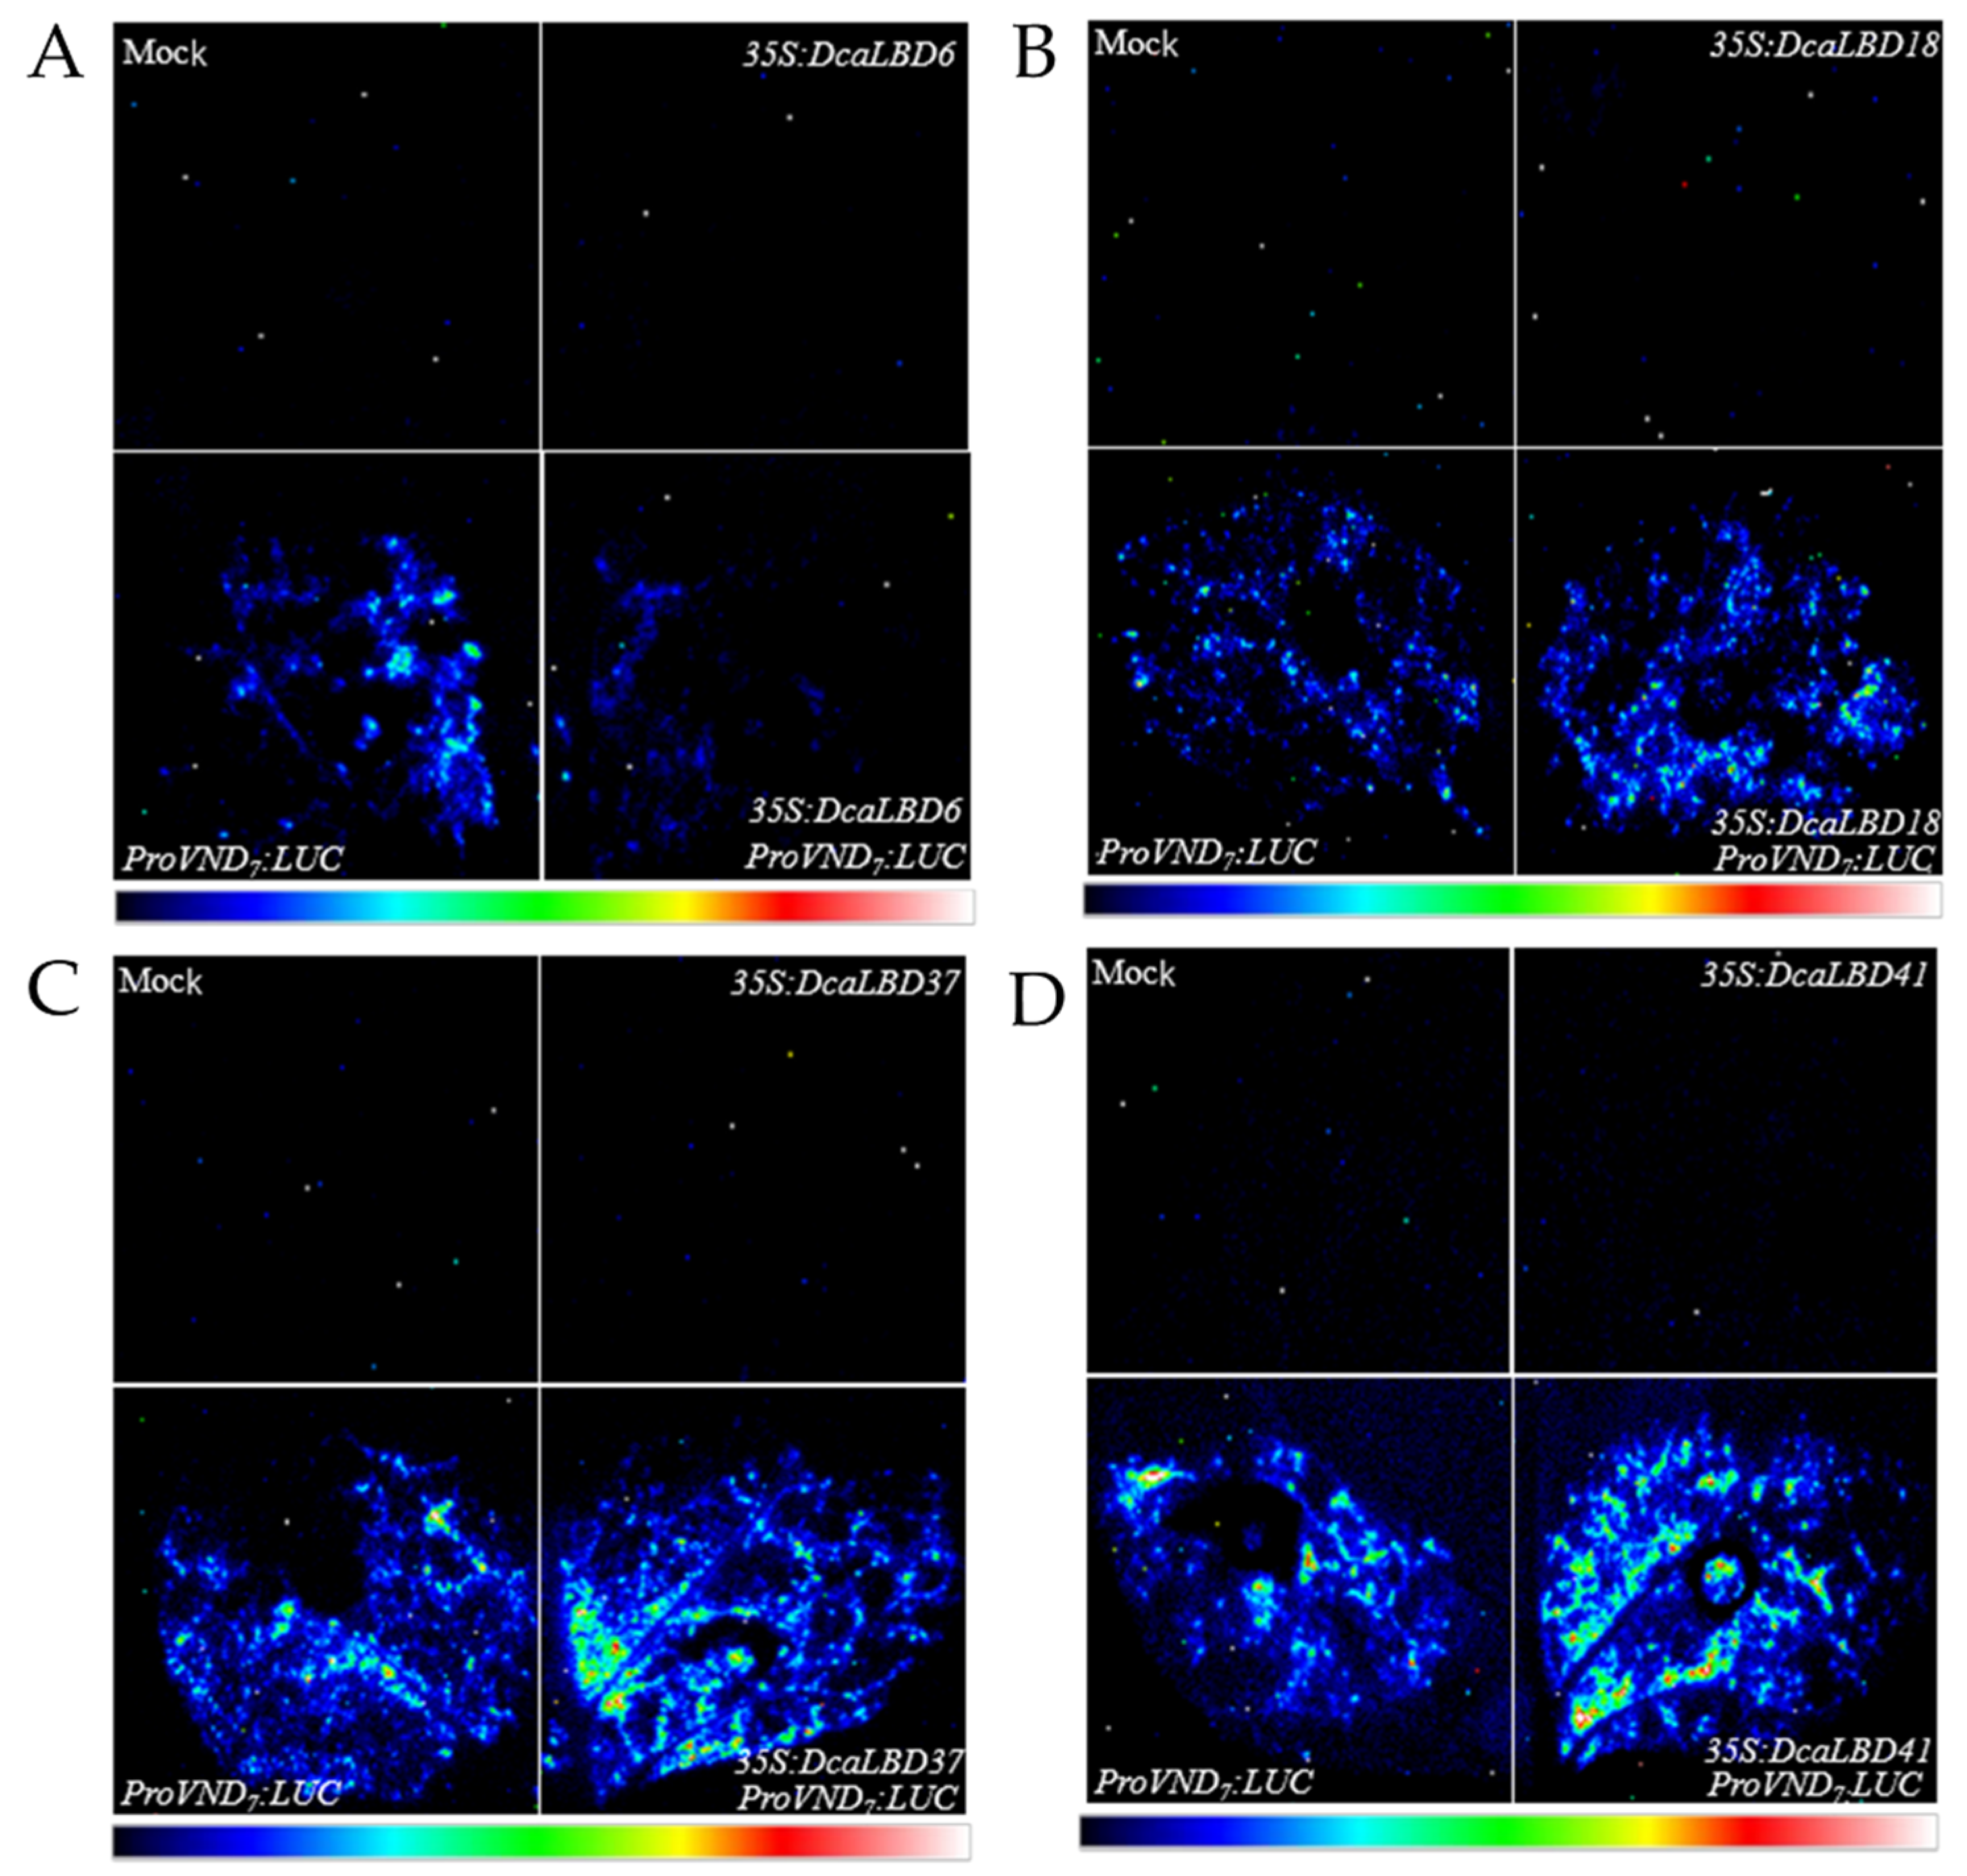
Figure 5. Transient expression analysis of DcaLBD6, DcaLBD18, DcaLBD37 and DcaLBD41 activities. (A) VND7 was repressed by DcaLBD6. (B) VND7 was activated slightly by DcaLBD18. (C) VND7 was activated by DcaLBD37. (D) VND7 was activated by DcaLBD41.
6. Expression Profiles of LBD Genes in D. catenatum
To investigate the function of LBD genes in D. catenatum, wresearchers used transcriptomic data to determine changes in the expression of the DcaLBD family genes under different phytohormone treatments.
DcaLBD13 showed the highest relative expression level without treatment (Figure 6). The expression level of DcaLBD13 decreased to varying degrees under the various phytohormone treatments. After treatment with indole-3-acetic acid (IAA) for 3 h, DcaLBD6 showed the highest expression level. After treatment with IAA for 6 h, the expression level of DcaLBD18 was the highest. Among class II genes, DcaLBD38 showed the highest expression level without treatment. After treatment with jasmonic acid (JA) for 3 h, the expression level of DcaLBD38 was increased. The expression levels of DcaLBD37 were increased after phytohormone treatment. DcaLBD41 showed the highest expression level after treatment with salicylic acid (SA) for 3 h.
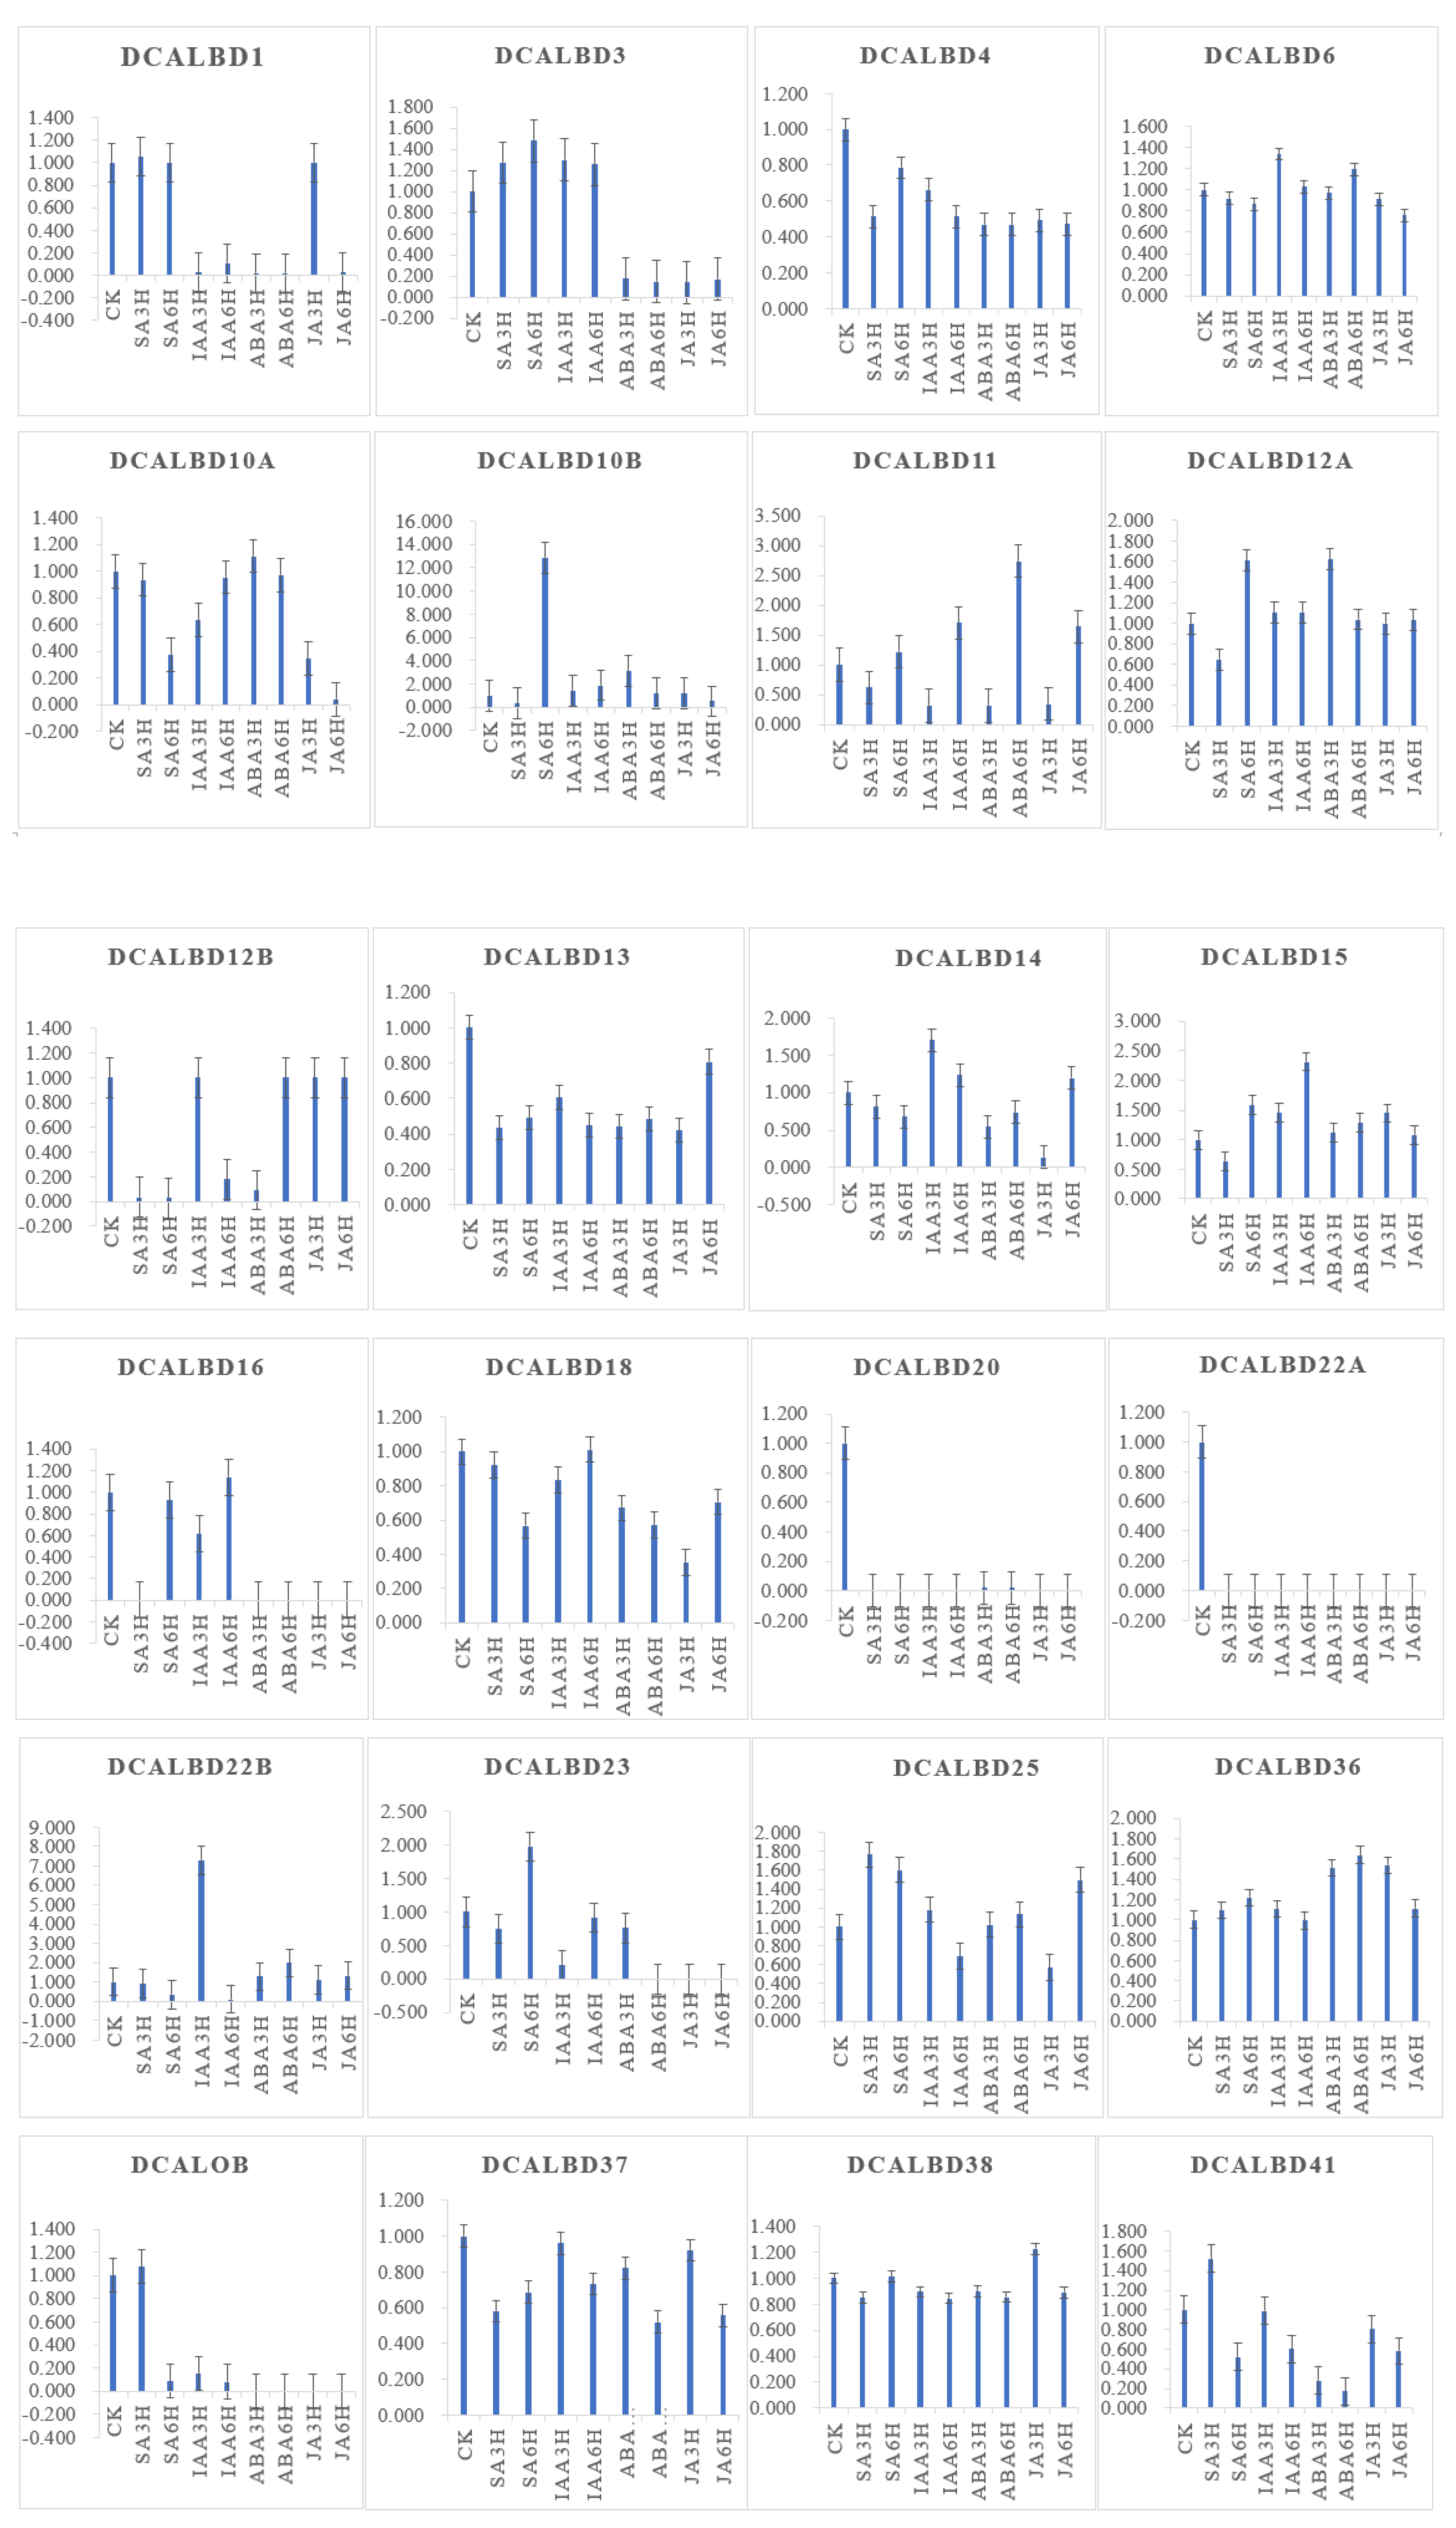
Figure 6. Expression analysis of DcaLBD genes after treatment with ABA, IAA, JA and SA. ABA: abscisic acid, IAA: indole-3-acetic acid, JA: jasmonic acid, SA: salicylic acid. ck: control, 3 h: treatment with phytohormone after 3 h, 6 h: treatment with phytohormone after 6 h.
Heat maps were generated to indicate the relative expression of the DcaLBD family members in different organs (Figure 7). Among class I genes, DcaLBD22b showed the highest expression level in the pollinium. DcaLBD6 was more highly expressed in the pollinium than in other organs. The expression of DcaLBD18 was higher in the white portion of the root than in other organs. Among class II genes, DcaLBD38 showed the highest expression level in the gynostemium. The expression level of DcaLBD37 and DcaLBD41 in the pollinium and green root tip were higher than that in other organs.
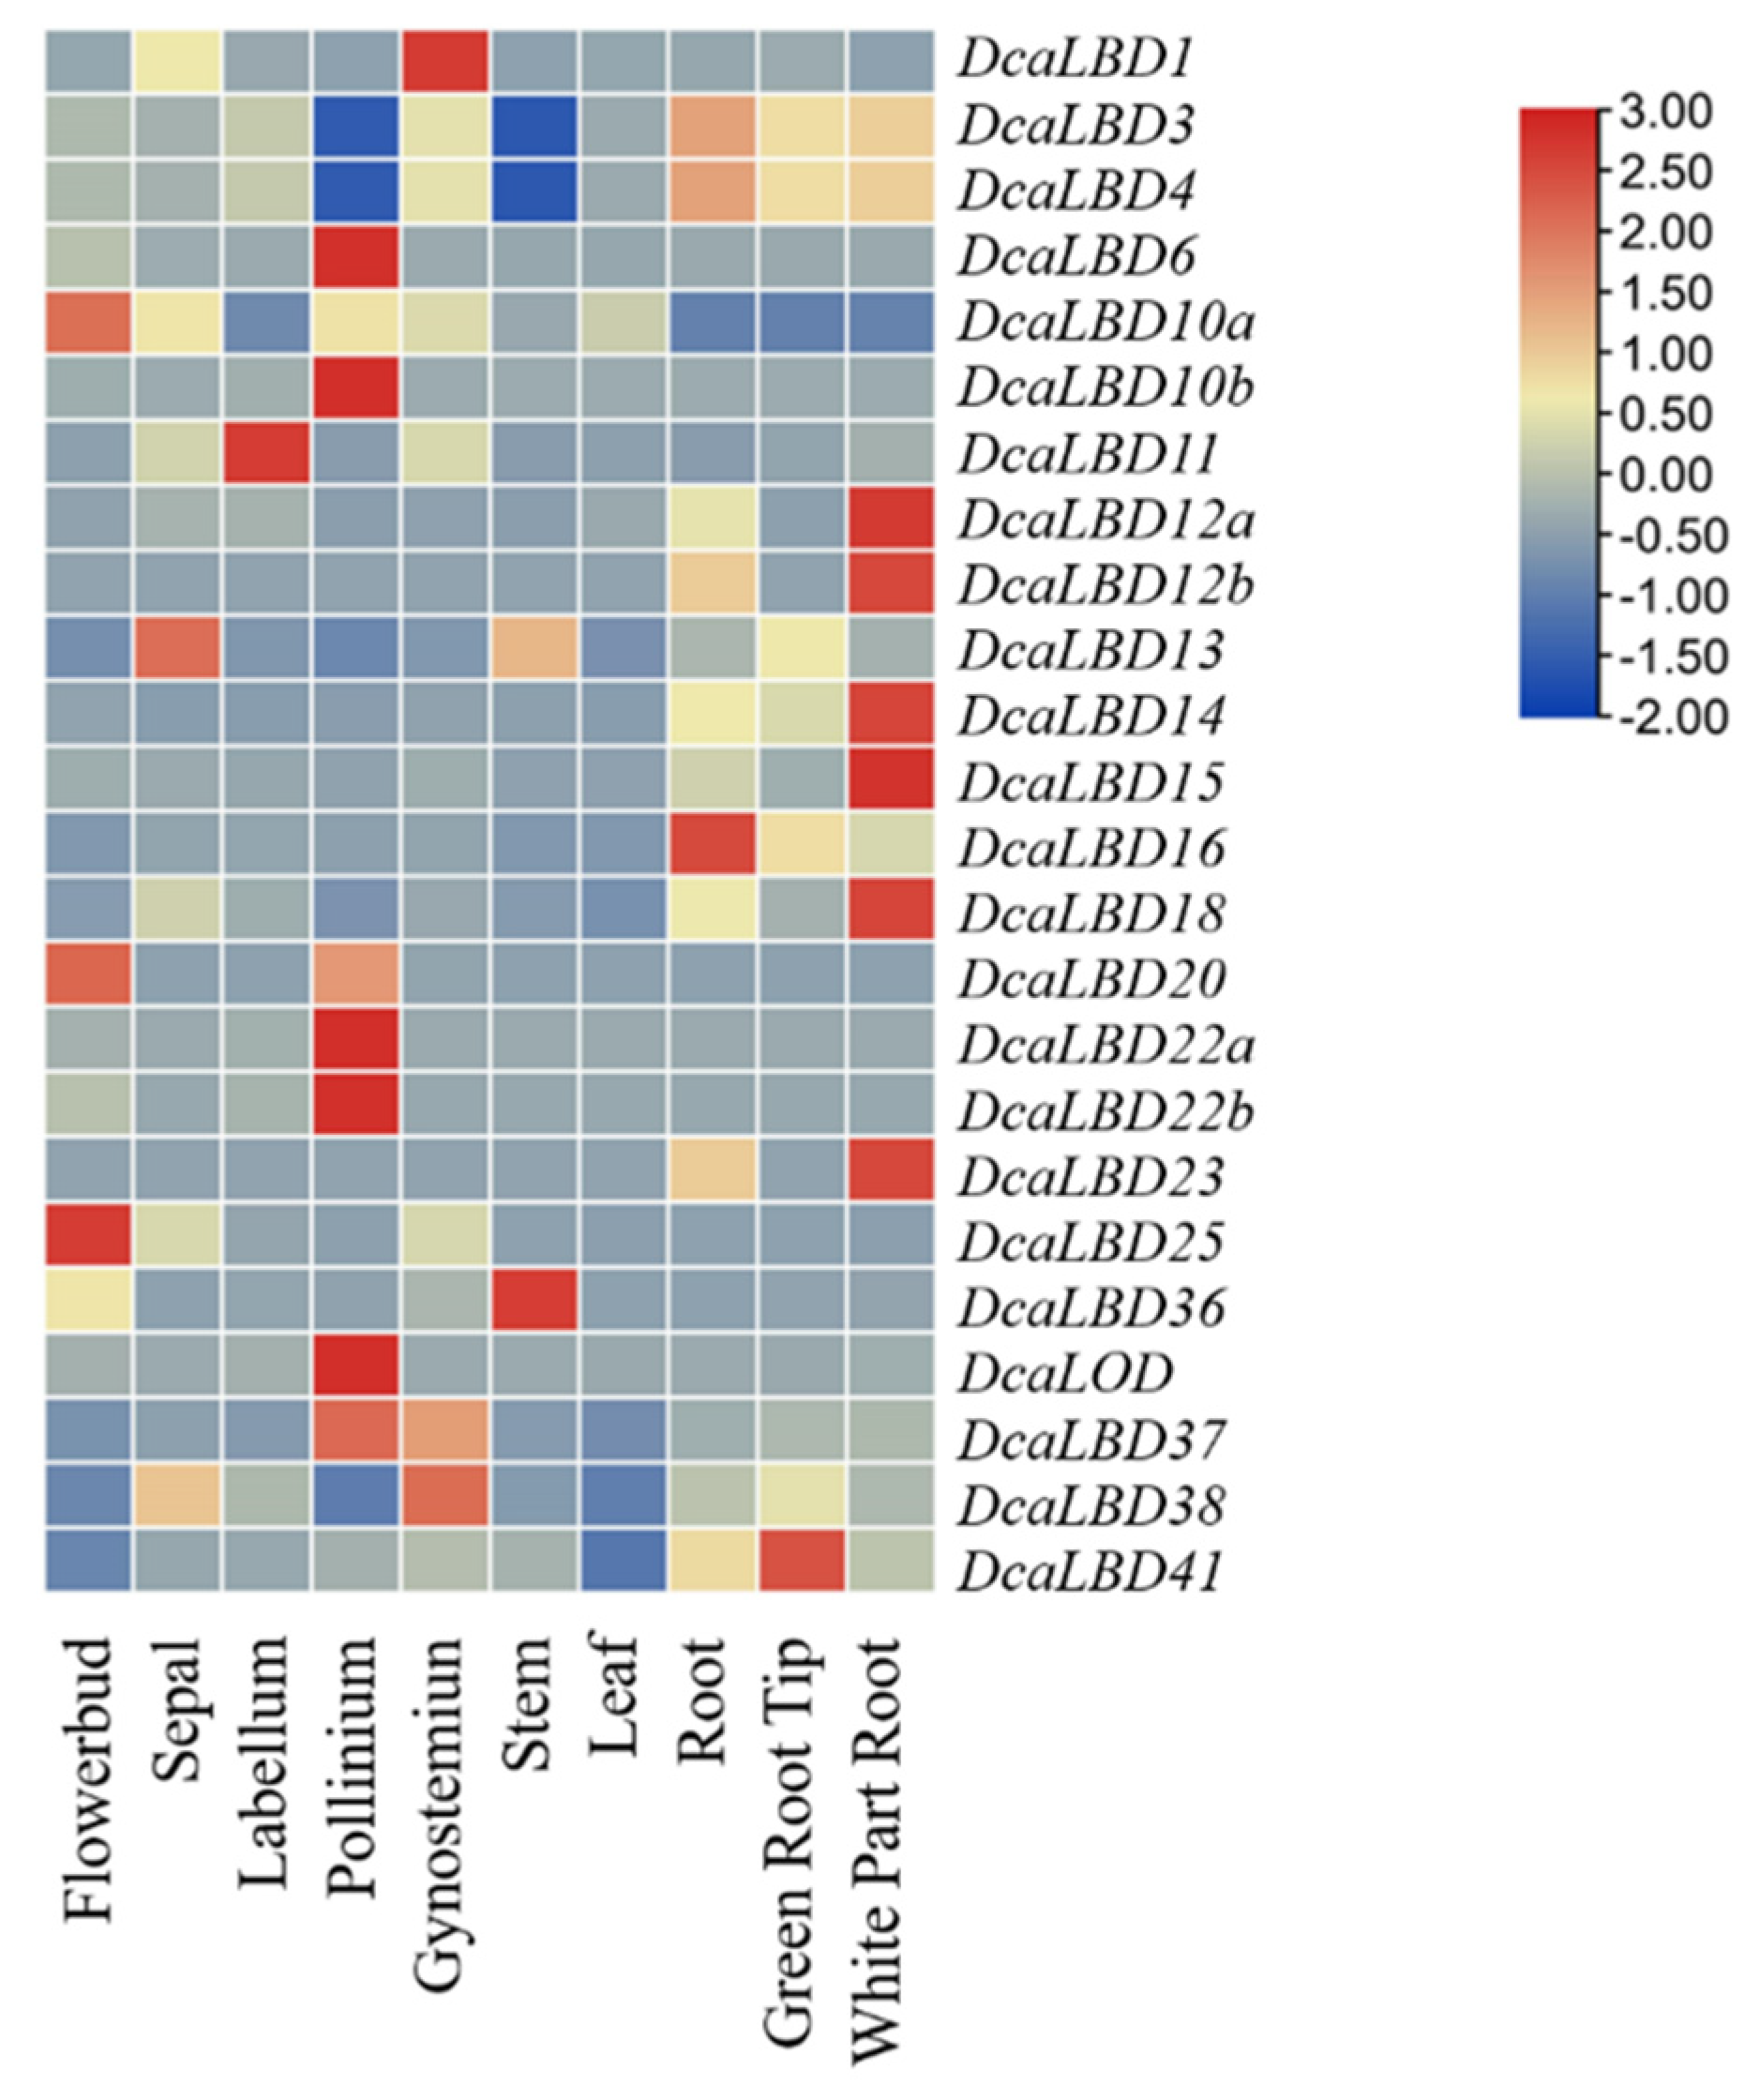
Figure 7. Expression analysis of DcaLBD genes in different organs.
References
- Fan, M.; Xu, C.; Xu, K.; Hu, Y. LATERAL ORGAN BOUNDARIES DOMAIN transcription factors direct callus formation in Arabidopsis regeneration. Cell Res. 2012, 22, 1169–1180.
- Rubin, G.; Tohge, T.; Matsuda, F.; Saito, K.; Scheible, W.R. Members of the LBD family of transcription factors repress anthocyanin synthesis and affect additional nitrogen responses in Arabidopsis. Plant Cell 2009, 21, 3567–3584.
- Shuai, B.; Reynaga-Peña, C.G.; Springer, P.S. The Lateral Organ Boundaries Gene Defines a Novel, Plant-Specific Gene Family. Plant Physiol. 2002, 129, 747–761.
- Majer, C.; Hochholdinger, F. Defining the boundaries: Structure and function of LOB domain proteins. Trends Plant Sci. 2011, 16, 47–52.
- Xu, C.; Luo, F.; Hochholdinger, F. LOB Domain Proteins: Beyond Lateral Organ Boundaries. Trends Plant Sci. 2015, 21, 159–167.
- Iwakawa, H.; Ueno, Y.; Semiarti, E.; Onouchi, H.; Kojima, S.; Tsukaya, H.; Hasebe, M.; Soma, T.; Ikezaki, M.; Machida, C.; et al. The ASYMMETRIC LEAVES2 Gene of Arabidopsis thaliana, Required for Formation of a Symmetric Flat Leaf Lamina, Encodes a Member of a Novel Family of Proteins Characterized by Cysteine Repeats and a Leucine Zipper. Plant Cell Physiol. 2002, 43, 467–478.
- Yang, Y.; Yu, X.; Wu, P. Comparison and evolution analysis of two rice subspecies LATERAL ORGAN BOUNDARIES domain gene family and their evolutionary characterization from Arabidopsis. Mol. Phylogenet. Evol. 2006, 39, 248–262.
- Yordanov, Y.S.; Regan, S.; Busov, V. Members of the LATERAL ORGAN BOUNDARIES DOMAIN Transcription Factor Family Are Involved in the Regulation of Secondary Growth in Populus. Plant Cell 2010, 22, 3662–3677.
- Lu, N.; Zhang, P.; Zhang, Q.; Qiao, R.; He, Q.; Li, H.B.; Wang, Y.; Guo, J.; Zhang, D.; Duan, Z.; et al. Electric-field control of tri-state phase transformation with a selective dual-ion switch. Nature 2017, 546, 124–128.
- Cabrera, J.; Diaz-Manzano, F.E.; Sanchez, M.; Rosso, M.N.; Melillo, T.; Goh, T.; Fukaki, H.; Cabello, S.; Hofmann, J.; Fenoll, C.; et al. A role for LATERAL ORGAN BOUNDARIES-DOMAIN 16 during the interaction Arabidopsis-Meloidogyne spp. provides a molecular link between lateral root and root-knot nematode feeding site development. New Phytol. 2014, 203, 632–645.
- Chen, J.; Moreau, C.; Liu, Y.; Kawaguchi, M.; Hofer, J.; Ellis, N.; Chen, R. Conserved genetic determinant of motor organ identity in Medicago truncatula and related legumes. Proc. Natl. Acad. Sci. USA 2012, 109, 11723–11728.
- Feng, Z.; Sun, X.; Wang, G.; Liu, H.; Zhu, J. LBD29 regulates the cell cycle progression in response to auxin during lateral root formation in Arabidopsis thaliana. Ann. Bot. 2012, 110, 1–10.
- Kim, J.; Lee, H.W. Direct activation of EXPANSIN14 by LBD18 in the gene regulatory network of lateral root formation in Arabidopsis. Plant Signal. Behav. 2013, 8, e22979.
- Kim, M.-J.; Kim, M.; Lee, M.R.; Park, S.K.; Kim, J. LATERAL ORGAN BOUNDARIES DOMAIN(LBD)10interacts withSIDECAR POLLEN/LBD27to control pollen development in Arabidopsis. Plant J. 2015, 81, 794–809.
- Lee, H.W.; Kang, N.Y.; Pandey, S.K.; Cho, C.; Lee, S.H.; Kim, J. Dimerization in LBD16 and LBD18 Transcription Factors Is Critical for Lateral Root Formation. Plant Physiol. 2017, 174, 301–311.
- Lee, H.W.; Kim, M.-J.; Park, M.Y.; Han, K.-H.; Kim, J. The Conserved Proline Residue in the LOB Domain of LBD18 Is Critical for DNA-Binding and Biological Function. Mol. Plant 2013, 6, 1722–1725.
- Hou, B.; Luo, J.; Zhang, Y.; Niu, Z.; Xue, Q.; Ding, X. Iteration expansion and regional evolution: Phylogeography of Dendrobium officinale and four related taxa in southern China. Sci. Rep. 2017, 7, 43525.
- Yan, L.; Wang, X.; Liu, H.; Tian, Y.; Lian, J.; Yang, R.; Hao, S.; Wang, X.; Yang, S.; Li, Q.; et al. The Genome of Dendrobium officinale Illuminates the Biology of the Important Traditional Chinese Orchid Herb. Mol. Plant 2014, 8, 922–934.
- Tang, H.; Zhao, T.; Sheng, Y.; Zheng, T.; Fu, L.; Zhang, Y. Dendrobium officinale Kimura et Migo: A Review on Its Ethnopharmacology, Phytochemistry, Pharmacology, and Industrialization. Evid. Based Complement. Altern. Med. 2017, 2017, 7436259.
- Wang, X.; Zhang, S.; Su, L.; Liu, X.; Hao, Y. A Genome-Wide Analysis of the LBD (LATERAL ORGAN BOUNDARIES Domain) Gene Family in Malus domestica with a Functional Characterization of MdLBD11. PLoS ONE 2013, 8, e57044.
- Chen, X.; Wang, J.; Zhao, M.; Yuan, H. Identification and expression analysis of LATERAL ORGAN BOUNDARIES DOMAIN (LBD) transcription factor genes in Fragaria vesca. Can. J. Plant Sci. 2017, 98, 288–299.
- Cao, H.; Liu, C.-Y.; Liu, C.-X.; Zhao, Y.-L.; Xu, R.-R. Genomewide analysis of the lateral organ boundaries domain gene family in Vitis vinifera. J. Genet. 2016, 95, 515–526.
- Majer, C.; Xu, C.; Berendzen, K.W.; Hochholdinger, F. Molecular interactions of ROOTLESS CONCERNING CROWN AND SEMINAL ROOTS, a LOB domain protein regulating shoot-borne root initiation in maize (Zea mays L.). Philos. Trans. R. Soc. Lond. B Biol. Sci. 2012, 367, 1542–1551.
- Luo, Y.; Ma, B.; Zeng, Q.; Xiang, Z.; He, N. Identification and characterization of Lateral Organ Boundaries Domain genes in mulberry, Morus notabilis. Meta. Gene. 2016, 8, 44–50.
- Du, J.; Hu, S.; Yu, Q.; Wang, C.; Yang, Y.; Sun, H.; Yang, Y.; Sun, X. Genome-Wide Identification and Characterization of BrrTCP Transcription Factors in Brassica rapa ssp. rapa. Front. Plant Sci. 2017, 8, 1588.
- Guo, B.J.; Wang, J.; Lin, S.; Tian, Z.; Zhou, K.; Luan, H.Y.; Lyu, C.; Zhang, X.-Z.; Xu, R.-G. A genome-wide analysis of the ASYMMETRIC LEAVES2/LATERAL ORGAN BOUNDARIES (AS2/LOB) gene family in barley (Hordeum vulgare L.). J. Zhejiang Univ Sci. B 2016, 17, 763–774.
- Ohashi-Ito, K.; Iwamoto, K.; Fukuda, H. LOB DOMAIN-CONTAINING PROTEIN 15 Positively Regulates Expression of VND7, a Master Regulator of Tracheary Elements. Plant Cell Physiol. 2018, 59, 989–996.
- Sun, X.; Feng, Z.; Meng, L.; Zhu, J.; Geitmann, A. Arabidopsis ASL11/LBD15 is involved in shoot apical meristem development and regulates WUS expression. Planta 2013, 237, 1367–1378.
More