A dust collection system removes the dust contents of an industrial environment to provide a comfortable work environment and meet safety and health regulations. The system takes the dust particles and carries them outside for disposal or reuse possibilities.
- fluid mechanics
- pneumatic conveying
- multiphase flows
- dust collector
- industrial control
- energy efficiency
1. Introduction
| Sector | Petawatt-Hours | Percentage |
|---|---|---|
| Residential | 20.98 | 20.98 |
| Commercial | 17.94 | 17.94 |
| Industrial | 95.75 | 32.53 |
| Transportation | 84.02 | 28.55 |
| Total | 272.43 | 100 |
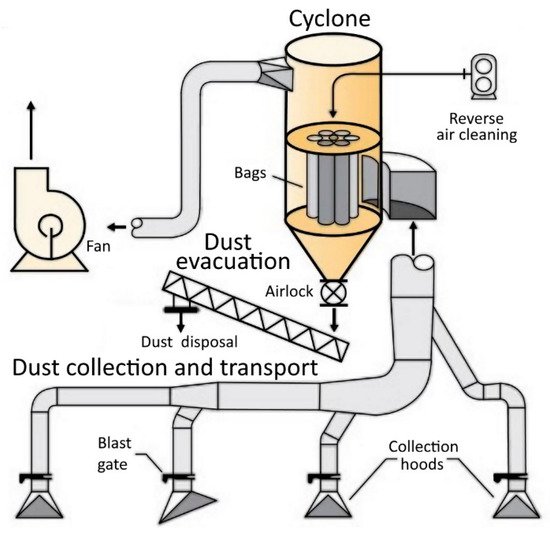
2. Dust Collector System Overview
-
The cyclone with its centrifugal pump (fan) and filter units (bags)
-
The dust evacuation sub-system (airlock and dust disposal)
-
The dust collection and transport circuits (cut-off valves (blast gates) and ducting)
3. Cyclones
4. Pneumatic conveying
The principle of pneumatic conveying rests on the transport properties of a fluid, usually air, to efficiently carry bulk products from a point of delivery to a point of transformation. Setting aside the cyclone and filtering system which serve to separate the solid phase from the fluid phase, the pneumatic conveying system is composed of a turbine, blower or fan, and a network of ducts. The turbine produces the fluid movement, and the ducting directs the solids to the discharge point. This transport method is often preferred to mechanical conveyors because of its lower equipment costs and ease of maintenance [12].
The principle rests on the action of fluidization of beds of particles: a fluid flows through a packed bed of particles at sufficient velocities to loosen the particles and carry them in a particle-fluid mixture that behaves very much like a single-phased fluid [7][13]. The fluidization can be divided into distinct regimes. The first fluidization phase can be described as air being forced through a bed of particles causing a pressure drop across the bed. As the pressure drop increases, it becomes sufficient to support the particles in suspension in the air flow: this is the minimum fluidization velocity. If the air flow continues to increase, formation of bubbles occurs, in which the particles are carried. These bubbles will become slugs (or plugs) when the velocity continues to increase [14].The design parameters that direct a particular pneumatic conveying system are imposed by the particles to be carried. According to Klinzing [12] it is important to consider the properties of the particles to be carried in the system, prior to its design:
- Average particle size and size distribution
- Percent of particles < 200 μm
- Assessment of the characteristic of stickiness
- Moisture content
- True density and bulk density of the particles
The main element of the problem rests on the nature of the flow in the system. The charge on the system is directly proportional to the quantity of material to transport, but also pertains to the configuration of the ducting network and the surrounding conditions (temperature, humidity, atmospheric pressure).
Multiphase flows composed of a solid and a gas phase are primarily characterized by their solid particle contents. According to the volume fraction αs of the solid phase of the flow, it can be characterized as a dilute or dense flow.
The increase of particle density in the flow will affect the mode of transport by changing the flow pattern.
The profiles shown in these flow patterns demonstrate the impact of the transport velocities on the overall performance of the system. When the velocity is sufficient to transport all the particles in the flow, the distribution of particles in the duct is homogenous and there is little deposition.
Manjula et al.[15] describe the difference in dilute and dense flows: in dilute multiphase flows, the bulk of the particles are transported by being suspended in the transporting gas; if the gas velocity is reduced, the flow of particles starts to display dune-like features or definite plugs of particles and most of the particles are no longer suspended in the transporting gas. This last situation describes a dense multiphase flow. From this description, one can readily assume that the effect of varying density will also affect the flow of particles.
As the density of particles increases or inversely as the velocity decreases, the flow starts to segregate into regions of higher density and the formation of dunes takes place. Further increase of the density will develop a slug flow and eventually the formation of a stationary layer of particles in the duct.
The relation between the pressure and the velocity can be associated with the density of particles in the flow. The behavior of pressure in a flow is similar to that of a potential difference in an electric circuit: the more there are resistances in the circuit, the bigger the potential difference, and similarly, the more there are resistances to the free flow of the fluid in the pipes, the higher the pressure differential [16].
A dilute particle phase will present very little resistance to the flow, hence low pressure buildup. And since the flow does not contain many particles, the velocity is maximum, being affected very little. Inversely, if the particle phase is dense, it means there are more particles to carry, hence more resistance to the flow, and higher pressure. The velocity is greatly affected by the dense particle phase. This is based on the principles of conservation of energy and explained by Thomson’s [17].
To improve the efficiency of a dust collecting system, it becomes imperative to determine the type of flow that is optimal, in order to set the parameter standards to reach. In a study of the prediction modes of flow in pneumatic conveying systems, Jones and Williams[19] established that the optimal mode of flow is a dense particle phase flow, rather than a dilute phase flow. Dense particle flows can be distinguished between two classes: a fluidized dense phase which is characterized by a high air retention and low permeability, and a plug-type (or slug-type) flow for materials that de-aerates quickly and possesses a high permeability [19].
5. Multiphase Viscous Flow in Ducts
A dust collecting system is composed of various ducting elements that direct the collected particles to the cyclone. The typical elements are the ducts themselves, with their respective shape, size and inner surface roughness. The rest of the elements are accessories that help to link together the network, such as elbows, junctions and transition pieces. Figure 4 shows a rendering of a typical dust collecting network.
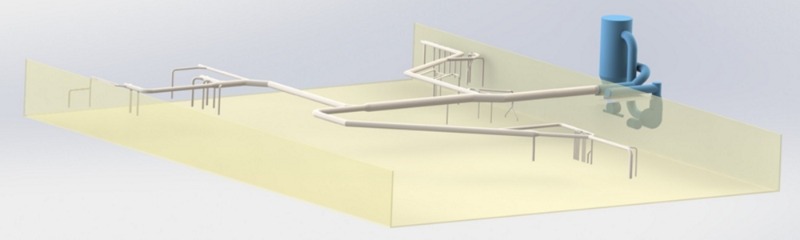
Figure 4: dust collecting network.
The performance of the ducting network is characterized by its effects on the flow, hence the loss of transport power along the ducts. This loss is a function of the pressure drop in the ducting.
The pressure drop due to the fluid can be calculated from the following equation, where fD is the Darcy friction factor of the interior surface of the pipe.
 where
where
Δp is in Pa
ρf is in kg/m3
uf is in m/s
L and D are in m
Many studies [20][21][22][23][24][25][26] were conducted to determine more precisely the friction factor according to the surface roughness of the piping used. According to many fluid mechanics manuals like White[27], the most widely used study is from Moody [28] which gave the Moody chart for evaluating the friction factor of a single-phase flow in a pipe.
Any dust collecting system is basically composed of a typical matrix element of two pipes joining into one. Figure 5 shows this element of which the whole network can be drawn as a combination of many such elements. From this it can be deduced that the principles of conservation of mass can be applied as per the following equation, and according to the Reynolds transport theorem.

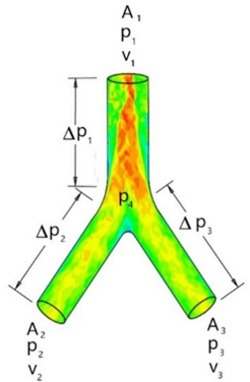 Figure 5: typical mesh element
In a dust collecting system the entry volumes are at points 2 and 3, and the outlet volume is at point 1. This typical control volume can be used as the basis for the elaboration of the matrices that will be used to develop the model of the system. The model will render velocity profiles to maintain at each dust collection inlet to assure proper transport as to guaranty a dust free work environment for the surrounding workers. The velocity being a function of the pressure differential, the following expressions describe this relation.


Since the density and the conduit areas are known and static, we can transfer these two parameters into the constants ci and the previous expression becomes

and a matrix system can be derived

We want to guaranty a sufficient transport velocity at each pickup inlet, so the matrices system will verify that

6. Conclusion
The influencing parameters which pertain to the cyclone are the inlet velocity and the pressure drop between the inlet and the outlet. The influencing parameters for the pneumatic transport of the particles, from their origin points to the cyclone are the velocities and pressure drops, but another parameter presents an influence, the density of the material being transported. All three parameters influence each other and need to be considered as such.
Multiphase flows in a ducting network can be analysed with a matrix and help to conclude that the velocities must be controlled in order to maintain a sufficient transport performance. Ultimately, it can evaluated that the velocity vi at each moment, this velocity being the actual air-dust mixture velocity at the dust collector entry, hence in direct relation to the driving motor's speed, which is what can be controled in such a system.
References
- Total Energy . Total Energy. Retrieved 2022-2-25
- Conti, J.H., Paul; Diefenderfer, Jim; LaRose, Angelina; Turnure, James T.; Westfall, Lynn; International Energy outlook 2016. U.S. Energy Information Administration 2016, 1, 1.
- Energy. Our World in Data . Energy. Retrieved 2022-2-25
- Bunse, K., et al.; Integrating energy efficiency performance in production management–gap analysis between industrial needs and scientific literature.. Journal of Cleaner Production 2011, 19, 667-679.
- Kaya, D., et al.; Energy conservation in compressed-air systems. International Journal of Energy Research 2002, 26, 837-849.
- Clarke, K.L., T. Pugsley, and G.A. Hill; Fluidization of moist sawdust in binary particle systems in a gas–solid fluidized bed. Chemical Engineering Science 2005, 60, 6909-6918.
- Kunii, D.a.O.L.. Fluidization Engineering; M.I.T. Howard Brenner, Eds.; Butterworth-Heinemann: Stoneham, MA, USA, 1991; pp. 491.
- Klinzing, G.E.; Historical Review of Pneumatic Conveying. KONA Powder and Particle Journal 2018, 35, 150-159.
- Twin Lobe High Pressure Blowers . Roots. Retrieved 2022-2-25
- Leith, D.a.D.M.; Cyclone performance and design. Atmospheric Environment 1973, 7, 527-549.
- Azadi, M.; An analytical study of the effect of inlet velocity on the cyclone performance using mathematical models. Powder Technology 2012, 217, 121-127.
- George E. Klinzing; A review of pneumatic conveying status, advances and projections. Powder Technology 2018, 333, 78-90, 10.1016/j.powtec.2018.04.012.
- Subramanian, R.S.; Flow through Packed and Fluidized Beds. Department of Chemical and Biomolecular Engineering Clarkson University 2002, 1, 1-6.
- Gidaspow, D.. Multiphase Flow and Fluidization; United Kingdom Edition, Eds.; Academic Press: San Diedo, California, U.S., 1994; pp. 467.
- E.V.P.J. Manjula; W.K. Hiromi Ariyaratne; Chandana Ratnayake; Morten C. Melaaen; A review of CFD modelling studies on pneumatic conveying and challenges in modelling offshore drill cuttings transport. Powder Technology 2016, 305, 782-793, 10.1016/j.powtec.2016.10.026.
- Shrikant V. Dhodapkar; George E. Klinzing; Pressure fluctuations in pneumatic conveying systems. Powder Technology 1993, 74, 179-195, 10.1016/0032-5910(93)87010-l.
- Thomson, W.J.. Transport phenomena; Prentice Hall: Upper Saddle River, New Jersey, U.S., 2000; pp. 509.
- Are there different types of pneumatic conveying systems? . DE DIETRICH PROCESS SYSTEMS. Retrieved 2022-2-25
- Mark G. Jones; Kenneth Williams; Predicting the mode of flow in pneumatic conveying systems—A review. Particuology 2008, 6, 289-300, 10.1016/j.partic.2008.05.003.
- Chunbao Charles Xu; Jesse Zhu; PREDICTION OF THE MINIMUM FLUIDIZATION VELOCITY FOR FINE PARTICLES OF VARIOUS DEGREES OF COHESIVENESS. Chemical Engineering Communications 2008, 196, 499-517, 10.1080/00986440802483855.
- Ergun, S.; Fluid Flow Through Packed Columns. Chemical Engineering Progress 1952, 48, 89-94.
- COLEBROOK, C.F., et al.; CORRESPONDENCE. TURBULENT FLOW IN PIPES, WITH PARTICULAR REFERENCE TO THE TRANSITION REGION BETWEEN THE SMOOTH AND ROUGH PIPE LAWS. (INCLUDES PLATES). Journal of the Institution of Civil Engineers 1939, 12, 393-422.
- Fadi Z. Kamand; Hydraulic Friction Factors for Pipe Flow. Journal of Irrigation and Drainage Engineering 1988, 114, 311-323, 10.1061/(asce)0733-9437(1988)114:2(311).
- B. J. McKEON; C. J. Swanson; M. V. Zagarola; R. J. Donnelly; A. J. Smits; Friction factors for smooth pipe flow. Journal of Fluid Mechanics 2004, 511, 41-44, 10.1017/s0022112004009796.
- H. Herwig; D. Gloss; T. Wenterodt; A new approach to understanding and modelling the influence of wall roughness on friction factors for pipe and channel flows. Journal of Fluid Mechanics 2008, 613, 35-53, 10.1017/s0022112008003534.
- Kiijarvi, J.; Darcy friction factor formulae in turbulent pipe flow. Lunowa Fluid Mechanics Paper 2011, 110727, 1-11.
- White, F.M.. Fluid Mechanics; McGraw-Hill: New-York, 2016; pp. 848.
- Moody, L.F.; Friction Factors for Pipe Flow. Transactions of the A.S.M.E. 1944, 1, 671-684.