Your browser does not fully support modern features. Please upgrade for a smoother experience.
Please note this is a comparison between Version 2 by Rita Xu and Version 1 by Pasqualina Liana Scognamiglio.
Benzofuran derivatives are synthetic compounds that are finding an increasing interest in the scientific community not only as building blocks for the realization of new materials, but also as potential drugs thanks to their ability to interact with nucleic acids, interfere with the amyloid peptide aggregation and cancer cell cycle. However, their ability to interact with proteins is a theme still in need of investigation for the therapeutic importance that benzofurans could have in the modulation of protein-driven processes, and for the possibility of making use of serum albumins as benzofurans delivery systems.
- serum albumin
- benzofuran ligands
- circular dichroism
- fluorescence titration
- molecular docking
1. Introduction
Albumins are proteins with high peptide sequences homology, with bovine and human albumins sharing 76% identity [1], abundant in the circulatory system of mammals where they contribute significantly to the osmotic blood pressure [2]. Albumins, and primarily BSA, are typically used as protein models and their binding with molecules proposed for biotechnological applications is investigated very extensively in both academic and industrial research areas [2,3,4,5,6,7,8,9][2][3][4][5][6][7][8][9]. Structurally, albumins present two domains with at least two high-affinity binding sites, as well as other various low-affinity ones [10].
The major physiological function of albumins is the transport of many classes of ligands, including cations, fatty acids, steroids, and amino acids present in the bloodstream to their target organs [1,11][1][11]. Interestingly, this binding has also driven the pharmaceutical use of albumins as drug carriers [12,13,14][12][13][14].
Albumins are quite soluble, but frequent encounters between their molecules lead to their aggregation, as ascertained for example with BSA, ref. [15] leading to dimers and higher aggregates [16,17][16][17], a major factor in protein function [18] and stability [19,20][19][20]. More in detail, electrophoretic analysis in nondenaturing gels revealed that the monomer/dimer ratio of BSA is higher than 80% [21], but the albumin oligomerization state can be influenced by the interactions with ligands that, as observed in the case of myristic acid, when ligated to the dimers make them less stable and more prone to dissociate into monomers [22]. Interestingly, albumin oligomerization leads to substantial amounts of β-sheet structures which are directly correlated with aggregation [22[22][23],23], as well as a thermal stabilization (by more than 3 °C) of the serum albumin in the dimeric form with respect to the monomer [24].
Oxygen-containing heterocycles are an important class of molecules, that exhibit interesting biological and therapeutic activities and share structural similarity with several natural bioactive compounds [25,26,27][25][26][27]. Among these, benzofurans have gained a considerable interest being endowed with a wide range of biological activities such as antibiotic [28,29[28][29][30],30], anti-inflammatory [31], anti-parasitic [32], anticancer [33,34,35][33][34][35], neuroprotective and analgesic [36] effects. As for the molecular basis of the anticancer activity of benzofurans, the nucleic acid binding [37], as well as the inhibition of particular serine/threonine kinases involved in tumour development, and cancer cell cycle modifications are some of the proposed mechanisms [34,38][34][38].
Some of us have recently investigated the biological properties of compounds containing 4-nitrophenyl-functionalized benzofuran (BF) and benzodifuran (BDF) moieties, finding that both classes were endowed with antiproliferative activity on prostatic tumour cells (PC-3) in direct correlation with the lipophilicity of the heterocycles, with the compounds denominated BDF1 and especially BF1 (Figure 1) being the most active candidates [38]. As a prosecution of that previous work, we decided to investigate the ability of both 4-nitrophenyl-functionalized benzofuran and benzodifuran derivatives to interact with proteins, using as a model bovine serum albumin (BSA), for a better comprehension of the analogies and differences that the heteroaromatic derivatives display with respect to the binding with this fundamental family of biomacromolecules involved in numerous therapeutically relevant pathways.
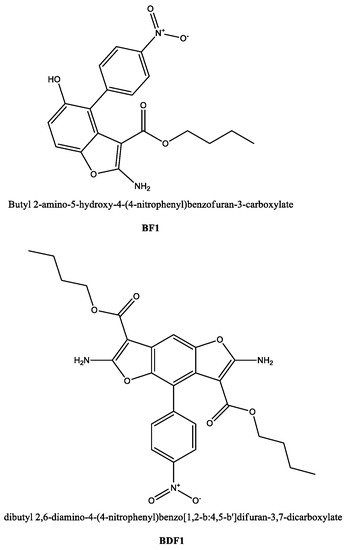
Figure 1.
Chemical structures for the compounds studied as protein ligands in the current work.
2. CD Binding Studies on BSA in Complex with BF1 and BDF1
It is well known that the BSA secondary structure is mainly dominated by α-helix structures, which account for approximately 60% of its structure, while β–sheet content is less than 10% [57][39]. Accordingly, in our experiments, the far-UV CD spectra of unliganded BSA exhibited the characteristic features of the typical helical structure of the proteins with two negative bands at 208 and 222 nm (Figure 2, blue). After addition of BF1, the signal intensity at 208 nm was slightly greater than at 222 nm (line dark green), which suggested an increase in β-sheet content in the protein structure as a consequence of the interaction with the ligand as reported in the literature for similar spectral changes [58][40]. On the other hand, the addition of the benzodifuran BDF1 led to the spectral curve in red (Figure 2), which did not show any predominant band between 208 and 222 nm.
These evidences suggest that the secondary structure of BSA underwent slight but significant modifications as consequence of the binding with BF1 and BDF1, with the former being able also to increase slightly the β-sheet content of the albumin structure. To achieve a more quantitative information on this aspect, we then performed a deconvolution of the CD spectra and reported the variations of secondary structure contents of BSA in the absence and presence of an excess of benzofurans, as shown in Table 1.
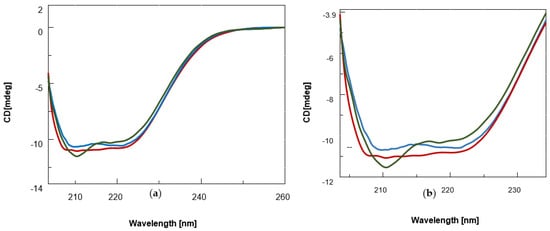
Figure 2. (a) CD spectra of BSA (0.12 μM, blue) and its complexes with the benzofuran derivatives (25 nmol) BF1 (dark green) and BDF1 (red) in 90 mM NaCl, 1.8 mM KCl, 6.6 mM Na2HPO4, and 1.2 mM KH2PO4 (pH = 7.5) at 20 °C. (b) Zoomed-in view of the CD bands between 200–235 nm.
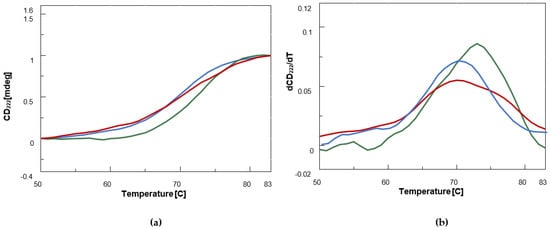
Table 1. Variation in BSA structure content (%) determined by benzofuran ligands. Please note that even though only minor changes can be detected after ligand binding, BF1 determines an increase in β-sheet more significant than BDF1.
| Δ(BF1-BSA) (%) | Δ(BDF1-BSA) (%) | |
|---|---|---|
| α | +0.06 | −0.79 |
| β | +5.70 | +1.00 |
| Random coil | −5.76 | −0.21 |
According to this table, BDF1 provoked only minor secondary structure changes of BSA, while a certain increase in β-sheet (+5.70%) was observed in the case of the complex of the albumin with BF1 confirming our initial analysis and the literature considerations on the increase in the 208 nm/222 nm band ratio [58][40]. To investigate the effect of the two classes of benzofurans on protein stability, we recorded CD denaturation curves monitoring the CD values at 222 nm vs. temperature (Figure 3a).
Figure 3. CD thermal denaturation curves [CD222 (mdeg) vs. T (°C)] (a) and first derivatives vs. T (b) plots for BSA (0.12 μM, blue) and its complexes with the benzofuran derivatives (25 nmol) BF1 (green) and BDF1 (red) in 90 mM NaCl, 1.8 mM KCl, 6.6 mM Na2HPO4, and 1.2 mM KH2PO4 (pH = 7.5) at 20 °C.
By examining the first derivative maximum of the melting curves, we could demonstrate that while BDF1 led to a slight destabilization (by less than 1 °C) of BSA structure, BF1 increased melting temperature (Tm) by about 3 °C (Figure 3b, Table 2).
Table 2. Summary table of the melting temperatures (Tm) and their variations (ΔTm) with their respective error bars, with respect to the unliganded protein1 for the complexes BF1-BSA and BDF1-BSA.
| Compound | T | m | /°C | ΔT/°C = (T | m | − T | m | BSA) |
|---|---|---|---|---|---|---|---|---|
| BF1-BSA | 72.9 ± 0.1 | +3.1 ± 0.2 | ||||||
| BDF1-BSA | 69.0 ± 0.2 | −0.8 ± 0.1 |
1 TmBSA = 69.8 ± 0.1 °C.
Taken together, the CD binding and melting studies suggested that only BF1 increases BSA β-sheet content and thermal stability, which are both features related to BSA oligomerization. Conversely, BDF1 does not significantly affect the structure elements rate in the albumin and does not provoke any thermal stabilization. This experimental evidence could be explained assuming that in binding to monomeric BSA, BDF1 prevents its aggregation, and/or that its interaction with dimer albumin does affect protein dimerization favouring dissociation into monomeric BSA, in analogy to other literature reports [22].
3. Fluorescence Studies
Fluorescence spectroscopy was also used by us to confirm BSA complex formation with BF1 and BDF1 and to have more quantitative information on the affinities of the ligands for the protein target. The fluorescence method is a sensitive tool to study the interactions between proteins such as BSA and small molecules. The molecular recognition of BSA by small molecules mainly determines a static quenching, with the fluorescence being quenched due to the formation of complexes between the fluorophore and quenchers in the ground state [59][41]. In general, proteins contain three fluorophores, i.e., the amino acids L-tryptophan, L-tyrosine and L-phenylalanine.
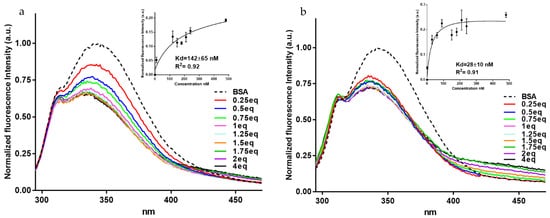
Due to the low quantum yield of L-phenylalanine and almost quenched characteristics of L-tyrosine, the intrinsic protein fluorescence occurs mainly due to the L-tryptophan. BSA possesses two L-tryptophan residues, Trp-134 and Trp-213. While this latter is situated within a hydrophobic binding pocket of the protein, Trp-134 is found on the surface in the hydrophilic region of the molecule [60][42]. In our experiment, when exciting at 280 nm, the BSA showed a strong emission band at 347 nm. Interestingly, both compounds led to albumin fluorescence quenching (Figure 4a,b) and their interaction was associated with a good affinity with dissociation rates (kD) in the nanomolar range, with BF1 showing a higher affinity than BDF1 (kD = 28.4 ± 10.1 nM vs. 142.4 ± 64.6 nM, insets of Figure 4a,b). More in detail, the BSA emission band was monitored after adding the ligands. Successive additions of benzofurans to BSA led to significant changes in the fluorescence emission. The fluorescence intensity of BSA decreased and blue-shifted by about 10 nm with the addition of increasing amounts of both ligands. The fluorescence quenching, along with the blue shifts, are indicative of the formation of a complex between the BSA and ligands. Additionally, the formation of the complex between the albumin and both benzofurans is indicative of changes of the L-tryptophan environment. After subtracting the DMSO (dimethyl sulfoxide) emission spectrum (as background signal), the fluorescence values were plotted as functions of the concentrations, and from the data fitting it was possible to calculate the apparent kD, as reported in the insets of Figure 4a,b.
Figure 4. Fluorescence titrations of BSA (120 nM) with (a) BDF1, and (b) BF1 with ligand concentrations from 30 to 480 nM. Insets: changes in the normalized fluorescence intensity as a function of ligand concentrations (nM) for the titrations of BSA with BDF1 and BF1, after the DMSO background subtraction. kD values with standard deviations determined by the fluorescence method are also reported here.
References
- Peters, T., Jr. Serum albumin. Adv. Protein Chem. 1985, 37, 161–245.
- Carter, D.C.; Ho, J.X. Structure of serum albumin. Adv. Protein Chem. 1994, 45, 153–203.
- Akdogan, Y.; Emrullahoglu, M.; Tatlidil, D.; Ucuncu, M.; Cakan-Akdogan, G. EPR studies of intermolecular interactions and competitive binding of drugs in a drug–BSA binding model. Phys. Chem. Chem. Phys. 2016, 18, 22531–22539.
- Fik-Jaskółka, M.A.; Mkrtchyan, A.F.; Saghyan, A.S.; Palumbo, R.; Belter, A.; Hayriyan, L.A.; Simonyan, H.; Roviello, V.; Roviello, G.N. Spectroscopic and SEM evidences for G4-DNA binding by a synthetic alkyne-containing amino acid with anticancer activity. Spectrochim. Acta Part A Mol. Biomol. Spectrosc. 2020, 229, 117884.
- Fik-Jaskółka, M.A.; Mkrtchyan, A.F.; Saghyan, A.S.; Palumbo, R.; Belter, A.; Hayriyan, L.A.; Simonyan, H.; Roviello, V.; Roviello, G.N. Biological macromolecule binding and anticancer activity of synthetic alkyne-containing l-phenylalanine derivatives. Amino Acids 2020, 52, 755–769.
- Liu, E.-H.; Qi, L.-W.; Li, P. Structural relationship and binding mechanisms of five flavonoids with bovine serum albumin. Molecules 2010, 15, 9092–9103.
- Szymańska, M.; Pospieszna-Markiewicz, I.; Mańka, M.; Insińska-Rak, M.; Dutkiewicz, G.; Patroniak, V.; Fik-Jaskółka, M.A. Synthesis and Spectroscopic Investigations of Schiff Base Ligand and Its Bimetallic Ag (I) Complex as DNA and BSA Binders. Biomolecules 2021, 11, 1449.
- Izawa, H.; Kinai, M.; Ifuku, S.; Morimoto, M.; Saimoto, H. Guanidinylation of Chitooligosaccharides involving internal cyclization of the Guanidino group on the reducing end and effect of Guanidinylation on protein binding ability. Biomolecules 2019, 9, 259.
- Losytskyy, M.; Chornenka, N.; Vakarov, S.; Meier-Menches, S.M.; Gerner, C.; Potocki, S.; Arion, V.B.; Gumienna-Kontecka, E.; Voloshin, Y.; Kovalska, V. Sensing of Proteins by ICD Response of Iron (II) Clathrochelates Functionalized by Carboxyalkylsulfide Groups. Biomolecules 2020, 10, 1602.
- Simard, J.R.; Zunszain, P.A.; Hamilton, J.A.; Curry, S. Location of high and low affinity fatty acid binding sites on human serum albumin revealed by NMR drug-competition analysis. J. Mol. Biol. 2006, 361, 336–351.
- Sugio, S.; Kashima, A.; Mochizuki, S.; Noda, M.; Kobayashi, K. Crystal structure of human serum albumin at 2.5 Å resolution. Protein Eng. 1999, 12, 439–446.
- Loureiro, A.; G. Azoia, N.; C. Gomes, A.; Cavaco-Paulo, A. Albumin-based nanodevices as drug carriers. Curr. Pharm. Des. 2016, 22, 1371–1390.
- Parodi, A.; Miao, J.; Soond, S.M.; Rudzińska, M.; Zamyatnin, A.A. Albumin nanovectors in cancer therapy and imaging. Biomolecules 2019, 9, 218.
- Rubio-Camacho, M.; Encinar, J.A.; Martínez-Tomé, M.J.; Esquembre, R.; Mateo, C.R. The Interaction of Temozolomide with Blood Components Suggests the Potential Use of Human Serum Albumin as a Biomimetic Carrier for the Drug. Biomolecules 2020, 10, 1015.
- Kanal, K.M.; Fullerton, G.D.; Cameron, I.L. A study of the molecular sources of nonideal osmotic pressure of bovine serum albumin solutions as a function of pH. Biophys. J. 1994, 66, 153–160.
- Van Dijk, J.; Smit, J. Size-exclusion chromatography–multiangle laser light scattering analysis of β-lactoglobulin and bovine serum albumin in aqueous solution with added salt. J. Chromatogr. A 2000, 867, 105–112.
- Squire, P.G.; Moser, P.; O’Konski, C.T. Hydrodynamic properties of bovine serum albumin monomer and dimer. Biochemistry 1968, 7, 4261–4272.
- Kovalsky, O.; Lung, F.-D.T.; Roller, P.P.; Fornace, A.J. Oligomerization of human Gadd45a protein. J. Biol. Chem. 2001, 276, 39330–39339.
- Levi, V.; Rossi, J.P.; Castello, P.R.; Flecha, F.L.G. Structural significance of the plasma membrane calcium pump oligomerization. Biophys. J. 2002, 82, 437–446.
- Bowie, J.U. Stabilizing membrane proteins. Curr. Opin. Struct. Biol. 2001, 11, 397–402.
- Sah, H. Stabilization of proteins against methylene chloride/water interface-induced denaturation and aggregation. J. Control. Release 1999, 58, 143–151.
- Chubarov, A.; Spitsyna, A.; Krumkacheva, O.; Mitin, D.; Suvorov, D.; Tormyshev, V.; Fedin, M.; Bowman, M.K.; Bagryanskaya, E. Reversible Dimerization of Human Serum Albumin. Molecules 2020, 26, 108.
- Wetzel, R.; Becker, M.; Behlke, J.; Billwitz, H.; BoHm, S.; Ebert, B.; Hamann, H.; Krumbiegel, J.; Lassmann, G. Temperature Behaviour of Human Serum Albumin. Eur. J. Biochem. 1980, 104, 469–478.
- Taguchi, K.; Giam Chuang, V.T.; Maruyama, T.; Otagiri, M. Pharmaceutical Aspects of the Recombinant Human Serum Albumin Dimer: Structural Characteristics, Biological Properties, and Medical Applications. J. Pharm. Sci. 2012, 101, 3033–3046.
- DeSimone, R.; Currie, K.; Mitchell, S.; Darrow, J.; Pippin, D. Privileged Structures: Applications in Drug Discovery. Comb. Chem. High Throughput Screen. 2004, 7, 473–493.
- D’Errico, S.; Oliviero, G.; Amato, J.; Borbone, N.; Cerullo, V.; Hemminki, A.; Piccialli, V.; Zaccaria, S.; Mayol, L.; Piccialli, G. Synthesis and biological evaluation of unprecedented ring-expanded nucleosides (RENs) containing the imidazo oxadiazepine ring system. Chem. Commun. 2012, 48, 9310.
- Oliviero, G.; Amato, J.; Borbone, N.; D’Errico, S.; Piccialli, G.; Mayol, L. Synthesis of N-1 and ribose modified inosine analogues on solid support. Tetrahedron Lett. 2007, 48, 397–400.
- Alper-Hayta, S.; Arisoy, M.; Temiz-Arpaci, Ö.; Yildiz, I.; Aki, E.; Özkan, S.; Kaynak, F. Synthesis, antimicrobial activity, pharmacophore analysis of some new 2-(substitutedphenyl/benzyl)-5-benzoxazoles. Eur. J. Med. Chem. 2008, 43, 2568–2578.
- Soni, J.N.; Soman, S.S. Synthesis and antimicrobial evaluation of amide derivatives of benzodifuran-2-carboxylic acid. Eur. J. Med. Chem. 2014, 75, 77–81.
- Ashok, D.; Sudershan, K.; Khalilullah, M. Solvent-free microwave-assisted synthesis ofE-(1)-(6-benzoyl-3,5-dimethylfurobenzofuran-2-yl)-3-(aryl)-2-propen-1-ones and their antibacterial activity. Green Chem. Lett. Rev. 2012, 5, 121–125.
- Feng, Z.; Mohapatra, S.; Klimko, P.G.; Hellberg, M.R.; May, J.A.; Kelly, C.; Williams, G.; McLaughlin, M.A.; Sharif, N.A. Novel benzodifuran analogs as potent 5-HT2A receptor agonists with ocular hypotensive activity. Bioorganic Med. Chem. Lett. 2007, 17, 2998–3002.
- Thévenin, M.; Thoret, S.; Grellier, P.; Dubois, J. Synthesis of polysubstituted benzofuran derivatives as novel inhibitors of parasitic growth. Bioorganic Med. Chem. 2013, 21, 4885–4892.
- Hayakawa, I.; Shioya, R.; Agatsuma, T.; Furukawa, H.; Naruto, S.; Sugano, Y. 4-Hydroxy-3-methyl-6-phenylbenzofuran-2-carboxylic acid ethyl ester derivatives as potent anti-tumor agents. Bioorganic Med. Chem. Lett. 2004, 14, 455–458.
- Xie, F.; Zhu, H.; Zhang, H.; Lang, Q.; Tang, L.; Huang, Q.; Yu, L. In vitro and in vivo characterization of a benzofuran derivative, a potential anticancer agent, as a novel Aurora B kinase inhibitor. Eur. J. Med. Chem. 2015, 89, 310–319.
- Musumeci, D.; Roviello, G.N.; Rigione, G.; Capasso, D.; Di Gaetano, S.; Riccardi, C.; Roviello, V.; Montesarchio, D. Benzodifuran Derivatives as Potential Antiproliferative Agents: Possible Correlation between Their Bioactivity and Aggregation Properties. ChemPlusChem 2017, 82, 251–260.
- Wang, Y.-N.; Liu, M.-F.; Hou, W.-Z.; Xu, R.-M.; Gao, J.; Lu, A.-Q.; Xie, M.-P.; Li, L.; Zhang, J.-J.; Peng, Y.; et al. Bioactive Benzofuran Derivatives from Cortex Mori Radicis, and Their Neuroprotective and Analgesic Activities Mediated by mGluR1. Molecules 2017, 22, 236.
- Roviello, G.N.; Roviello, V.; Musumeci, D.; Pedone, C. Synthesis of a novel benzodifuran derivative and its molecular recognition of poly rA RNA. Biol. Chem. 2013, 394, 1235–1239.
- Carella, A.; Roviello, V.; Iannitti, R.; Palumbo, R.; La Manna, S.; Marasco, D.; Trifuoggi, M.; Diana, R.; Roviello, G.N. Evaluating the biological properties of synthetic 4-nitrophenyl functionalized benzofuran derivatives with telomeric DNA binding and antiproliferative activities. Int. J. Biol. Macromol. 2019, 121, 77–88.
- Ye, F.; An, Y.; Qin, D.; Yang, L.; She, L.; Xing, R. Spectroscopic study on the effect of crystallization of the hydroxyapatite on the secondary structure of bovine serum albumin. Guang Pu Xue Yu Guang Pu Fen Xi 2007, 27, 321–324.
- Nepal, D.; Geckeler, K.E. pH-sensitive dispersion and debundling of single-walled carbon nanotubes: Lysozyme as a tool. Small 2006, 2, 406–412.
- Sun, C.; Yang, J.; Wu, X.; Huang, X.; Wang, F.; Liu, S. Unfolding and refolding of bovine serum albumin induced by cetylpyridinium bromide. Biophys. J. 2005, 88, 3518–3524.
- Dezhampanah, H.; Esmaili, M.; Jampour, S. Spectroscopic and molecular docking studies on interaction of two Schiff base complexes with bovine serum albumin. J. Biomol. Struct. Dyn. 2020, 38, 2650–2658.
More