MegalobramaMegalobrama, a genus of cyprinid fish, is thean economically most important freshwater fish genus in widely distributed in major waters of China. Germplasm resources ofHere, we report the genome resequencing of 180 Megalobrama fishave been depleting as a result of environmental degrad including M. amblycephala, M. skolkovii, M. hoffmanni, and M. pellegrini. Population and artificial factors. By usingstructure indicated that geographically divergent Megalobrama population genomics, the s were separated into six subgroups. A phylogenetic information of species d tree showed that M. skolkovii was more closely related to M. pellegrini than other species and M. hoffmanni was clustered apart from other Megalobrama species, showing a high nucleotide diversity can be established with the advent of high-throughput sequencing. Researchers established the whole genome database ofin geographic groups. Treemix validated gene flow from M. amblycephala to M. skolkovii, suggesting that introgression may provide an important source of genetic variation in the M. skolkovii populations. According to the demographic history analysis, it is speculated that Megalobrama might have been originally distributed in the Pearl River with some spread to Hainan Island and northern China Megalobramadue ptopulations us lower sea levels during the whole glacial period. Whole-genome re-sequencing technology, explored population genetic structure, and inferred comprehensive evolutionary relationships using principal component analysis and population structure analysiselective sweeps analysis demonstrated that M. amblycephala likely developed an enhanced energy metabolism mostly through fatty acid degradation pathways whereas M. hoffmanni possibly regulate lipid absorption via the cholesterol metabolism pathway. Taken together, this study provides a valuable genomic resource for future genetic investigations aiming to improve genome-assisted breeding of Megalobrama species.
- genome resequencing
- Megalobrama
- population structure
- demographic history
- feeding habits
1. Introduction
2. Genome Resequencing and Variation Calling
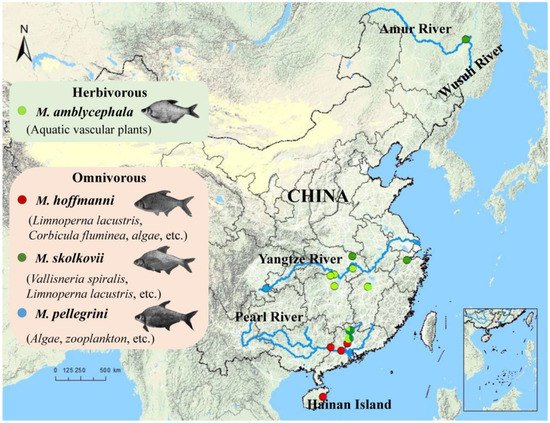
3. Phylogeny and Population Structure Analysis
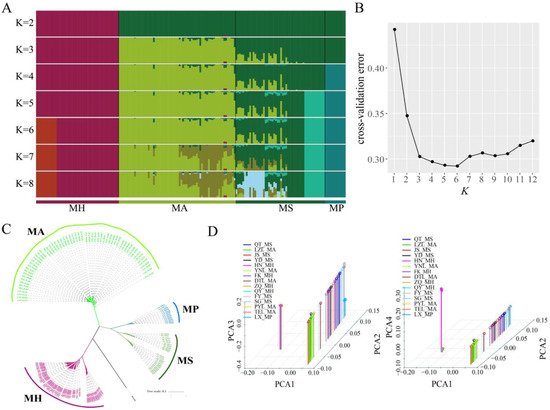
Figure 2. Phylogenetic analysis of different Megalobrama geographical populations. (
Phylogenetic analysis of different Megalobrama geographical populations. (A) Population genetic structure of 180 Megalobrama fish. The length of each colored segment represents the proportion of the individual genome inferred from ancestral populations (K = 2 - 8). The species name is at the bottom. (
) Population genetic structure of 180 Megalobrama fish. The length of each colored segment represents the proportion of the individual genome inferred from ancestral populations (K = 2–8). The species name is at the bottom. (B) Cross-validation (CV) error for varying values of K in the admixture analysis. The minimum of estimated CV error on K = 6 suggests the most suitable number of ancestral populations. (
) Cross-validation (CV) error for varying values of K in the admixture analysis. The minimum of estimated CV error on K = 6 suggests the most suitable number of ancestral populations. (C) Maximum-likelihood-based phylogenetic tree constructed using no admixed individuals. The scale bar represents pairwise distances between different individuals. Different colors represent different Megalobrama species. (
) Maximum-likelihood-based phylogenetic tree constructed using no admixed individuals. The scale bar represents pairwise distances between different individuals. Different colors represent different Megalobrama species. (D) Principal component analysis (PCA) of Megalobrama populations. Eigenvector 1, 2, 3, and 4 explained 45.06%, 18.03%, 4.00%, and 1.73% of the total variance, respectively. MH refers to M. hoffmanni, MA to M. amblycephala, MS to M. skolkovii, MP to M. pellegrini.
) Principal component analysis (PCA) of Megalobrama populations. Eigenvector 1, 2, 3, and 4 explained 45.06%, 18.03%, 4.00%, and 1.73% of the total variance, respectively. MH refers to M. hoffmanni, MA to M. amblycephala, MS to M. skolkovii, MP to M. pellegrini.4. M. amblycephala Introgression into M. skolkovii
In this entry, researchers used Treemix to confirm the gene flow from M. amblycephala to M. skolkovii. Using M. hoffmanni as the outgroup, among the four Megalobrama species, only one migration event was inferred from the M. amblycephala to the M. skolkovii with approximately 50.77% DNA gene flow from M. amblycephala to M. skolkovii (
In this study, we used Treemix to confirm the gene flow from M. amblycephala to M. skolkovii. Using M. hoffmanni as the outgroup, among the four Megalobrama species, only one migration event was inferred from the M. amblycephala to the M. skolkovii with approximately 50.77% DNA gene flow from M. amblycephala to M. skolkovii (Figure 3A). Moreover, the migration patterns of these two species’ geographic populations demonstrated that LZL, DTL, TEL, YNL, and PYL M. amblycephala populations introgressed into the FY, SG, QT, and JS M. skolkovii populations. Notably, the migration weight of M. amblycephala introgressed into QT and JS populations was greater than that of the FY and SG populations.
A). Moreover, the migration patterns of these two species’ geographic populations demonstrated that LZL, DTL, TEL, YNL, and PYL M. amblycephala populations introgressed into the FY, SG, QT, and JS M. skolkovii populations. Notably, the migration weight of M. amblycephala introgressed into QT and JS populations was greater than that of the FY and SG populations (Figure S2).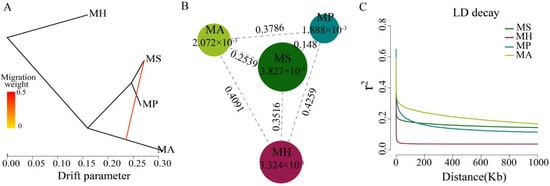
Figure 3. Population genetic analysis of Megalobrama species. (
Population genetic analysis of Megalobrama species. (A) Gene flow analysis of Megalobrama species. Arrows indicate migration events that occur between populations. The heat map indicates migration weight. (
) Gene flow analysis of Megalobrama species. Arrows indicate migration events that occur between populations. The heat map indicates migration weight. (B) Nucleotide polymorphism (π), and differentiation index (Fst) of the four Megalobrama species. The largest circle represents the large π value, and the longer line segment represents the large Fst value. MH refers to M. hoffmanni, MA to M. amblycephala, MS to M. skolkovii, MP to M. pellegrini. (
) Nucleotide polymorphism (π), and differentiation index (Fst) of the four Megalobrama species. The largest circle represents the large π value, and the longer line segment represents the large Fst value. MH refers to M. hoffmanni, MA to M. amblycephala, MS to M. skolkovii, MP to M. pellegrini. (C) Decay of linkage disequilibrium (LD) patterns for the four Megalobrama species inferred by the phylogenetic trees.
) Decay of linkage disequilibrium (LD) patterns for the four Megalobrama species inferred by the phylogenetic trees.5. Linkage Disequilibrium and Genetic Diversity
The genetic diversity (π) of M. skolkovii and M. hoffmanni were estimated to be 3.827 × 10
The genetic diversity (π) of M. skolkovii and M. hoffmanni were estimated to be 3.827 × 10⁻³ and 3.324 × 10
and 3.324 × 10⁻³, respectively, which was relatively high in comparison to M. amblycephala (2.072 × 10
, respectively, which was relatively high in comparison to M. amblycephala (2.072 × 10⁻³) and M. pellegrini (1.888 × 10
) and M. pellegrini (1.888 × 10⁻³). The low genetic differentiation (Fst) between M. skolkovii and M. pellegrini (0.148), and the high Fst between M. hoffmanni and M. amblycephala (0.4091), M. skolkovii (0.3516), and M. pellegrini (0.4259) (Figure 3B) are consistent with the phylogeny analysis. Between the four Megalobrama species, linkage disequilibrium (LD) and correlation coefficient (r
). The low genetic differentiation (Fst) between M. skolkovii and M. pellegrini (0.148), and the high Fst between M. hoffmanni and M. amblycephala (0.4091), M. skolkovii (0.3516), and M. pellegrini (0.4259) (Figure 3B) are consistent with the phylogeny analysis. Between the four Megalobrama species, linkage disequilibrium (LD) and correlation coefficient (r2) values were calculated. The decay of LD reached half the maximum average r
) values were calculated. The decay of LD reached half the maximum average r2 at a distance of 24 Kb, 4 Kb, 1.8 Kb, and 0.2 Kb for M. amblycephala, M. pellegrini, M. skolkovii, and M. hoffmanni, respectively (Figure 3C). Therefore, M. skolkovii and M. hoffmanni displayed a faster LD decay rate than M. amblycephala and M. pellegrini.
at a distance of 24 Kb, 4 Kb, 1.8 Kb, and 0.2 Kb for M. amblycephala, M. pellegrini, M. skolkovii, and M. hoffmanni, respectively (Figure 3C). Therefore, M. skolkovii and M. hoffmanni displayed a faster LD decay rate than M. amblycephala and M. pellegrini.6. Demographic History of Megalobarma Species and Species Delimitation
The split times based on the relative cross-coalescent rates (RCCR) among the four Megalobrama species reached 0.5 suggesting a split between M. hoffmanni and other species 3–5 Mya. The cross-coalescence analysis suggested a decline to 0.5 between M. amblycephala and M. skolkovii or M. pellegrini at ~1.3 Mya, and a decline to 0.5 between M. skolkovii and M. pellegrini around 0.3 - 0.4 Mya (
The split times based on the relative cross-coalescent rates (RCCR) among the four Megalobrama species reached 0.5 suggesting a split between M. hoffmanni and other species 3–5 Mya. The cross-coalescence analysis suggested a decline to 0.5 between M. amblycephala and M. skolkovii or M. pellegrini at ~1.3 Mya, and a decline to 0.5 between M. skolkovii and M. pellegrini around 0.3–0.4 Mya (Figure 4A). The PSMC method used to reconstruct the demographic history of six Megalobrama subgroups indicated that the effective population size (Ne) peak of M. amblycephala and M. pellegrini was 2.5 Mya and 4 Mya, respectively, compared to 3 - 4 Mya of the Ne peak for the M. skolkovii subgroups. After that, the FY M. skolkovii subgroup continued to shrink, whilst the Ne curves of other M. skolkovii subgroup split at 0.2 Mya expanded (
A). The PSMC method used to reconstruct the demographic history of six Megalobrama subgroups indicated that the effective population size (Ne) peak of M. amblycephala and M. pellegrini was 2.5 Mya and 4 Mya, respectively, compared to 3–4 Mya of the Ne peak for the M. skolkovii subgroups. After that, the FY M. skolkovii subgroup continued to shrink, whilst the Ne curves of other M. skolkovii subgroup split at 0.2 Mya expanded (Figure 4B). Moreover, the two Ne peaks of M. hoffmanni occurred at 0.3 Mya and 5 Mya, respectively, during the middle pleistocene geological period (
B). Moreover, the two Ne peaks of M. hoffmanni occurred at 0.3 Mya and 5 Mya, respectively, during the middle pleistocene geological period (Figure 4C). Interestingly, the split of Ne curves of the two M. hoffmanni subgroups occurred about 0.4 Mya, indicating a population divergence at this time. The ancestral reconstruction analysis revealed two different biogeographic evolutionary processes to investigate the ancestral distribution of genus Megalobrama. According to the BBM analysis, the genus Megalobrama was originally distributed in the Pearl River and then spread to Hainan Island and Northern China. However, the analysis based on the S-DIVA and DEC models showed that the Megalobrama ancestors originally inhabited the Pearl River and Yangtze River, before spreading to the Amur and Wusuli Rivers.
C). Interestingly, the split of Ne curves of the two M. hoffmanni subgroups occurred about 0.4 Mya, indicating a population divergence at this time. The ancestral reconstruction analysis revealed two different biogeographic evolutionary processes to investigate the ancestral distribution of genus Megalobrama. According to the BBM analysis, the genus Megalobrama was originally distributed in the Pearl River and then spread to Hainan Island and Northern China. However, the analysis based on the S-DIVA and DEC models showed that the Megalobrama ancestors originally inhabited the Pearl River and Yangtze River, before spreading to the Amur and Wusuli Rivers (Figure S3).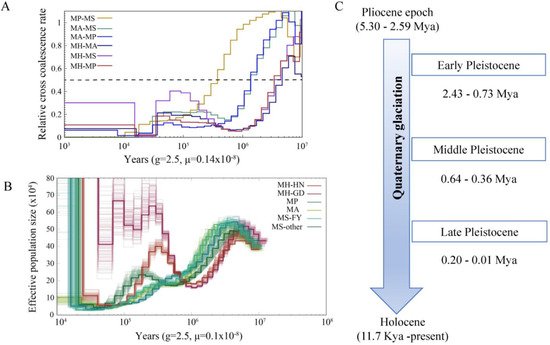
Figure 4. Demographic history of Megalobrama species. (
Demographic history of Megalobrama species. (A) Relative cross coalescence rates (CCR) between Megalobrama populations. When the two populations are completely mixed, the CCR is close to one. When they are completely split, the CCR is close to zero. The dotted line indicates that the CCR is 0.5. MP, MS, MA, and MH refer to M. pellegrini, M. skolkovii, M. amblycephala, and M. hoffmanni. g (generation time) = 2.5 years; μ (neutral mutation rate per generation) = 0.14 × 10
) Relative cross coalescence rates (CCR) between Megalobrama populations. When the two populations are completely mixed, the CCR is close to one. When they are completely split, the CCR is close to zero. The dotted line indicates that the CCR is 0.5. MP, MS, MA, and MH refer to M. pellegrini, M. skolkovii, M. amblycephala, and M. hoffmanni. g (generation time) = 2.5 years; μ (neutral mutation rate per generation) = 0.14 × 10⁻⁸
. (B
) PSMC model estimates changes in the effective population size over time, representing variation in inferred Ne dynamics. The undulating broken line in the figure is the estimated effective population size of each population in the evolutionary history. The time axis is not divided into deciles. μ = 0.1 × 10⁻⁸. MH-HN, MH-GD, MP, MA, MS-FY, and MS-other refer to the Hainan population of M. hoffmanni, Pearl River populations of M. hoffmanni, M. pellegrini, M. amblycephala population, Fuyuan population of M. skolkovii, and other M. skolkovii populations. (
. MH-HN, MH-GD, MP, MA, MS-FY, and MS-other refer to the Hainan population of M. hoffmanni, Pearl River populations of M. hoffmanni, M. pellegrini, M. amblycephala population, Fuyuan population of M. skolkovii, and other M. skolkovii populations. (C) Timeline of Quaternary glaciation. Mya = million years ago.
) Timeline of Quaternary glaciation. Mya = million years ago.7. Selective Sweeps for Dietary Adaptation of Megalobrama
To investigate the potential selective signals during M. amblycephala dietary adaptation, researchers scanned the genomic regions based on genome-wide calculations for selective sweeps by estimating Fst, PiR, and XP-EHH values. Candidate genes were discovered in the common region of top 5% Fst, High/Low top 5% PiR, and High/Low top 5% XP-EHH, inferred from the comparisons between M. amblycephala and the other three species (
To investigate the potential selective signals during M. amblycephala dietary adaptation, we scanned the genomic regions based on genome-wide calculations for selective sweeps by estimating Fst, PiR, and XP-EHH values. Candidate genes were discovered in the common region of top 5% Fst, High/Low top 5% PiR, and High/Low top 5% XP-EHH, inferred from the comparisons between M. amblycephala and the other three species (Figures 5A). Fatty acid degradation, glycerolipid metabolism, beta-alanine metabolism, arginine and proline metabolism, histidine metabolism, insulin secretion, and lysine degradation, among other metabolic processes were associated with a significant portion of the candidate genes, according to GO and KEGG analyses. M. amblycephala mainly feeds on high-fiber and low-energy aquatic vascular plants. The candidate genes of M. amblycephala were enriched in fatty acid degradation and corresponding upstream and downstream pathways. For instance, Aldh3a2 and Acss3 genes in fatty acid α-oxidation, Hadhb gene in fatty acid β-oxidation, Akt2 gene in insulin signaling pathway, Aldh3a2 gene in glycolysis/gluconeogenesis, Gbe1 gene in starch and sucrose metabolism, Acsbg2 gene in fatty acid biosynthesis, and Aldh3a2 gene in valine, leucine, and isoleucine degradation (
A, Figures S4 and S5A). Fatty acid degradation, glycerolipid metabolism, beta-alanine metabolism, arginine and proline metabolism, histidine metabolism, insulin secretion, and lysine degradation, among other metabolic processes were associated with a significant portion of the candidate genes, according to GO and KEGG analyses (Figure S6). M. amblycephala mainly feeds on high-fiber and low-energy aquatic vascular plants. The candidate genes of M. amblycephala were enriched in fatty acid degradation and corresponding upstream and downstream pathways. For instance, Aldh3a2 and Acss3 genes in fatty acid α-oxidation, Hadhb gene in fatty acid β-oxidation, Akt2 gene in insulin signaling pathway, Aldh3a2 gene in glycolysis/gluconeogenesis, Gbe1 gene in starch and sucrose metabolism, Acsbg2 gene in fatty acid biosynthesis, and Aldh3a2 gene in valine, leucine, and isoleucine degradation (Figure 6A). Moreover, these genes exhibited a high expression pattern in the liver and/or spleen tissue of M. amblycephala compared with M. hoffmanni (
A and Table S7). Moreover, these genes exhibited a high expression pattern in the liver and/or spleen tissue of M. amblycephala compared with M. hoffmanni (Figure 6B-E,b-e).
B–E,b–e).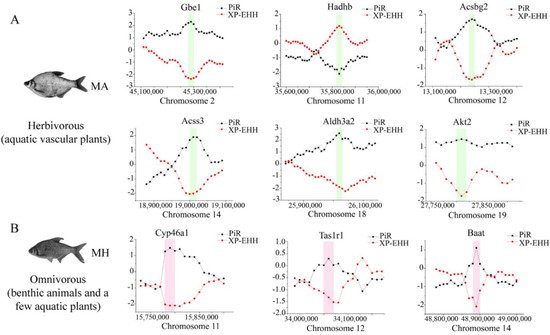
Figure 5. Genome-wide inference of selection sweeps on chromosomes during the diet adaptation of M. amblycephala (
Genome-wide inference of selection sweeps on chromosomes during the diet adaptation of M. amblycephala (A) and M. hoffmanni (
) and M. hoffmanni (B). MA and MH refer to M. amblycephala and M. hoffmanni. Gbe1, Akt2, and Aldh3a2 were identified from the comparison between M. amblycephala and M. skolkovii, Acss3, and Acsbg2 from the comparison between M. amblycephala and M. pellegrini, Hadhb from the comparison between M. amblycephala and M. hoffmanni, and Cyp46a1, Tas1r1, and Baat from the comparison between M. hoffmanni and M. amblycephala. The black curve indicates the nucleotide polymorphism ratio (PiR) analysis, and red curve indicates extended haplotype homozygosity between populations (XP-EHH) analysis. The green and pink boxes represent the position of the selected genes on the chromosomes.
). MA and MH refer to M. amblycephala and M. hoffmanni. Gbe1, Akt2, and Aldh3a2 were identified from the comparison between M. amblycephala and M. skolkovii, Acss3, and Acsbg2 from the comparison between M. amblycephala and M. pellegrini, Hadhb from the comparison between M. amblycephala and M. hoffmanni, and Cyp46a1, Tas1r1, and Baat from the comparison between M. hoffmanni and M. amblycephala. The black curve indicates the nucleotide polymorphism ratio (PiR) analysis, and red curve indicates extended haplotype homozygosity between populations (XP-EHH) analysis. The green and pink boxes represent the position of the selected genes on the chromosomes.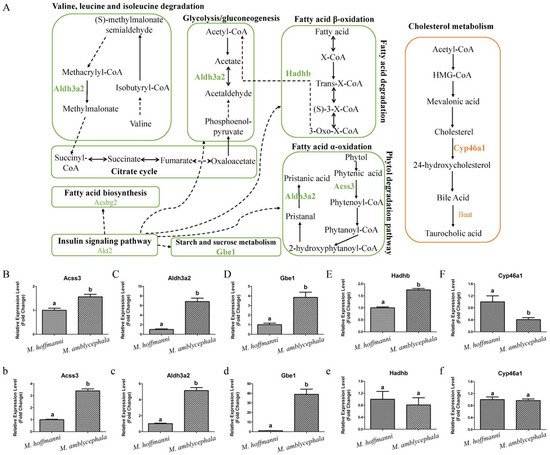
Figure 6. Metabolism pathways and expression pattern of candidate genes. (
Metabolism pathways and expression pattern of candidate genes. (A) Candidate genes of M. amblycephala and M. hoffmanni enriched in the metabolism pathways. The lines and selected genes in M. amblycephala and M. hoffmanni are indicated in green and pink, respectively. The dashed lines used to connect KEGG pathways represent indirect relationships. (
) Candidate genes of M. amblycephala and M. hoffmanni enriched in the metabolism pathways. The lines and selected genes in M. amblycephala and M. hoffmanni are indicated in green and pink, respectively. The dashed lines used to connect KEGG pathways represent indirect relationships. (B
–F) The expression pattern of candidate genes (Acss3, Aldh3a2, Gbe1, Hadhb, and Cyp46a1) in the liver tissue of M. amblycephala and M. hoffmanni. (
) The expression pattern of candidate genes (Acss3, Aldh3a2, Gbe1, Hadhb, and Cyp46a1) in the liver tissue of M. amblycephala and M. hoffmanni. (b
–f) The expression pattern of candidate genes (Acss3, Aldh3a2, Gbe1, Hadhb, and Cyp46a1) in the spleen tissue of M. amblycephala and M. hoffmanni. Different letters indicate a significant difference (p < 0.05).
) The expression pattern of candidate genes (Acss3, Aldh3a2, Gbe1, Hadhb, and Cyp46a1) in the spleen tissue of M. amblycephala and M. hoffmanni. Different letters indicate a significant difference (p < 0.05).Among the three omnivorous Megalobrama species, the food composition of M. hoffmanni is rich in zoobenthos. The common regions of top 5% Fst, High top 5% PiR, and Low top 5% XP-EHH were the selected regions inferred from a comparison of M. hoffmanni and M. amblycephala, which covered a total of 75 selected regions with a length of 4.14 Mb and including 126 genes in M. hoffmanni. These genes were found to be abundant in cellular and metabolic processes including taste transduction, fatty acid elongation, biosynthesis of unsaturated fatty acids, and biosynthesis of amino acids according to GO and KEGG enrichment analysis. Interestingly, researchers found some candidate genes (Cyp46a1 and Baat) involved in cholesterol metabolism (
Among the three omnivorous Megalobrama species, the food composition of M. hoffmanni is rich in zoobenthos. The common regions of top 5% Fst, High top 5% PiR, and Low top 5% XP-EHH were the selected regions inferred from a comparison of M. hoffmanni and M. amblycephala, which covered a total of 75 selected regions with a length of 4.14 Mb and including 126 genes in M. hoffmanni. These genes were found to be abundant in cellular and metabolic processes including taste transduction, fatty acid elongation, biosynthesis of unsaturated fatty acids, and biosynthesis of amino acids according to GO and KEGG enrichment analysis (Figure S7). Interestingly, we found some candidate genes (Cyp46a1 and Baat) involved in cholesterol metabolism (Figures 5B,
B, Figure 6A). The results indicated that compared with M. amblycephala, the Cyp46a1 gene was highly expressed in the liver of M. hoffmanni, but not in the spleen (
A, Figure S5B and Table S7). The results indicated that compared with M. amblycephala, the Cyp46a1 gene was highly expressed in the liver of M. hoffmanni, but not in the spleen (Figure 6F,f). Furthermore, functional annotation indicated that the umami taste receptor gene Tas1r1 was abundant in the M. hoffmanni sensory system.
F,f). Furthermore, functional annotation indicated that the umami taste receptor gene Tas1r1 was abundant in the M. hoffmanni sensory system.