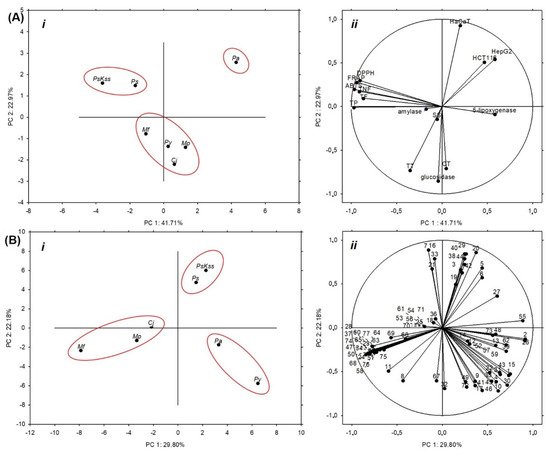
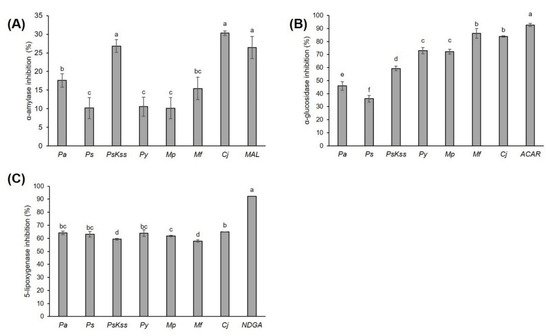
This work aims to assess the biopotential of the young inflorescence tissues of Prunus, Malus and Chaenomeles in order to evaluate the possibility of their application in the food industry, and to provide a polyphenolic fingerprint for their quality control. The contents of different bioactive compounds and their antioxidant capacities were spectrophotometrically measured, the main phenolic compounds were identified and quantified using LC-DAD-MS, the antidiabetic potential was determined using α-amylase and α-glucosidase inhibition assays, the anti-inflammatory potential was determined using a 5-lipoxygenase inhibition assay, and the cytotoxicity was determined by MTT assay. Using one-way ANOVA, principal component analysis, hierarchical clustering and Pearson’s correlation coefficient, the relations between the samples, and between the samples and the measured parameters, were revealed. In total, 77 compounds were identified. The concentration of sugars was low in M. purpurea, at 1.56 ± 0.08 mg/g DW. The most effective sample in the inhibition of antidiabetic enzymes and anti-inflammatory 5-lipoxygenase was C. japonica. The inhibition of α-glucosidase was strongly positively correlated with the total and condensed tannins, procyanidin dimers and procyanidin tetramer, and was very strongly correlated with chlorogenic acid. In α-amylase inhibition, C. japonica and P. serrulata ‘Kiku Shidare Zakura’ were equally efficient to the standard inhibitor, maltose. The most effective in the growth and proliferation inhibition of HepG2, HCT116 and HaCaT cells was P. avium. The results suggest Prunus, Malus and Chaenomeles inflorescences as functional food ingredients.
1. Introduction
Inflorescence, as a precursor of a fruit, is composed of several types of metabolically very active tissues. In recent years, the biopotential of the bioactive compounds of this plant structure has been recognized. Namely, the significant bioactivities of inflorescences of industrial hemp
[1],
Musa species
[2],
Sorbus aucuparia [3],
Cistus salviifolius [4],
Lonicera japonica [5], and
Caryota urens [6] have been revealed. Moreover, the flower buds of
C. salviifolius have been shown to have a higher concentration of phenolics, better antioxidant and anti-superoxide dismutase activity, and stronger cytotoxic activity against human breast cancer and ovarian cancer cells than leaves
[4]. Recently, the intrinsic antiradical activity of industrial hemp’s inflorescences’ water extracts and mechanisms related to their anti-inflammatory, antiproliferative and antimycotic activity have been revealed
[1]. The inflorescences of
Musa species are one of the most widely consumed vegetables in the Southeast Asian region, and their biological activities are well known.
The use of inflorescences of
Rosaceae varieties, except those of
Sorbus spp.
[3], is not that common.
Sorbus spp. inflorescences have a higher concentration of total phenolics than the commonly consumed fruits
[3]. Furthermore, the inflorescences of different S
orbus species have higher antioxidant activity than their leaves or fruits
[7]. Moreover, the extremely high content of phenolics in
S. aucuparia inflorescences suggests their great potential as a source for natural health products
[3][7][3,7]. Different organs of
Prunus,
Malus, and
Chaenomeles taxa have already been investigated for their phytochemical, nutraceutical and bioactivity potential
[8][9][10][11][12][13][8,9,10,11,12,13]. However, the inflorescences have been neglected so far.
Therefore, the aim of this work was to assess the biopotential of the young inflorescence tissues of selected Prunus, Malus, and Chaenomeles using a combination of spectrometric, chromatographic, cell culture and chemometric analyses, as well as to evaluate the possibility of their application in the food industry. For that purpose, we (a) spectrophotometrically measured the content of different types of bioactive compounds (total phenolics, flavonoids, non-flavonoids, total and condensed tannins, and soluble sugars), and their antioxidant capacity by the three methods (ABTS, FRAP and DPPH); (b) identified and quantified the main phenolic compounds using the LC-DAD-MS method; (c) determined the antidiabetic potential of the inflorescences using α-amylase and α-glucosidase inhibition assays; (d) measured the anti-inflammatory potential using a 5-lipoxygenase inhibition assay; (e) assessed the cytotoxicity toward HepG2, HCT 116 and HaCaT cells by MTT assay; and (f) statistically—using one-way ANOVA, principal component analysis, hierarchical clustering and Pearson’s correlation coefficient—revealed the relations between the samples, as well as between the samples and the measured parameters. This study is the first to present a comprehensive LC-DAD-MS polyphenolic profile of the inflorescences of Prunus avium (L.) L. (Pa), Prunus serrulata Lindl. (Ps), Prunus serrulata ‘Kiku Shidare Zakura’ (PsKss), Malus x purpurea (E.Barbier) Ehder (Mp), Malus floribunda Siebold ex Van Houtte (Mf) and Chaenomeles japonica (Thunb.) Lindl. ex Spach (Cj), providing a fingerprint for the future quality control of these biomaterials, and the first report on their bioactivity.
2. Spectrophotometric Analysis of the Phytochemical Content and Antioxidant Capacity of the Inflorescences
All of the the tested samples had a similar or higher amount of total phenolics than the commonly used flower buds of
Capparis spinosa [14]. The highest amount of total phenolics (53.12 ± 0.79 mg GAE/g DW), flavonoids (38.89 ± 4.04 mg CE/g DW) and nonflavonoids (31.32 ± 0.71 mg GAE/g DW) were recorded in
PsKss (
Table 1). Because only about 10% of the medicinal plant material has total phenolics in a concentration higher than 5% DW of GAE
[7][15][7,15],
PsKss inflorescence is among the plant materials with the highest concentration of these compounds. Compared to the concentration of the total flavonoids in many other commonly used medicinal plants
[15], the tested inflorescences had a similar or higher concentration, suggesting their potential for the food industry. Moreover, very recently, it was shown that inflorescences of
Pa have far more total phenolics and flavonoids than stems and kernels
[16].
Table 1. Concentration (in mg/g dry weight) of the total phenolics (TP), total flavonoids (TF), total nonflavonoids (TNF), total tannins (TT), condensed tannins (CT) and soluble sugars (SS), and the antioxidant capacity (ABTS, FRAP and DPPH) of Rosaceae inflorescences.
| |
Prunus avium |
Prunus serrulata |
Prunus serrulata | ‘Kiku Shidare Zakura’ |
Prunus yedoensis |
Malus purpurea |
Malus floribunda |
Chaenomeles japonica |
| TP (mg GAE/g DW) |
Table 3. Pearson’s correlation coefficient (r) between the groups of metabolites, antioxidant capacity, cytotoxicity, and hypoglycemic and anti-inflammatory potential of Rosaceae inflorescences.
| |
TP |
TF |
TNF |
TT |
CT |
SS |
ABTS |
FRAP |
DPPH |
HepG2 |
HCT116 |
HaCaT |
α-Amyl |
α-Glucos |
5-Lipoxy |
| 27.83 ± 0.69 f |
46.84 ± 0.75 b |
53.12 ± 0.79 a |
37.31 ± 0.48 e |
40.29 ± 0.64 c |
46.74 ± 0.93 b |
39.42 ± 0.97 d |
| TF (mg CE/g DW) |
| TP |
1.000 |
|
|
|
|
|
|
|
|
|
|
|
|
|
|
| 13.57 ± 0.84 f |
32.35 ± 2.13 b |
38.89 ± 4.04 a |
25.78 ± 1.03 d |
13.43 ± 0.82 f |
23.83 ± 0.88 e |
29.45 ± 0.65 c |
| TF |
0.761 |
1.000 |
|
|
|
|
|
|
|
|
|
|
|
|
|
TNF (mg GAE/g DW) |
16.40 ± 0.91 g |
29.35 ± 0.83 b |
31.32 ± 0.71 a |
| TNF |
0.938 |
0.629 | 22.21 ± 0.86 e |
23.52 ± 0.56 d |
28.85 ± 0.58 c |
18.73 ± 0.48 f |
| 1.000 |
|
|
|
|
|
|
|
|
|
|
|
|
TT (mg CE/g DW) |
27.26 ± 0.22 g |
59.44 ± 1.32 f |
71.59 ± 0.33 d |
83.55 ± 0.55 b |
64.32 ± 0.45 e |
107.85 ± 1.09 a |
80.27 ± 0.33 c |
| TT |
0.471 |
0.014 |
0.333 |
1.000 |
|
|
|
|
CT (mg CE/g DW) |
4.25 ± 0.33 e |
7.74 ± 1.02 d |
6.99 ± 0.17 d |
16.52 ± 0.01 b |
15.45 ± 0.10 b |
10.98 ± 0.24 c |
51.68 ± 0.38 a |
| SS (mg SE/g DW) |
3.37 ± 0.06 c |
3.04 ± 0.05 d |
2.41 ± 0.10 e |
8.61 ± 0.12 a |
1.56 ± 0.08 f |
3.58 ± 0.06 b |
3.27 ± 0.07 c |
| ABTS (mg TE/g DW) |
22.86 ± 4.61 e |
49.41 ± 7.23 b |
61.32 ± 5.84 a |
36.63 ± 4.32 c |
28.78 ± 2.52 d |
47.78 ± 6.26 b |
35.05 ± 4.25 c |
| FRAP (mg TE/g DW) |
27.89 ± 0.60 g |
51.68 ± 0.12 b |
58.06 ± 0.78 a |
40.28 ± 1.18 d |
29.12 ± 0.83 f |
44.36 ± 0.85 c |
36.36 ± 1.50 e |
| DPPH (mg TE/g DW) |
25.47 ± 2.57 d |
52.95 ± 4.22 b |
69.42 ± 3.27 a |
39.21 ± 4.86 c |
25.10 ± 3.25 d |
40.38 ± 3.4 c |
39.61 ± 3.95 c |


