Your browser does not fully support modern features. Please upgrade for a smoother experience.
Please note this is a comparison between Version 2 by Vivi Li and Version 1 by George A. Papakostas.
Rheumatoid arthritis (RA) is a systemic autoimmune disease that preferably affects small joints. As the well-timed diagnosis of the disease is essential for the treatment of the patient, several works have been conducted in the field of deep learning to develop fast and accurate automatic methods for RA diagnosis.
- deep learning
- rheumatoid arthritis (RA)
- trustworthiness
- explainable AI
- artificial intelligence
- medical imaging
- computer-aided diagnosis
1. Introduction
1.1. Definition and Epidemiology of RA
Rheumatoid arthritis (RA) is a systemic autoimmune disease that preferably affects small joints. RA can also cause many extra-articular manifestations such as pericarditis, pulmonary fibrosis, and peripheral neuropathy, etc. Most often, the diagnosis is made when patients with pain and swelling in the peripheral joints, as well as joint stiffness in the morning, seek medical help. Pain due to RA is typically worse in the morning and the evening and improves during the day. Awakening in the night because of pain in the joints has also been described as a common symptom of RA, as in most inflammatory rheumatic diseases. RA is a “multicausal” disease that most likely results from a combination of genetic predisposition and various environmental and lifestyle factors. Articular and systemic manifestations can lead to poor long-term outcomes such as disability and death [1].
The worldwide prevalence of RA has been estimated as 0.24% based upon the Global Burden of Disease 2010 Study and was approximately two times higher in women [2]. Certain population groups are much more affected than others. This is why the prevalence of RA can reach up to 1% of the general population in some countries. The lifetime risk of developing RA is 3.6% in women and 1.7% in men [3]. The prevalence of RA has remained stable from 1990 to 2010. The annual incidence of RA in the United States and northern European countries is estimated to be approximately 40 per 100,000 persons [4,5][4][5]. Globally, of the 291 conditions studied, RA was ranked as the 42nd highest contributor to global disability. Disability was measured in years lived with disability (YLDs) and represented 0.49% of total YLDs. YLDs for RA increased over the years (from 48/100,000 in 1990 to 55/100,000 in 2010). This was due to the population increase worldwide over these years and due to the aging of the population. YLDs were higher in females in comparison to males [2]. The prevalence of RA is more intense in the regions of central and north Europe, while it is more suppressed in countries near the equator. There are also countries with no prevalence data (e.g., Australia).
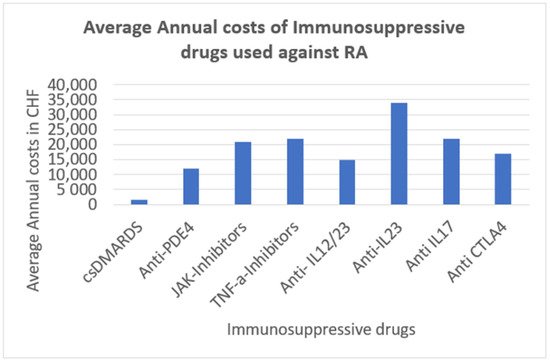
Disability-adjusted life years (DALYs) because of RA increased by 44% for all ages over the years 1990–2010. In 2010, RA was ranked 74th in global DALYs, accounting for 0.19% of total DALYs [2]. The age-standardized death rate from RA in 2010 was approximately 0.8 per 100,000, but there is considerable uncertainty regarding this matter [2]. RA’s financial burden on society is substantial. The financial burden of RA is a summative effect of RA treatment itself (doctor visits, medication including DMARDs = disease modifying antirheumatic drugs, biologicals, physiotherapy, ergotherapy, psychotherapy if needed, etc.) and the costs of sickness absence. According to a study published in 2009, societal costs of RA in the US are USD 19.3 billion and USD 39.2 billion (in 2005 dollars) without and with intangible costs, respectively [6]. Since 2009, there have been many more biologicals on the market as a therapeutic option for RA, which are more selective and therefore more expensive. The annual treatment costs of specific immunosuppressive drugs used against RA (most of them are also used against other inflammatory rheumatic diseases such as axial spondyloarthritis or psoriatic arthritis) are presented in Figure 1 [7].
Hence, the medical treatment of the patients is costly, and the degradation of the joints is non-irreversible. Taking into account the growing pain of the patient as well as the deterioration of the quality of life of those people suffering from RA, the prospect of a well-timed diagnosis of RA disease is considered to be quite important.
2. RA Diagnosis Methods: Modernism vs. Traditionalism
2.1. Deep Learning Methods
In this review, we proceed with reference to the state-of-the-art methods that utilize algorithms from the field of deep learning in order to counter the RA disease. To the best of our knowledge, the 14 works that are reviewed in our work constitute the main efforts of the researchers in order to combine the deep learning method and medical data for diagnosing RA disease.
The authors in [11][8] present a multi-task deep learning model that can learn to detect joints on X-ray images and concurrently diagnose two kinds of joint damage, narrowing damage and erosion damage. Moreover, they propose an alternation for label smoothing. Their way combines cues from classification and regression into a single loss. This way achieves a reduction of 5% regarding the relative error compared to other standard functions. In order to approach the standard metric SvH [13][9] for hand and foot images, they execute segmentation and classification tasks at the same time. For the training procedure, they utilize four images per patient, with all the scores for narrowing and erosion damage, annotated for each image. In order to make the procedure more robust, they use access to annotations of the center of all joints for better training signals.
In [10], there is a proposal for a method based on deep learning that realizes at the same time recognition and classification of the RA using X-ray images. As it is difficult for a not experienced RA doctor to evaluate the state of the condition, as this diagnosis relies on implicit knowledge, the authors believe that there is a need for the implementation of a system that can evaluate the RA condition automatically. Furthermore, they developed their system in a way so it can be improved by evaluations and modification of the doctor who performs the diagnosis. Their system consists of four specific procedures. At first, there is the generation of the training data by the user. The user in this state detects the position of the joints and measures the size of the image and reads the SvH [13][9] score that is written on the X-ray image. Therefore, there is a five-dimensional (position x, y, width, height, score) data record that trains their model. At the next step, when there is an input of a new image, the trained model predicts the position of the joints and the damage score (DS) as well. This info is drawn on the image. Next, the medical doctor has the task of checking the result. At this stage, the outcome can be modified (score, position). Finally, this checked data can be fed into the training procedure of the model in order to make the system more robust.
A deep learning model for calculating the radiographic finger joint SvH score in RA using X-ray images was developed in [21][11]. The model executes two tasks in two steps: the joint detection step and the joint evaluation step. Regarding the first step, a classifier was trained to detect the finger joints using Haar-like features. For the second step, meaning the joint space narrowing (JSN) score and the erosion score assignment for each detected joint, a CNN model was used. This model consisted of seven layers (two convolution layers, two pooling layers and three fully connected layers). Data augmentation (horizontal flipping, rotation) took place during both steps to increase the training data sets. In training sets, the images were manually clipped and scored for JSN and bone erosion by clinicians. The performance of the model was examined using a test dataset by comparing the score assigned by the clinicians and the score assigned by the model.
In [15][12], they used grayscale ultrasound images as an input for the DesnseNet-121 model in order to automatically classify the conditions of RA. To standardize the use of the ultrasound, the OMERACT-EULER Synovitis scoring (OESS) [17][13] was used. The dataset of the ultrasound images was created from hospital data after the approval of the corresponding patients. According to the OESS guidelines, the joints that were scanned were the radiocarpal-intercarpal joint and radioulnar joint of the wrist, the proximal interphalangeal and the metacarpophalangeal joints. The images were then annotated by physicians with experience in ultrasound imaging. The physicians also marked the area of synovial proliferation. As the medical dataset was limited, data augmentation was used in order to create a relatively unbiased training set. The authors focus on two scenarios. The first scenario is associated with the presence of synovial proliferation and the second one is with the medical status of the patient (healthy or diseased). There were three groups of experiments performed with different inputs for the model. The variation was the different sizes of the ROI (region of interest) and the presence or not of a pre-segment mask. Furthermore, the authors insist that transfer learning could be used due to the limited quantity of medical data. It should be noticed that, for better visualization and consequently better explainability of the model outcome, heatmaps were used by means of class activation mapping.
In the work described in [12][14], the authors present a deep learning model for automatic assignment of joint scores and overall scores for RA patients using X-ray images. They used the SvH [13][9] RA image scoring. Similar to other researchers, they insist that the manual approach of assigning the SvH score is expensive by means of human time and effort and is sometimes inaccurate and subjective. According to their method, there are two objectives. The first one is associated with the prediction of the narrowing and erosion scores for each joint, trying to maintain high accuracy. The second objective of their method is associated with the prediction of an overall RA score for each patient. As they used a dataset with X-ray images from hands and feet for each patient with varying dimensions, they resized the images to a standard dimension set. A data augmentation method was also used because of the small number of patients. After the augmentation, they combined the four images per patient (left/right hand/foot) so that a new larger image is created for each patient. These images were fed into a deep learning model with 13 layers of depth, achieving high accuracy.
The authors of [22][15] try to classify RA by using deep learning models to analyze texture changes in different stages of the disease. They use the Deep Texture Encoding Network (Deep-TEN) and residual network-50 (ResNet-50) in order to predict the probability of RA. They use radiographs in order to assess the bone structural and textural changes, which indicate the progress of RA. The method of fractal analysis was used in order to determine bone texture characteristics from the radiograph images. To focus on a specific region of the images, they trained a curve-graph convolutional network (GCN). By using this model, they achieved a fully automated segmentation method of the second, third and fourth metacarpal bone regions. The segmented images were augmented. The authors based their research on the Deep-TEN model, as they insist that such a model can learn the essential features that are necessary to fit and identify the region of interest in an image regarding a specific problem. The Deep-TEN model that was used is a model specialized for texture analysis and includes a novel encoding layer, which is a point of difference in comparison to other CNN models such as ResNet. In that way, it achieves good performance in texture recognition tasks.
Other authors in [14][16] engaged with the usage of CNN models for OESS [16][17] (Doppler mode in US—DUS) system assessment on ultra-sound images for diagnosis and monitoring of patients with RA. They used two state-of-the-art CNN models (VGG16, Inception V3) for two tasks. The first model was used for binary image classification as healthy or diseased (0–1), and the second model was used for OESS score assessment (0–3). The results of the two models were compared with the results of a rheumatologist physician. They created four DUS image sets for each OESS score category. The VGG-16 model was used in order to classify the images of RA joint disease activity as healthy (DUS scores 0 and 1) or diseased (DUS scores 2 and 3). The Inception-V3 model, a more sophisticated model, has a modular architecture as it consists of several modules, the so-called inception modules. Each one of these modules extracts information from the input image following different depths, i.e., different resolutions. The information is then combined in a mixed layer. The first mixed layers contain more generic information in comparison with the latest mixed layers. Then they used the information from the mixed layer with the higher classification accuracy in order to ensemble a classification method where 10 classifiers were trained but with slightly different training parameter settings. The results show that CNN models can be used for DUS image OESS score assessment, as they achieve high accuracy.
Regarding the work of [23][18], the authors try to use plain hand radiographs in order to create a method that automatically diagnoses rheumatoid arthritis and monitors its activity. They created an image dataset from radiographs coming from clinic files. From raw images, they kept only the right hands, maintaining the same aspect ratio from original images. They also used data augmentation to avoid overfitting and to achieve better overall performance. During the online data augmentation, random vertical and horizontal translation for several pixels and rotation of the image was used. The CNN model that was used by the authors had six groups of convolution layers. Each group consisted of one convolution layer, a batch normalization layer and a ReLU layer. The first five groups also include a max-pool layer. In the end, there is a fully connected layer and a softmax layer.
According to another method described in [24][19], the authors propose a novel method for automatic detection of bone erosion on hand radiographs. First, their method performs a segmentation of the image in order to extract the region of interest (ROI) that contains the detailed phalanges regions. This selection is performed using the MSGVF Snakes method. Then, as the regions are selected, the method continues by using a deep neural network classifier in order to identify if there is bone erosion in these regions or not. Regarding the creation of the ROI, the proposed method removes at first the soft tissue of the radiograph image using greyscale morphological operations. After that, during the initial segmentation, the phalangeal region is extracted by estimating the joint position of each phalange from the bone region. The bone regions are located using contour tracing. At this stage, the selected regions contain noise. For this reason, the final detailed phalangeal region is created using the MSGVF Snakes method. After this final segmentation, the method can continue with the use of a DCNN so that the model can learn to distinguish if there is bone erosion in the specific region or not. It is noted that from the final 40 × 40-pixel segmented image, only the phalange region is loaded into the DCNN. As it is generally difficult to collect medical images for model training, the transfer learning method has been used on several occasions, so it was used by the authors. They used a pre-trained model that was trained using 1000 categories of general images.
The model proposed in [25][20], the FingerNet model, is an approach for finger detection from hand radiograph images using CNN in order to assist physicians in diagnosing diseases such as rheumatoid arthritis. Hand radiography is the simplest way for disease diagnosis and demands minimal exposure to radiation. Their method needs a little user intervention, and it consists of three different stages: the pre-processing (PP) stage, the finger extraction (FE) stage and the joint detection (JD) stage. During the first stage, the model creates the mask of the hand by executing segmentation in the original radiographic image. In the second stage, the model extracts five separate fingers from the previously created hand mask image. At the final stage, the model detects three points for each finger by the use of CNN architecture and a signal processing-based joint break detection. The CNN method that is used is based on the LeNet-5 model, while the joint break method is a method during which the finger image is scanned from the end of the tip to its base in order to find peak locations where the intensity of the finger image changes dramatically. This advanced method outperformed the AdaBoost model.
Another two-staged model, which is proposed in [26][21], combines the use of the object detection method and convolution neural networks, which can predict the joint level narrowing and erosion SvH scores [13][9], as well as the overall RA damage, from patients’ radiographs. At the first stage, the model performs object detection using the RetinaNet object recognition models. These models were trained in order to detect finger and wrist joints from radiograph images. During the second stage, the model with the use of CNNs with attention predicts the join-wise narrowing and erosion SvH scores and the overall RA damage applying the joints that were extracted from the previous stage. The attention mechanism that is used helps the model to focus on the salient regions of the radiograph images so that the damage predictions are more accurate. Furthermore, the visualization that is added on top of the radiograph images helps with the explainability of the model predictions.
In [27][22], they use a deep learning model to predict the RA state of the patient at his next clinic visit. As the records of the patients are digitally stored and accessed by EHR (electronic health record) platforms such as university hospitals (UN) and public safety-net hospitals (SNH), it is relatively easy to create datasets with the corresponding data. These data can be used in order to train the deep learning model so that it can forecast the clinical disease activity index (CDAI) score of the patient at his/her next visit. The author selected the ESR and CRP level, the prior CDAI score, DMARDS, oral and injected glucocorticoids, autoantibodies, and finally, the demographic data of the patients as variables for predicting the disease state. Their research showed that only the previous CDAI score was not enough for predicting the next score, and a combination of variables such as laboratory values, medication and the history of disease activity should be used in order to obtain a correct prediction for the next visit. The outcome of their work shows that deep learning models can be used on EHR data for the accurate prediction of the RA disease condition.
Rohrbach et al. [28][23] followed the Ratingen [13][9] score system for annotating the X-ray images that fed their model. They used only the left hand radiograph to extract only the joint regions. Thus, ten new images showing the ten joint regions were created from one X-ray image. These images were next rated by expert raters, and then they were used to train the model. The authors used a VGG16-based deep learning model and applied transfer learning. They used the pre-trained VGG16 model as the core, and they replaced some of the fully connected layers. After the replacement, they had to fine-tune the entire model, so that it could adapt to the new domain. However, they conclude that a whole new training of the model from scratch could be the best solution as the datasets are sufficient. Because of the six categories of the Ratingen score system and the non-equal distribution of the data in the datasets, besides the global accuracy of the model, the metrics of balance accuracy and the ±1 balanced accuracy were introduced. The authors also experimented with a weighted cross-entropy because of the pronounced imbalances in the Ratingen scores in their data, which shows better results. The authors conclude that such a system can predict the Ratingen score as well as a trained expert, but it takes only some milliseconds for the outcome compared to the minutes that an expert has to spend.
An algorithm for automatic segmentation of ultrasound images is proposed in [16][17]. The segmentation is necessary in order to provide prominence to the different anatomical regions such as bones, skin and joints that are shown in the ultrasound image. These regions are significant for efficient discrimination and alternation of the disease condition. The first step was associated with the pre-processing of the original image so that the noise is eliminated. At the second step, the separation of the skin region is conducted as boundary regions and edges are determined using the Canny edge detection technique. In order for the model to be able to detect the bone region of the image, at the next step, the authors are focused on the intensity variation in the image, as the signal strength of the bone region is represented by high-intensity pixel. Next, the joint region detection is performed by measuring the distance between the two bone regions. The metric that was used was the Euclidean distance. At the fifth step, the model continues with the synovial region detection. This region can be defined by the synovial fluid extension. Hence, the segmentation of this region was performed using an active contour technique. Finally, these segmented regions are fed into the CNN model for classification into four categories. The proposed model achieved high accuracy greater than 95%.
In Figure 2 and Figure 3, we present a general block diagram for the training and the testing process of the reviewed models, respectively. In Figure 4, we present the block diagram that describes the work of [10], in which the part of the physician is essential.
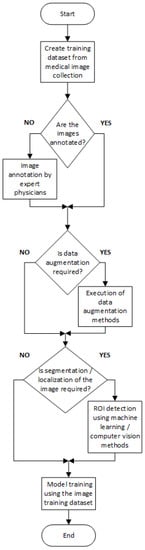
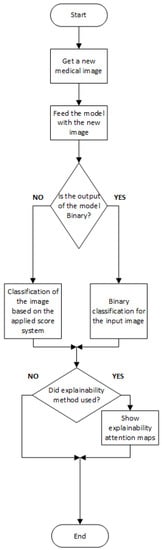
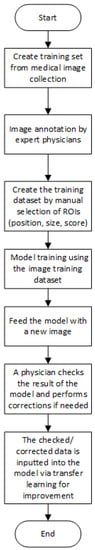
Figure 2. General block diagram for training CNN models.
Figure 3. General block diagram for testing the CNN models.
2.2. Datasets That Were Used
As mentioned above, the main modalities of medical images that were used were firstly the radiograph images (Figure 5 and Figure 6) and secondly the ultrasound images (Figure 7 and Figure 8). The authors used datasets that were either created from hospitals and medical centers or were benchmarked datasets such as the RA2 DREAM Challenge Dataset [29][24] and Medusa Database [30][25]. Regarding the custom datasets, the dimensions of the original medical images were varied. Furthermore, in some datasets, there were feet images included besides the hand images. According to the model, the original images were resized in order to fit the requirements. In works where there was ROIs detection (e.g., fingers, joints), there was a denoising process performed in order for the model to make the data as “clean” as possible. On the other hand, in works where there were no special ROIs detected, the data were loaded into the model in a raw form but sometimes modified (cropped image with only one hand [23][18], combination of four images into one showing both hands and feet [12][14]). It is important to notice that, as the patient data are protected under the scope of GDPR, all patients whose data were used to create datasets at first agreed with the authorities of each institution for the usage of their data. However, even in that way, there were works with datasets that were too small; therefore, a data augmentation method was considered necessary so that efficient data could be created for the demanding training of the models. Moreover, the transfer learning method can solve the problem of limited datasets. Finally, it must be noticed that even with small datasets (e.g., <300 images), some authors achieved good results [16][17].
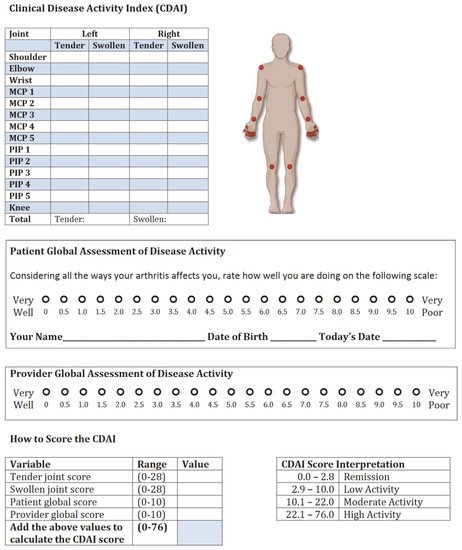
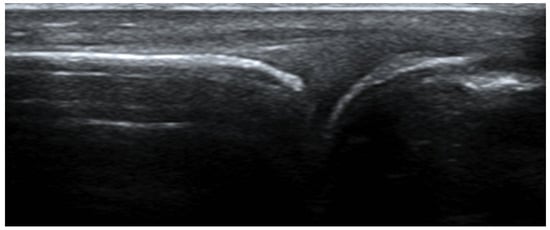

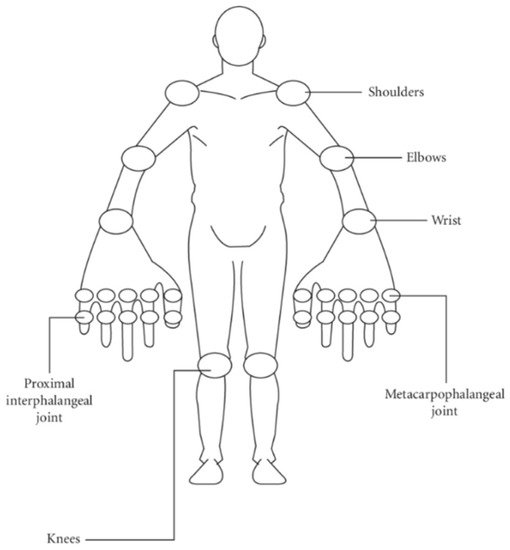
Figure 8. Typical CDAI activity index template.
2.3. The Physician Method
The diagnosis of RA is often complex, as it is based on the evaluation of many different parameters. These include patient history, physical examination, laboratory findings, X-ray-, ultrasound-findings and sometimes MRI findings.
2.3.1. Patient History
RA, as mentioned before, is a systemic disease, meaning that it can affect many organs and not only the joints. As far as joint involvement is concerned, typical for RA is symmetrical pain in the small joints, with swelling and morning stiffness, as well as improvement of symptoms during the day. Awaking in the night because of pain is also quite common. Inflammatory disorders cause pain that is usually noticed at rest and improves with movement. On the contrary, pain because of osteoarthritis or other degenerative disorders worsens with movement and is better at rest. When taking a medical history of a patient with RA, questions about possible extra-articular manifestations are of great importance. These questions include: trouble breathing (in case of interstitial lung involvement, pleural effusion, parenchymal pulmonary nodules), chest pain (in case of pericarditis, myocarditis, endocarditis, etc.), disturbance of vision as a result of eye inflammation (in case of scleritis/episcleritis/retinal vasculitis), palpable nodes under skin (rheumatoid nodules), other skin alterations (in the case of coexisting rheumatoid vasculitis = inflammation of the blood vessels because of RA), sicca symptoms meaning dryness of the eyes or mouth, often in combination with swelling of salivary glands (in case of coexisting Sjögren syndrome), gastrointestinal symptoms such as abdominal pain, blood in the feces (in case of mesenteric vasculitis or intestinal infarction), pain when urination or change in the color of urine or any other kind of disturbance of renal function (in case of mesangial glomerulonephritis, amyloidosis, interstitial renal disease), weakness in the extremities, numbness or tingling, clumsiness and poor coordination of the hands (in case of peripheral neuropathy, mononeuritis multiplex, etc.), pain in the neck (in case of atlantoaxial instability) and tiredness/fatigue (in case of anemia on chronic disease because RA) [31][27]. In some cases, lymph node enlargement is also possible, mimicking Hodgkin’s disease [32][28].
2.3.2. Physical Examination
A well-known tool when coming to the regular evaluation of the course of RA patients in clinical praxis is the Disease Activity Score (DAS28). DAS28 has also been widely used in clinical trials when RA patients have been recruited in order to compare RA activity throughout the study. The DAS28 is a measure of RA disease activity that combines information from tender joints, swollen joints and inflammatory markers (CRP or erythrocyte sedimentation rate—ESR) [33][29]. The physician needs to press the below-marked 28 joints and mark the number of joints that are painful. CRP is the so-called C-reactive protein and ESR of the erythrocytes’ sedimentation rate. Both of them are measured in the blood and are high in the case of inflammation or infection. DAS28 can be calculated for both of them. Thus, there is the DAS28CRP and the DAS28ESR, respectively. Number 28 represents the 28 joints, which are typically being assessed in the clinical praxis by rheumatologists. These joints are presented on the mannequin below (Figure 7):
DAS28CRP or DAS28ESR can be easily calculated online [35][30].
In Table 1, RA activity in correlation with DAS28 score is presented.
Another widely used score for the clinical course of RA patients is CDAI (clinical disease activity index) (Figure 8). CDAI is calculated similarly. The main difference to DAS28 is inflammatory markers are not included; therefore, this score is more subjective. In CDAI, physicians are also called to quantify the disease activity on a scale from 0 to 10. CDAI is also based on tenderness and swelling of the same 28 peripheral joints.
Because of the possible extra-articular manifestations, it is always important that the physician examines the RA patient’s whole body and not just the joints. The skin, the eyes, heart and lungs, palpation for possible lymph nodes and abdomen also need to be thoroughly examined.
2.3.3. Laboratory Findings
In addition to inflammatory markers such as CRP and ESR, all possible RA patients must be screened for the presence of rheumatoid factor (RF) and anticitrullinated protein antibodies (ACPAs). When RF or ACPAs are positive, we can speak of seropositive RA. According to the literature, 70–80% of patients with RA are positive for autoantibodies, such as rheumatoid factors (RFs) and anti-citrullinated protein antibodies (ACPAs) [38][33]. Commonly, there are patients with rheumatoid arthritis with negative antibodies (RF, ACPA). In that case, the diagnosis of seronegative rheumatoid arthritis can be made.
2.3.4. X-ray Findings
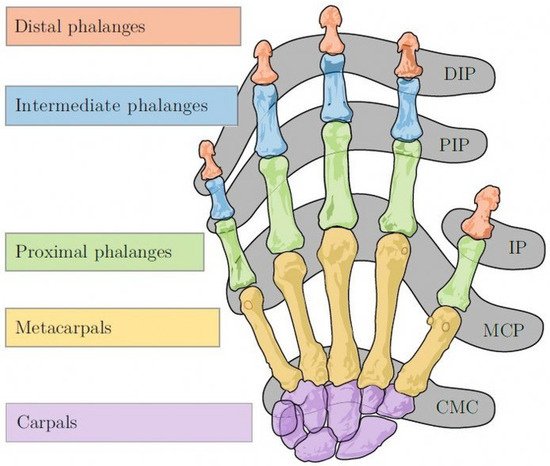
RA has a predilection for MCP and PIP (proximal interphalangeal) joints, ulnar styloid and triquetrum (Figure 9). DIPs (distal interphalangeal joints) are spared.
Typical X-ray findings in RA patients include marginal erosions, symmetrical joint space narrowing, subchondral cyst formation, subluxation causing ulnar deviation of MCP joints or boutonniere and swan neck deformities. Other typical X-ray findings in RA patients are hitchhiker’s thumb deformity, scapholunate dissociation, ulnar translocation, ankylosis (complete loss of the joints space) and scallop sign: erosion of the ulnar aspect of the distal radius, which may be predictive of extensor tendon rupture (Vaughan-Jackson syndrome).
Bone erosions, especially at the bare areas of joints (joint areas that are not covered with cartilage), are common for RA and are easily detectable with conventional X-rays [40][35].
There are many scoring systems that are used when evaluating an X-ray of a patient with RA. The most widely used nowadays is the modified Sharp/Van der Heijde [13][9] scoring system.
The original Sharp method assessed 27 joints in each hand and wrist, with each joint being given a separate score for joint space narrowing and erosions. The Sharp score focused on the hands and wrists (evaluation of 17 areas for erosions and 18 areas for joint space narrowing) and Van der Heijde added the feet in these evaluations, a modification that was also used by Sharp. Because of their similarities, these radiographic scoring systems are known as “modified Sharp methods.” In modified Sharp scoring systems, each joint is given a score for joint space narrowing and another score for erosions. Fifteen sites in each hand and wrist and six joints in each foot are examined for joint space narrowing on a scale of 0 to 437. Joint space narrowing for each joint can range from 0 to 4:0 indicates no narrowing, 1 represents minimal narrowing, 2 indicates loss of 50% of the joint space, 3 indicates loss of 75% of the joint space, and 4 represents a complete loss of the joint space. The erosions are counted individually, usually at 16 sites in each hand and wrist and six sites in each foot. The erosion score per joint of the hands can range from 0 to 5. Erosions are scored 1 if they are discrete but clearly present and 2 or 3 if they are larger, depending on the surface area of the joint involved. A score of 4 is given if the erosion is large and extends over the imaginary middle of the bone. A score of 5 is given if a complete collapse of the joint is present or if the full surface of the joint is affected. In each joint, individual erosions are summed up to a maximum of 5. The maximal erosion score for each hand is thus 80, considering the16 areas for erosions per hand [41][36].
2.3.5. Ultrasound Findings
Musculoskeletal ultrasonography (MSUS) has established its role in the diagnosis of RA. High resolution gray scale (GSUS) and power Doppler (PDUS) assist the diagnostic performance of 2010 ACR (American College of Rheumatology)/EULAR (European League Against Rheumatism) classification criteria in early detection of RA.
Synovia is the inner layer of the articular capsule. It is a highly vascularized layer of serous connective tissue. It absorbs and secretes synovial fluid and is responsible for the mediation of nutrient exchange between blood and joint. In RA, a patient’s ultrasound often reveals inflammation of the synovia, the so-called synovitis, with the typical accumulation of fluid in the synovia or synovial thickening. The presence of the power Doppler gives us information about the current activity of inflammation. Older inflammation sites most of the time do not have a power Doppler.
The Outcome Measures in Rheumatology (OMERACT) US Working Group formulated the definitions of pathological findings in ultrasound in RA patients and their quantification (Figure 10). The definition and grading of synovitis in RA are presented in Table 2 [17][13].
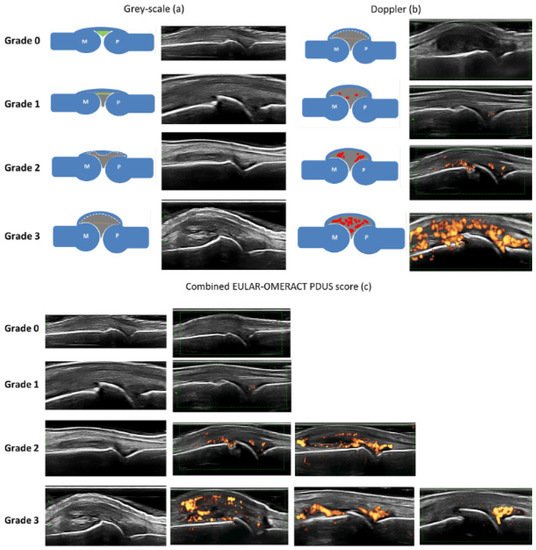
Table 2. EULAR–OMERACT combined scoring system for grading synovitis in rheumatoid arthritis. (GS: gray scale, SH: synovial hypertrophy, PD: power Doppler).
| Grade 0: Normal joint | No GS-detected SH and no PD signal within the synovium |
| Grade 1: Minimal synovitis | Grade 1 SH and ≤Grade 1 PD signal |
| Grade 2: Moderate synovitis | Grade 2 SH and ≤Grade 2 PW signal or Grade 1 SH and a Grade 2 PD signal |
| Grade 3: Severe synovitis | Garde 3 SH and ≤Grade 3 PD signal or Grade 1 or 2 SH and a Grade 3 PD signal |
2.3.6. MRI Findings
MRI is a sensitive imaging modality that allows detailed assessment of inflammation as well as structural damage in RA. Compared to a physical examination, MRI is a more sensitive tool for the identification of tissue damages because of its direct visualization of synovitis, cartilage destruction, bone erosion, bone marrow edema, tenosynovitis, and surrounding soft tissue structures [40][35].
Synovitis (inflammation of the synovia) and tenosynovitis (inflammation of the tendons) at MCP (metacarpophalangeal joints), wrist and MTP (metatarsophalangeal joints) were independently associated with clinical swelling. MRI could detect inflammation in 54–64% of joints with no clinical swelling [42][37].
In order to quantify synovitis, bone marrow edema and bone erosions detected with MRI, an OMERACT RA MRI score (RAMPIS) has been developed and is often used for hands and wrists.
Overall, MRI is often used in the clinical praxis when there is diagnostic doubt in patients with clinically suspected arthralgia (CSA) because it can detect early findings of RA in the preclinical phase, thus offering the physician a window of opportunity of early treatment, which is the key for a good prognosis in RA patients.
2.3.7. The 2010 ACR—EULAR Classification Criteria for Rheumatoid Arthritis
Very useful for the classification of RA patients in clinical studies are the 2010 ACR—EULAR classification criteria for rheumatoid arthritis, which are presented below. A score of >6 is needed for a diagnosis of rheumatoid arthritis. However, it is important that they are classification and not diagnostic criteria. They are meant to be useful for the classification of RA patients in groups for clinical studies. The diagnosis of RA is based on a combination of clinical, radiographic, and serological findings, and the doctor is still the one who will make the diagnosis of RA [43][38].
- Joint involvement
- o
-
0: 1 large joint
- o
-
1: 2–10 large joints
- o
-
2: 1–3 small joints (with or without the involvement of large joints)
- o
-
3: 4–10 small joints (with or without the involvement of large joints)
- o
-
5: >10 joints (at least 1 small joint)
-
Serology
- o
-
0: negative RF and negative anti-CCP
- o
-
2: low-positive RF or low-positive anti-CCP
- o
-
3: high-positive RF or high-positive anti-CCP
-
Acute phase reactants
- o
-
0: normal CRP and normal ESR
- o
-
1: abnormal CRP and abnormal ESR
-
Duration of symptoms
- o
-
0: <6 weeks
- o
-
1: >6 weeks
References
- England, B.R.; Ted, M.R. Epidemiology of, Risk Factors for, and Possible Causes of Rheumatoid Arthritis. UpToDate, 2020. Available online: https://www.uptodate.com/contents/epidemiology-of-risk-factors-for-and-possible-causes-of-rheumatoid-arthritis#! (accessed on 24 October 2021).
- Cross, M.; Smith, E.; Hoy, D.; Carmona, L.; Wolfe, F.; Vos, T.; Williams, B.; Gabriel, S.; Lassere, M.; Johns, N.; et al. The global burden of rheumatoid arthritis: Estimates from the Global Burden of Disease 2010 study. Ann. Rheum. Dis. 2014, 73, 1316–1322.
- Crowson, C.S.; Matteson, E.L.; Myasoedova, E.; Michet, C.J.; Ernste, F.C.; Warrington, K.; Davis, J.; Hunder, G.G.; Therneau, T.M.; Gabriel, S.E. The lifetime risk of adult-onset rheumatoid arthritis and other inflammatory autoimmune rheumatic diseases. Arthritis Rheum. 2010, 63, 633–639.
- Myasoedova, E.; Crowson, C.S.; Kremers, H.M.; Therneau, T.M.; Gabriel, S.E. Is the incidence of rheumatoid arthritis rising? Results from Olmsted County, Minnesota, 1955–2007. Arthritis Rheum. 2010, 62, 1576–1582.
- Eriksson, J.K.; Neovius, M.; Ernestam, S.; Lindblad, S.; Simard, J.F.; Askling, J. Incidence of Rheumatoid Arthritis in Sweden: A Nationwide Population-Based Assessment of Incidence, Its Determinants, and Treatment Penetration: Assessment of RA Incidence in Sweden. Arthritis Rheum. 2013, 65, 870–878.
- Birnbaum, H.; Pike, C.; Kaufman, R.; Marynchenko, M.; Kidolezi, Y.; Cifaldi, M. Societal cost of rheumatoid arthritis patients in the US. Curr. Med Res. Opin. 2009, 26, 77–90.
- Zanisi, L.; Nissen, M.J. Targeted Treatment in Spondyloarthritis. Revue Medicale Suisse. 11 March 2020. Available online: https://www.ncbi.nlm.nih.gov/pubmed/32167249 (accessed on 24 October 2021).
- Maziarz, K.; Krason, A.; Wojna, Z. Deep Learning for Rheumatoid Arthritis: Joint Detection and Damage Scoring in X-rays. arXiv 2021, arXiv:2104.13915. Available online: http://arxiv.org/abs/2104.13915 (accessed on 24 October 2021).
- Boini, S.; Guillemin, F. Radiographic scoring methods as outcome measures in rheumatoid arthritis: Properties and advantages. Ann. Rheum. Dis. 2001, 60, 817–827.
- Hioki, Y.; Makino, K.; Koyama, K.; Haro, H.; Terada, H. Evaluation Method of Rheumatoid Arthritis by the X-ray Photograph using Deep Learning. In Proceedings of the 2021 IEEE 3rd Global Conference on Life Sciences and Technologies (LifeTech), Nara, Japan, 9–11 March 2021; pp. 444–447.
- Hirano, T.; Nishide, M.; Nonaka, N.; Seita, J.; Ebina, K.; Sakurada, K.; Kumanogoh, A. Development and validation of a deep-learning model for scoring of radiographic finger joint destruction in rheumatoid arthritis. Rheumatol. Adv. Pr. 2019, 3, rkz047.
- Dong, F.; Liu, Y.; Cui, C.; Shi, S.; Zeng, J.; Zhang, Y. A Deep Learning Classification of Metacarpophalangeal Synovial Proliferation in Rheumatoid Arthritis by Ultrasound Images. SSRN J. 2020.
- D’Agostino, M.-A.; Terslev, L.; Aegerter, P.; Backhaus, M.R.; Balint, P.; A Bruyn, G.; Filippucci, E.; Grassi, W.; Iagnocco, A.; Jousse-Joulin, S.; et al. Scoring ultrasound synovitis in rheumatoid arthritis: A EULAR-OMERACT ultrasound taskforce—Part 1: Definition and development of a standardised, consensus-based scoring system. RMD Open 2017, 3, e000428.
- Dang, S.D.H.; Allison, L. Using Deep Learning To Assign Rheumatoid Arthritis Scores. In Proceedings of the 2020 IEEE 21st International Conference on Information Reuse and Integration for Data Science (IRI), Las Vegas, NV, USA, 11–13 August 2020; pp. 399–402.
- Huang, Y.-J.; Shun, M.; Zheng, K.; Lu, L.; Lu, Y.; Lin, C.; Kuo, C.-F. Radiographic Bone Texture Analysis Using Deep Learning Models for Early Rheumatoid Arthritis Diagnosis. 2020. Available online: https://assets.researchsquare.com/files/rs-76193/v1/415a2e2e-13c1-4575-ac79-c4e743cf7307.pdf?c=1631855828 (accessed on 24 October 2021).
- Andersen, J.K.H.; Pedersen, J.S.; Laursen, M.S.; Holtz, K.; Grauslund, J.; Savarimuthu, T.R.; Just, S.A. Neural networks for automatic scoring of arthritis disease activity on ultrasound images. RMD Open 2019, 5, e000891.
- Hemalatha, R.J.; Vijaybaskar, V.; Thamizhvani, T.R. Automatic localization of anatomical regions in medical ultrasound images of rheumatoid arthritis using deep learning. Proc. Inst. Mech. Eng. Part H J. Eng. Med. 2019, 233, 657–667.
- Üreten, K.; Erbay, H.; Maraş, H.H. Detection of rheumatoid arthritis from hand radiographs using a convolutional neural network. Clin. Rheumatol. 2019, 39, 969–974.
- Murakami, S.; Hatano, K.; Tan, J.; Kim, H.; Aoki, T. Automatic identification of bone erosions in rheumatoid arthritis from hand radiographs based on deep convolutional neural network. Multimed. Tools Appl. 2018, 77, 10921–10937.
- Lee, S.; Choi, M.; Choi, H.-S.; Park, M.S.; Yoon, S. FingerNet: Deep learning-based robust finger joint detection from radiographs. In Proceedings of the 2015 IEEE Biomedical Circuits and Systems Conference (BioCAS), Atlanta, GA, USA, 22–24 October 2015; pp. 1–4.
- Chaturvedi, N. DeepRA: Predicting Joint Damage From Radiographs Using CNN with Attention. arXiv 2021, arXiv:2102.06982. Available online: http://arxiv.org/abs/2102.06982 (accessed on 24 October 2021).
- Norgeot, B.; Glicksberg, B.S.; Trupin, L.; Lituiev, D.; Gianfrancesco, M.; Oskotsky, B.; Schmajuk, G.; Yazdany, J.; Butte, A.J. Assessment of a Deep Learning Model Based on Electronic Health Record Data to Forecast Clinical Outcomes in Patients With Rheumatoid Arthritis. JAMA Netw. Open 2019, 2, e190606.
- Rohrbach, J.; Reinhard, T.; Sick, B.; Dürr, O. Bone erosion scoring for rheumatoid arthritis with deep convolutional neural networks. Comput. Electr. Eng. 2019, 78, 472–481.
- Dream Challenge: Automated Scoring of Radiographic Joint Damage. 2020. Available online: https://www.synapse.org/#!Synapse:syn20545111/wiki/594083 (accessed on 29 October 2021).
- Mielnik, P.; Fojcik, M.; Segen, J.; Kulbacki, M. A novel method of synovitis stratification in ultrasound using machine learning algorithms: Results from clinical validation of the Medusa Project. Ultrasound Med. Biol. 2018, 44, 489–494.
- Amaya-Amaya, J.; Botello-Corzo, D.; Calixto, O.-J.; Calderón-Rojas, R.; Domínguez, A.-M.; Cruz-Tapias, P.; Montoya-Ortiz, G.; Mantilla, R.-D.; Anaya, J.-M.; Rojas-Villarraga, A. Usefulness of Patients-Reported Outcomes in Rheumatoid Arthritis Focus Group. Arthritis 2012, 2012, 1–13.
- Marcucci, E.; Bartoloni, E.; Alunno, A.; Valentini, V.; Valentini, E.; La Paglia, G.M.C.; Bonifacio, A.F.; Gerli, R. Extra-articular rheumatoid arthritis. Reumatismo 2018, 70, 212–224.
- Das, S.; Padhan, P. An Overview of the Extraarticular Involvement in Rheumatoid Arthritis and its Management. J. Pharmacol. Pharmacother. 2017, 8, 81–86.
- Van Riel, P.L.C.M.; Renskers, L. The Disease Activity Score (DAS) and the Disease Activity Score using 28 joint counts (DAS28) in the management of rheumatoid arthritis. Clin. Exp. Rheumatol. 2016, 34, S40–S44.
- DAS 28—Disease Activity Score Calculator for Rheumatoid Arthritis. Available online: http://www.4s-dawn.com/DAS28/ (accessed on 30 October 2021).
- Fleischmann, R.M.; Van Der Heijde, D.; Gardiner, P.; Szumski, A.; Marshall, L.; Bananis, E. DAS28-CRP and DAS28-ESR cut-offs for high disease activity in rheumatoid arthritis are not interchangeable. RMD Open 2017, 3, e000382.
- Fransen, F. Remission in rheumatoid arthritis: Agreement of the disease activity score (DAS28) with the ARA preliminary remission criteria. Rheumatology 2004, 43, 1252–1255.
- Smolen, J.S.; Aletaha, D.; Barton, A.; Burmester, G.R.; Emery, P.; Firestein, G.S.; Kavanaugh, A.; McInnes, I.B.; Solomon, D.H.; Strand, V.; et al. Rheumatoid Arthritis. Nature Reviews. Disease Primers. Available online: https://pubmed.ncbi.nlm.nih.gov/29417936/ (accessed on 30 October 2021).
- Tavakoli, M.; Batista, R.; Sgrigna, L. The UC Softhand: Light Weight Adaptive Bionic Hand with a Compact Twisted String Actuation System. Actuators 2015, 5, 1.
- Zabotti, A.; Finzel, S.; Baraliakos, X.; Aouad, K.; Ziade, N.; Iagnocco, A. Review Imaging in the preclinical phases of rheumatoid arthritis. Clin. Exp. Rheumatol. 2020, 38, 536–542.
- Ory, P.A. Interpreting radiographic data in rheumatoid arthritis. Ann. Rheum. Dis. 2003, 62, 597–604.
- Mathew, A.J.; Danda, D.; Conaghan, P.G. MRI and ultrasound in rheumatoid arthritis. Curr. Opin. Rheumatol. 2016, 28, 323–329.
- Kay, J.; Upchurch, K.S. ACR/EULAR 2010 rheumatoid arthritis classification criteria. Rheumatology 2012, 51, vi5–vi9.
More