The preferential CO oxidation (so-called CO-PROX) is the selective CO oxidation amid H2-rich atmospheres, a process where ceria-based materials are consolidated catalysts. This article aims to disentangle the potential CO–H2 synergism under CO-PROX conditions on the low-index ceria surfaces (111), (110) and (100). Polycrystalline ceria, nanorods and ceria nanocubes were prepared to assess the physicochemical features of the targeted surfaces. Diffuse reflectance infrared Fourier-transformed spectroscopy (DRIFTS) shows that ceria surfaces are strongly carbonated even at room temperature by the effect of CO, with their depletion related to the CO oxidation onset. Conversely, formate species formed upon OH + CO interaction appear at temperatures around 60 °C and remain adsorbed regardless the reaction degree, indicating that these species do not take part in the CO oxidation. Density functional theory calculations (DFT) reveal that ceria facets exhibit high OH coverages all along the CO-PROX reaction, whilst CO is only chemisorbed on the (110) termination.
1. Introduction
Ceria-based materials have been extensively used as CO oxidation catalysts due to their unique redox features
[1][2][3][1,2,3]. A particular niche of this application is the preferential CO oxidation (CO-PROX), which is the preferred catalytic strategy towards the removal of CO impurities from H
2 reformate streams
[4][5][4,5]. The CO clean-up in these streams is crucial for the deployment of H
2-based fuel cell technologies, which currently rely on strongly CO-sensitive Pt electrodes
[6]. Broadly speaking, CO-PROX consists in the selective oxidation of CO in a highly H
2-rich atmosphere. Besides good selectivity, this process requires a high CO conversion up to the remarkably low ppmv CO tolerance limit of Pt-based electrodes
[7][8][7,8]. Furthermore, this should be achieved within a low temperature range (ca. < 200 °C) and in the presence of CO
2 + H
2O inhibitors. Therefore, the design of suitable active and durable CO-PROX catalysts is a challenge that has been partially addressed over years of fundamental and applied research. Among the state-of-the-art CO-PROX catalysts, CuO/CeO
2 materials have been consolidated due to their near-optimal catalytic outputs with admirable robustness, cyclability, resistance to CO
2 and H
2O inhibition and low cost
[9].
CuO/CeO
2 systems are intrinsically complex materials wherein interfacial interactions of a synergistic redox nature occur, giving rise to unique catalytic features. It is well-reported that the improved reducibility of the catalyst by the labile Cu
2+/Cu
+-Ce
4+/Ce
3+ redox interplay facilitates the formation of surface Cu
+ species, pinpointed as the CO adsorption and oxidation sites
[10][11][12][10,11,12]. On the other hand, since Cu
0 species are known to boost the undesired H
2 oxidation, CO selectivity is determined by the oxidation state of copper particles, which varies throughout the CO-PROX reaction
[13]. In turn, tuning the redox features of the CuO/CeO
2 material has proven to have a direct impact on CO-PROX catalytic performance
[14][15][16][14,15,16].
As an inherent characteristic of CO-PROX, CO selectivity drops with temperature, and the steepness of the fall mainly depends on the difference between the CO and H
2 oxidation reaction onsets
[17]. Interestingly, although there are comprehensive reports addressing the competitive nature between CO and H
2 oxidation reactions on CuO/CeO
2, the underlying interaction of hydrogen with CO oxidation is still an unresolved question
[11][18][19][20][11,18,19,20]. Some studies have reported that CO inhibits H
2 oxidation
[11][18][11,18], while CO oxidation is favored by the presence of H
2 [21][22][21,22]. To date, different interpretations of this kinetic interplay have been proposed based on the CO-PROX selectivity dependence on the relative CO/H
2 surface coverages rather than on the O
2 partial pressure
[18][23][24][25][18,23,24,25]. One hypothesis is that hydrogen hampers CO adsorption while promoting CO
2 desorption
[26]. Polster et al.
[11] reported that surface hydroxylation may displace CO from the adsorption sites on a CuO/CeO
2 catalyst, although CO binding was strengthened by surface hydration. A complementary hypothesis considers the chemical CO–H
2 interaction as a source of formates
[27][28][27,28], which are deemed to promote CO oxidation on Pt/Al
2O
3, although accumulation of adsorbate species can lead to catalyst deactivation
[29]. Other hypotheses consider that OH groups could facilitate the formation of partially hydrogenated intermediates (e.g., bicarbonates) with an overall beneficial effect on the reaction kinetics due to their faster desorption rate
[30][31][30,31]. Altogether, these studies indicate that the nature of the CO–H
2 interaction depends on the specific properties of the studied catalyst, which dictate the prevalence of the reaction mechanism.
In ceria-based catalysts, spectroscopic studies have evidenced the formation of carbonaceous species such as carbonates and bicarbonates at room temperature under CO-PROX mixtures
[32][33][32,33], while formates typically appear at temperatures beyond 100 °C
[28]. Carbonates and bicarbonates are retained products of CO oxidation, and their presence below the CO oxidation onset along with the formation of Cu
+ carbonyls indicate the occurrence of a low-temperature CO oxidation. Previously, we reported that the rate of CO oxidation might be controlled by product desorption in a low-temperature regime when CO
2 is accumulated on the ceria surface as strongly bound carbonate groups. The results showed that the formation of less stable bicarbonate intermediates resulted in a positive effect on CO oxidation kinetics
[30]. Hence, the presence of H
2 promotes CO oxidation prior to the hydrogen oxidation reaction onset point, beyond which OH groups are released in the form of water by means of lattice oxygen abstraction in a process that competes with CO oxidation. Beyond a critical low temperature, the nature of the carbonaceous intermediates formed during CO oxidation becomes irrelevant as product desorption is relatively fast.
2. Characterization of Ceria Surfaces
2.1. Physicochemical Features of Nano-Shaped Ceria Samples
Polycrystalline ceria, nano-cubes and nano-rods display distinct characteristic structural features that determine their crystallinity and textural properties. While polycrystalline ceria is the mere product of calcination of cerium precursors, nano-shaped materials were prepared through hydrothermal methods.
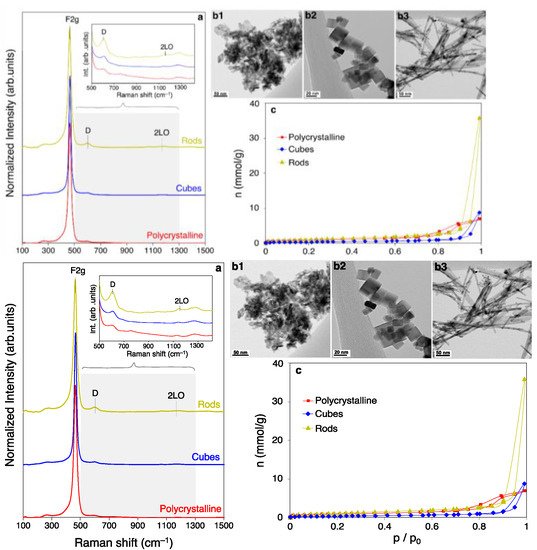
Figure 1 compiles Raman spectroscopy (a), TEM (b), and N
2 physisorption analyses (c) of the synthesized ceria samples. Raman spectra (
Figure 1a) provides information of the crystalline structure with sufficient sensitivity to reveal any changes in the lattice parameter and crystalline disruptions. In general, Raman spectra of CeO
2 exhibit a distinctive vibrational mode at ca. 462 cm
−1 ascribed to the oxygen in the fluorite lattice (F
2g)
[34]. At ca. 590 cm
−1 is located the D band, traditionally assigned to the presence of lattice defects such as oxygen vacancies
[35]. However, the overlap with second-order bulk vibrational modes (i.e., A
1g, F
2g and E
g) brings inaccuracy to the assumption of a direct relation between defects and the D band contribution
[36]. Other minor bands at ca. 250 and 405 cm
−1 can be attributed to the vibration of surface Ce-O bonds
[37], while the weak band appearing at 1170 cm
−1 is the second-order Raman mode 2LO.
Table 1 displays the position of the F
2g band maxima and the D/F
2g band ratio, calculated for each sample. Ceria nanocubes exhibit a blue-shifted F
2g band maxima by 2.0 cm
−1, which evidences significant differences in the particle sizes compared to the other counterparts
[38].
Figure 1. (a) Raman spectra of the prepared ceria catalysts with zoomed 500–1300 cm−1 range inset; (b) TEM images of polycrystalline ceria (b1), nano cubes (b2) and nano rods (b3); (c) N2 physisorption isotherms recorded at −196 °C for the different ceria samples.
Table 1. Physicochemical characterization results for the nano-shaped ceria materials extracted from Raman spectroscopy, N2 physisorption isotherms, X-ray diffraction and X-ray photoelectron spectroscopy (XPS).
| Material |
F2g | (cm | −1 | ) |
D/F2g | Band Ratio |
S | BET | (m | 2 | /g) |
V | micro | (cc/g) |
a (nm) |
D (nm) |
Surface Ce | 3+ | (%) |
O | lab | /O | lat | (%) |
| Polycrystalline |
462.6 |
0.05 |
71 |
0.04 |
5.411 |
9.5 |
21 |
30 |
| Nanocubes |
464.6 |
0.05 |
30 |
0.00 |
5.414 |
22.5 |
26 |
35 |
| Nanorods |
462.6 |
0.06 |
93 |
0.06 |
5.411 |
9.0 |
21 |
19 |
Data extracted from X-ray diffractograms reveal that lattice parameters (a) are consistent with the reported for ceria
[39]. However, nanocubes exhibit a greater crystallite size (D, Scherrer equation) of i.e., 22.5 nm in contrast to the ca. 9 nm determined for polycrystalline ceria and nanorods, as seen in
Table 1. On the other hand, D/F
2g ratios suggest that nanorods present a higher concentration of oxygen vacancies, in line with previous observations
[40][41][40,41], although the recorded XPS spectra rule out the greater intrinsic reduction of the ceria surface in the rod-like sample. The percentage of reduced Ce ions (3+) calculated from the corresponding contributions in the Ce 3d XPS region
[42] is shown in
Table 1, besides the labile to lattice O ratio (O
lab/O
lat) determined from the O 1s region. According to these parameters, cubes exhibit a slightly more reduced surface, which is consistent with the blue shift observed in the F
2g Raman band.
Transmission electron microscopy (TEM) (
Figure 1b) provides visual confirmation of the targeted crystal morphology in each case. Namely, ceria polycrystalline (
Figure 1b1) are constituted by irregular particles in size and shape, nanocubes (
Figure 1b2) display a cubic-like crystals, while nanorods (
Figure 1b3) exhibit a characteristic nanofibrillar array. In the case of the polycrystalline sample, it is composed by a variety of polyhedral-shaped particles with predominance of the low energy {111} planes. On the contrary, it has been extensively reported in literature that nanocubes expose six {100} facets, while corners and edges are composed by the {111} and {110} terminations. On the other hand, nanorods are built upon the crystal growth along the [110] direction, dominated eventually by a mixture of {110} and {100} surface planes
[43]. The characteristic lattice fringes assessed by TEM characterization (
Figure S3) confirm the abundance of the representative terminations in the prepared set of materials
[44].
N
2 physisorption isotherms (
Figure 1c) display typical type IV isotherms characteristic of micro/mesoporous materials
[45]. However, whilst polycrystalline ceria exhibits a type H2(b) hysteresis loop, nanocubes and nanorods show a type H3. H2(b)-type hysteresis is a sign of a broad pore size distribution, whereas type H3 is characteristic of non-rigid plate-like aggregates
[46]. The calculated B.E.T. surface area and total micropore volume are presented in
Table 1, revealing that the porosity increases according to the following trend: nanocubes << polycrystalline < nanorods. The lower porosity assessed for cubes agrees with the bigger crystallite size of the cubic-like particles. On the contrary, rods display an enlarged porosity compared to the polycrystalline sample mainly due to the additional presence of macropores, as evidenced by the sharp increase at the maximum relative pressure. The enriched porosity in the meso/macro range can be related to the lower packing density of rod-like particles, leading to a broader interparticle space
[47].
2.2. Computational Simulation of Low-Index Ceria Surfaces
The low-index CeO
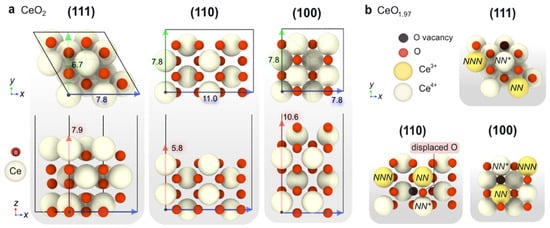
2 surfaces (111), (110) and (100), representative of polycrystalline ceria, nanorods and nanocubes, respectively, have been modelled by means of periodic DFT calculations. The constructed surface slabs used in the calculations are illustrated in
Figure 2a. In short, CeO
2(111) is an O-terminated non-polar O-Ce-O-O-Ce-O structure with p(2 × 2) periodicity presenting four coordinatively unsaturated O atoms on the surface. On the other hand, the (110) slab is a Ce–O terminated surface wherein neutrality is kept within each atomic layer. The periodicity of this slab was set to p(2 × 1), resulting in eight coordinatively unsaturated O atoms on surface. Finally, the CeO
2(100) slab consists of alternate Ce-O-Ce-O arrays, which results in a net polar character with a dipole moment oriented along the z axis. To avoid any potential dipole effects in our DFT calculations, the (100) slab was reconstructed by moving half of the surface O atoms to the bottom layer, resulting in a surface exposing four unsaturated O atoms, as in the case of CeO
2(111).
Figure 2. (a) Top (above) and side (below) views of the DFT-modeled stoichiometric surface slabs CeO2 (111), CeO2 (100) and CeO2 (110). The slab dimensions are also given (in Å). (b) Top view of the non-stoichiometric slabs featuring one O surface vacancy with the polaron localized in the most stable configuration. NN and NNN denote the nearest neighbor and next-nearest neighbor positions with respect to the O vacancy, respectively.
As depicted in
Figure 2, the modeled slabs display different atom packing density, which gives rise to different surface energies, as shown in
Table 2. The calculated surface energies follow the trend (111) > (110) > (100), which is in good agreement with previous theoretical works
[43][48][43,48]. Since ceria-based catalysts are known to participate in oxidation processes through their labile lattice oxygens
[49][50][49,50], the oxygen vacancy formation energy (E
vac) has been proposed as reaction descriptor
[51][52][53][51,52,53]. However, Kropp and Mavrikakis
[54] recently demonstrated a non-monotonic relationship between CO oxidation barriers and E
vac in reducible catalysts, given the variable nature of E
vac alongside the reaction conditions. In any case, E
vac values can serve as good indicators of the intrinsic relative readiness of the surface to provide active oxygen, which is eventually refilled by O
2 gas molecules.
Table 2. Summary of the DFT results of the modelling of the different ceria slabs. From left to right: surface energy (γ); O vacancy formation energy (Evac); electron localization upon O vacancy formation (e− distr.); Energies of O2 adsorbed species (*O–O) on the O vacancy site referenced to the clean sur-face (ΔEO2); and the corresponding type, i.e., O2−(superoxide) or O22− (peroxide).
| Surface |
Formula |
γ (eV/Å | 2 | ) |
E | vac | (eV/O Atom) |
e | – | Distr. |
E | ads | O | 2 | (eV) |
Type *O | 2 |
| CeO | 2 | (111) |
Ce | 12 | O | 24 |
0.044 |
2.22 |
NN | / | NNN |
0.79 |
O | 2− |
| |
|
|
2.71 |
NN | / | NN |
0.36 |
O | 22− |
| CeO | 2 | (110) |
Ce | 16 | O | 32 |
0.075 |
1.32 |
NN | / | NNN |
0.72 |
O | 2– |
| |
|
|
1.80 |
NN | / | NN |
0.17 |
O | 22– |
| CeO | 2 | (100) |
Ce | 16 | O | 32 |
0.113 |
1.68 |
NN | / | NNN |
0.26 |
O | 2– |
| |
|
|
1.76 |
NN | / | NN |
−0.34 |
O | 22– |
Table 2 shows the computed E
vac for each surface slab, which strongly depends on the electron localization upon O vacancy formation
[55]. In particular, the abstraction of an O
2– anion from the lattice results in a charge imbalance of +2, which is restored by the reduction of two Ce
4+ cations to Ce
3+. In the CeO
2 slabs, the nearest neighbor Ce ions to the O vacancies are labelled as
NN, while
NNN denotes the next-nearest neighbors. Our calculations indicate that the most stable rearrangement is
NN/
NNN regardless of the surface facet, leading to the following trend in the oxygen vacancy formation energy: (111) > (100) > (110). The optimized non-stoichiometric slabs after the formation of one oxygen vacancy are shown in
Figure 2b. Noticeably, the
NN/
NNN configuration for the non-stoichiometric (110) surface leads to the lowest energy, i.e., 1.32 eV, which corresponds to 0.17 eV per surface O atom. Conversely, the (100) termination has associated a larger oxygen vacancy formation energy, despite exhibiting a lower atomic density. Regarding this, while the ongoing ionic relaxations upon O-vacancy formation in (111) and (100) are moderate, in (110), the neighboring surface O is significantly displaced towards an equidistant position between the original
NN and
NN Ce
4+ cations. This higher relaxation in the (110) surface results in a reduced E
vac.
Since the oxygen vacancy must be refilled with an incoming O
2 to complete the catalytic cycle, we investigated the interaction between the ceria surfaces and the O
2 molecule.
Table 2 compiles the lowest O
2 adsorption energies (
Eads) for the non-stoichiometric slabs containing one O-vacancy in their most favored electronic distribution. Among the reactive oxygen species that can be formed upon O
2 adsorption on the oxygen vacancy, peroxides (O
22−) and superoxides (O
2−) must be highlighted. Superoxides and peroxides exhibit different spin states (i.e., triplet and singlet, respectively) and the latter are generally lower in energy
[56]. It is assumed that O
2 adsorption and O lattice restitution proceeds via the following steps: O
2 (g)–O
2−–O
22−–2 O
2−, wherein superoxides naturally evolve to peroxides. Previous theoretical studies
[57][58][59][57,58,59] have also reported in detail the healing of oxygen vacancies in different ceria surfaces and our results are in close agreement, though the computed energies may differ slightly due to the particularities of the models employed. O
2 adsorption on the O vacancy leads to a tilted *O-O molecule with elongated bond distances of ca. 1.35 and 1.44 Å for superoxides and peroxides, respectively. In the case of peroxides, the vacancy site is healed by one of the O atoms, while the other can diffuse on the surface to refill a second O vacancy present in the neighboring sites. Huang et al.
[57] reported that the energy barrier for the diffusion of an O adatom is ca. 1.4 eV for (111) and 1.70 eV for (110), which suggests that peroxides may be present as reactive adsorbates at low temperatures. In these conditions, the second O could remain loosely bound to the just refilled O vacancy and be available to react with new incoming reactant species, such as CO or H
2. Recently, Ziemba et al.
[60] have reported a study of the interaction of O
2 with reduced ceria surfaces, demonstrating a close correlation between the outcomes from state-of-the-art spectroscopy techniques and theory. Herein, the participation of these reactive oxygen species in the CO-PROX mechanism has been carefully investigated (vide infra).
3. CO Oxidation Operando DRIFTS Experiments
The catalytic performance of undoped CeO
2 with different morphologies in CO oxidation and other processes has been previously reported
[61][62][63][64][61,62,63,64]. In short, these studies confirm that tuning the morphology of CeO
2 to increase specific surface area and selectively expose the (110) facet has a critical effect on CO oxidation activity. In this work, polycrystalline ceria samples expose mostly (111) facets, while (110) surfaces are also abundant according to TEM characterization. Hence, this material has interesting features in terms of simplicity, stability and reactivity, and for this reason, we will focus on this sample. In particular, in this section we describe our investigations on the CO oxidation mechanism by means of DRIFT spectroscopy experiments in two different set of conditions: (a) in presence of an excess of H
2 (CO-PROX); (b) in a H
2-free atmosphere (CO-TOX).
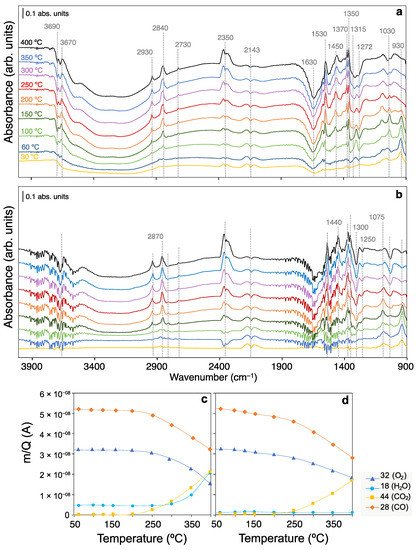
Figure 3a,b display the characteristic vibration modes of adsorbates found on the CeO
2 catalytic surface during CO oxidation in the presence and absence of an excess of H
2 (i.e., CO-PROX and CO-TOX conditions, respectively). From left to right, the 4000–2500 cm
–1 region contains the fingerprint vibrational O-H and C-H stretching modes. Isolated hydroxyl groups are located in the 3700–3670 cm
−1 range as narrow bands, and the coordination of OH groups to the surface determines the frequency of the O-H stretching mode. In particular, monocoordinated OH species show higher wavenumber compared to bi- and tricoordinated OH groups. On the other hand, the position of the bands is also known to be sensitive to surface Ce reduction, while increasing the temperature leads to the depletion of isolated OH groups during CO oxidation experiments, being assigned to Type II hydroxyls (bicoordinated) with center at 3670 cm
−1 [65][66][65,66].
Figure 3. Operando DRIFT spectra recorded at different temperatures with the polycrystalline CeO2 catalyst under (a) CO-PROX and (b) CO-TOX conditions. Below, evolution with temperature of the average outlet m/Q signals at steady conditions evolved from the DRIFTS reaction cell in (c) CO-PROX and (d) CO-TOX experiments.
The presence of H
2 in the reaction stream additionally leads to the consumption of higher frequency OH groups (i.e., 3690 cm
–1), attributed to monocoordinated hydroxyls or OH on Ce
3+ sites
[67]. On the other hand, H-bonding between surface OH groups and H
2O molecules, a characteristic feature of high OH coverages, display a broad absorption band in the 3600–2800 cm
–1 range. Both in presence and absence of H
2, polybonded surface OH moieties are depleted upon CO oxidation, though in the presence of H
2 a more dramatic effect is observed. As has been well reported, the interaction of ceria with H
2 mixtures leads to surface reduction by H
2 adsorption and H
2O release
[68]. Under experimental conditions, in presence of inlet O
2, the removal of H
2O may also be due to the competing H
2 oxidation reaction.
C-H vibration modes are found in the 2700–2950 cm
−1 range which can be attributed to formate species. Since formates are generated during CO oxidation independently of H
2 co-feeding, the intrinsically present OH groups must be involved. In particular, the characteristic frequency of C-H bond stretching [ν(CH)] of formates is reported at 2845 cm
−1. Minor bands with centers at 2930 and 2730 cm
−1 are also associated with formates, being ascribed to the combination of the C-H bending + the asymmetric OCO stretching [δ(CH)] + ν(OCO)] modes and the C-H bending overtone [2δ(CH)]. Hence, regardless of the presence of H
2 in the reaction stream, formates are formed during CO oxidation on the ceria surface. Finally, minor evidence of formyl species (CHO) at incipient stages of CO oxidation is revealed by their characteristic ν(CH) band at 2790 cm
–1. Overall, our results show that CO oxidation involves the participation of OH groups via (i) inherently present OH species, and/or (ii) the dynamic H
2 dissociative adsorption. Further confirmation of formate (OCHO) species is found in the 1900–900 cm
−1 range, as described below.
The P and Q rotational branches of CO
2 and CO gases are located at ca. 2350 cm
−1 and 2143 cm
−1, respectively. Note that the initial decrease in CO
2 band relates to the presence of residual CO
2 during the He-background measurement, released upon the in situ sample preconditioning in O
2. In the experimental conditions of the DRIFTS setup, the weak Ce
δ+-CO carbonyl band was not discerned below the CO gas band in the presence or absence of H
2. Conversely, the interaction of ceria with CO leads to the formation of carbonate-like species as revealed by the numerous bands in the 1600–1000 cm
−1 region. Importantly, the co-presence of H
2 in the reaction stream has an apparent effect on the surface coverage, but not on the nature of the adsorbate species. Thus, carbonate and formates are found to be stabilized on ceria even at temperatures below the CO oxidation onset. This indicates that CO is prone to reduce the ceria surface via a low temperature adsorption (below 100 °C), and since CO-PROX conditions show an apparent higher coverage, the co-presence of H
2 enhances CO retention in the form of formates and carbonates. On the other hand, the negative evolution in the bands located at ca. 1630, 1420 and 1280 cm
−1 reveals the consumption of bicarbonate groups (HCO
3−) during the CO oxidation. This observation suggests that CO evolves to carbonate-like species and formates, whilst the advance of the reaction reduces the coverage of bicarbonates.
To shed light on the above experimental results, we carried out a computational investigation of the adsorption modes of CO on the various ceria surfaces under representative conditions of CO-PROX and CO-TOX experiments.
4. DFT Simulation of CO-PROX Reaction in Ceria Catalysts
4.1. Surface Coverage Studies in CO-PROX Conditions
Firstly, the resting state of each of the ceria surfaces under relevant CO-PROX conditions was determined. Upon the dissociative adsorption of H
2, two OH groups are formed
[69] leading to the one-electron reduction of two Ce
4+ surface sites to Ce
3+. Since theoretical calculations have demonstrated that H
2 dissociation on ceria is thermodynamically driven at relatively low temperatures
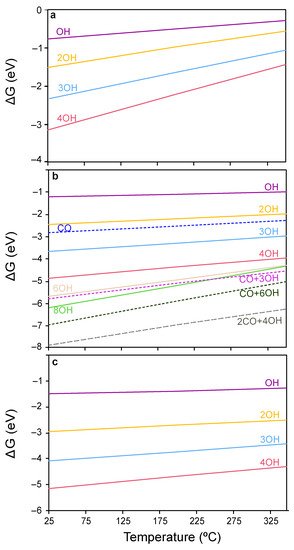
[70][71][70,71], the H coverage was assessed herein by calculating the energies of ceria surfaces covered with different concentrations of OH groups. The coverages explored and their corresponding relative Gibbs energies in the temperature range of 25–350 °C are represented in
Figure 4a–c. As can be observed, throughout the temperature window of interest in CO-PROX (i.e., 25–200 °C), ceria surfaces are predicted to be covered by H in the form of OH groups. In particular, the four surface O atoms in CeO
2(111) and CeO
2(100) are fully hydrogenated (4 OH), while the eight surface oxygens in CeO
2(110) are terminated with 4 OHs and 2 CO moieties strongly stabilized as carbonates (see below).
Figure 4. Coverage analysis on the ceria surfaces (a) (111), (b) (110) and (c) (100). Solid lines denote OH coverages, while dotted lines represent mixed coverages of OH and CO groups.
With regards to CO, the Gibbs adsorption energies of this species on the clean (111) and (100) surfaces are relatively weak (i.e., −0.18 and −0.33 eV, respectively) compared to hydrogen. On the contrary, CO binds very strongly on the (110) surface as a carbonate-like species with an energy of –3.66 eV, in good agreement with the literature
[72][73][74][75][72,73,74,75], leading to the reduction of two neighboring Ce
4+ cations.
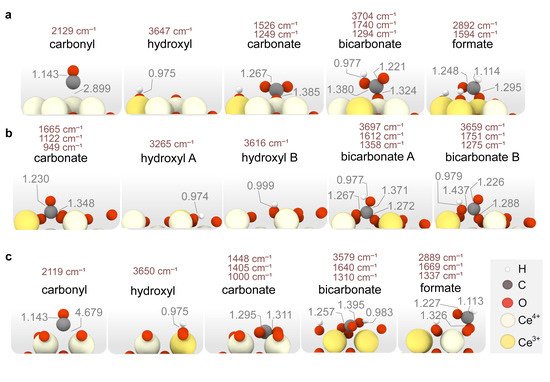
Figure 5 shows the most stable configurations of the adsorbates found in CO oxidation conditions on each stoichiometric ceria surface. Since the coverage analysis reveals that OHs populate the ceria surfaces in the presence of H
2, the Gibbs adsorption energies of *CO
x adsorbates at different temperatures and OH coverages were computed. Interestingly, the binding modes of *CO
x species remain unaltered in the presence of OH coverage despite the local Ce reduction induced by H
2 dissociation leads to stronger *CO
x–ceria interactions. Ceria surfaces may present two types of Lewis basic sites for CO
x adsorption, namely surface oxygens and hydroxyls
[76]. Whilst OHs are deemed as weaker base centers
[77], their presence on the surface increases the Lewis basicity of surface oxygens due to the coexistence of reduced Ce
3+ cations. Thus, CO
2 adsorption on the hydroxylated surfaces gives rise to bicarbonates (O*COOH), while CO
2 adsorption on O sites leads to carbonates (O*COO). On the other hand, the adsorption of CO on OH-covered ceria surfaces can lead to formates (O*CHO), which are very stable.
Figure 5. Representation of the most energetically favorable adsorption modes for CO, CO2 and H2 on stoichiometric (a) CeO2(111), (b) CeO2(110), (c) CeO2(100). Calculated vibrational frequencies (in cm−1) and relevant distances (in Å) are also shown.
DFT calculations also reveal that the type of surface carbonate species varies with the surface termination. In particular, carbonates formed upon CO
2 adsorption on CeO
2(111) display a monodentate mode, while on CeO
2(100) they adopt a multidentate geometry with a much lower relative energy (i.e., −1.96 vs. −0.46 eV). Similarly, CO
2 adsorption on the clean (110) surface results in a monodentate carbonate with a relative energy of −1.31 eV (not shown in
Figure 5 since the carbonate formed upon CO adsorption has a remarkably greater stability).
As regards to CO, this species merely physisorbs on top of Ce in CeO
2(111), while it forms a bridged Ce-CO carbonyl on CeO
2(100), and a strongly bound bidentate carbonate on CeO
2(110). In addition, the most stable bicarbonate binding modes vary on the different surfaces, being monodentate in (111), bidentate in (110) and multidentate in (100). Finally, from the calculated CO
2 adsorption energies on the clean surfaces, we can conclude that the strength of the Lewis basic sites increases according to the trend (111) < (110) < (100), in agreement with the literature
[77]. Our calculations also indicate that OH coverages hinder CO
2 adsorption as carbonates on the ceria surfaces. An exception, however, is the CO adsorption on (110) since the formation of a carbonate species provides a larger stabilization than the OH coverage, as observed in
Figure 4b (4 OHs vs. CO + 3 OHs). Altogether, DFT calculations indicate that ceria surfaces will be hydroxylated under CO-PROX conditions and that no surface oxygens may be available. In the next section, the CO oxidation mechanism is studied on both the clean and OH-covered ceria surfaces representative of CO-TOX (H
2-free CO oxidation) and CO-PROX conditions. Since CeO
2(100) is the least exposed surface in representative polycrystalline ceria samples, given it has the highest surface energy, our further reactivity studies placed more focus on the (111) and (110) facets.
4.2. CO Oxidation on CeO2 in CO-PROX Atmosphere
To discern the potential catalytic effect of H
2 on CO oxidation, two scenarios are contemplated in the present study, namely a ceria clean surface and a hydroxylated surface.
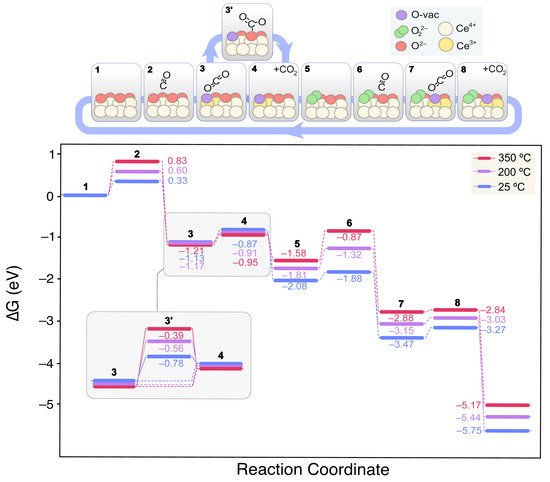
Figure 6 shows the lowest energy mechanism found for CO oxidation on the clean CeO
2(111) surface.
Figure 6. Calculated Gibbs energy diagram for the CO oxidation mechanism on a stoichiometric CeO2(111) clean surface at different experimental temperatures. The structures of the different reaction intermediates are depicted at the top of the diagram.
On the clean CeO
2(111) surface, CO remains physisorbed at 2.899 Å from a surface Ce
4+ ion
(2). The CO Gibbs binding energy increases with temperature from 0.33 to 0.83 eV within the range of 25 to 350 °C. Next
(3), CO diffuses from the top-Ce position to bind a surface O
2− leading to CO
2 and an oxygen vacancy (V
O). This process is exergonic by −1.46 eV (at 25 °C) given the increased stability of CO
2 with regards to CO. The resulting CO
2 is physisorbed on the boundaries of the recently formed V
O. Subsequently, it can be either directly desorbed to the gas phase
(4) or chemisorbed on another surface O
2− giving rise to a carbonate CO
32− species
(3′). Although at room temperature these processes might be in equilibrium, the release of CO
2 to the gas phase will prevail at higher temperatures. Next, the O
2 adsorption on the V
O leads to a peroxide (O
22−) intermediate
(5), which restitutes the oxidized redox state of ceria, lowering the energy by −1.21 eV at 25 °C. From this state, a new CO molecule could interact with the surface as in
(2). The CO binding energy on this surface
(6), however, does not change when compared to that on the clean slab
(2), and no interaction between *CO(ads) and *O
22−(ads) was observed. On the contrary, as in
(3), the interaction between the O
2–(lat) bound to CO leads to the release of *CO
2(ads) and the concomitant formation of a new V
O. Finally, the loosely bound O from the peroxide group migrates to the neighboring V
O and refills it recovering the original state and closing the catalytic cycle
(9).
In this reaction scheme, the endergonic steps are essentially the weak CO adsorptions, whereas the overall process is thermodynamically very favored. In fact, the interaction is so weak that it is also claimed that CO oxidation may proceed via Eley–Rideal mechanism on ceria, involving a CO from the gas phase reacting with surface O
[78]. This is corroborated by our CI-NEB results, where no transition state (TS) could be found for this process, but a V-bent structure with a partially formed C–O–O bond.
Based on the coverage analysis presented in
Figure 4a, the CeO
2(111) slab is fully hydroxylated under CO-PROX conditions, meaning that all surface oxygens are hydroxylated. However, in contrast to O
2− our results showed that CO is not capable to directly bind to OH. Herein, we opted to study a 2 OH-covered surface to model the ceria in the CO-PROX reaction so that O
2− sites are available for the reaction. Nevertheless, we modelled the reaction mechanism under different coverages to assess the best pathway and rule out a OH coverage dependence. According to this analysis, the presence of a third OH group systematically increases the stability of the CO
x intermediates on the surface, while the relative energy difference between steps is not significantly affected. Thus, although high OH coverages impede the CO-surface interaction by extensively blocking the active O
2−, the residual freely-exposed O
2− sides will display an enhanced basicity.
To deplete the stable OH groups on CeO
2(111), sufficient energy must be provided for these OH to recombine giving rise to H
2O and a V
O. Then, new available O
2− sites would be formed by the subsequent refilling by O
2 from the gas phase. The energy for OH recombination was calculated to be endergonic by 1.68 eV at 25 °C, and 1.30 eV at 200 °C. Thus, at temperatures above 200 °C it is expected that some of the hydroxyl groups recombine leading to oxygen vacancies and increasing lattice defects.
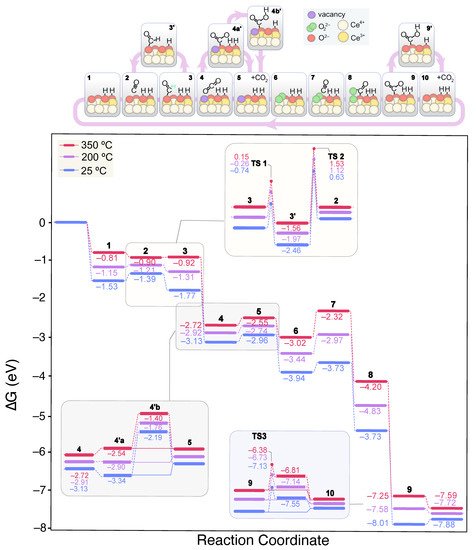
Figure 7 shows the lowest energy mechanism found for CO oxidation on the 2 OH-CeO
2(111) surface. In contrast to the clean, fully oxidized surface, CO can form a carboxylate (*OCO
2−) on the 2 OH-covered surface, a V-shaped CO
2 molecule with a O–C–O angle of 134.3° (structure 3 in
Figure 7). The formation of carboxylates, also known as carbonites, is thermodynamically driven even at 25 °C by the adsorption of CO on a surface oxygen according to: CO(gas) + O
2−(lat) → CO
22−(ads). This process was modeled by means of CI-NEB calculations, displaying two low energy transition states of 0.24 and 0.33 eV, structures corresponding to CO approaching and C–O
2−(lat) bond formation. Carboxylates have been found on pre-reduced ceria surfaces
[79], and naturally lead to carbonates (CO
32−) either by further interaction with surface oxygen or with gaseous O
2. Carboxylates can also serve as precursors of formate species when neighboring OH groups are present
(3′).
Figure 7. Calculated Gibbs energy diagram for the CO oxidation mechanism on a stoichiometric CeO2(111) surface covered with 2 OH groups at different experimental temperatures. The structures of the different reaction intermediates are depicted at the top of the diagram.
TS1 in
Figure 7 refers to the formation of formate from carboxylate, which according to our calculations, requires an activation energy of ca. 1 eV. This low activation energy for formate formation, is consistent with these species being observed by DRIFTS at temperatures as low as 60 °C. In fact, formates are very stable species with relative Gibbs energies of −1.56, −2.22 and −3.02 eV at 350 °C when surrounded by one, two or three OH groups, respectively. Even at high OH coverages, formates are significantly stabilized as their evolution towards CO(ads) + *OH is very energy demanding, as recently showed in our mechanistic study of the CO
2 methanation reaction on ceria
[80]. Hence, we predict formates to accumulate on ceria for a broad temperature window, as observed by DRIFTS. Even without H
2 in the reactant stream (CO-TOX conditions), formates are detected experimentally during CO oxidation around the same temperatures than in CO-PROX conditions.
Calculations also predict that carboxylates do not form on the clean CeO
2(111) surface, but they can be generated in the presence of a V
O and OH groups, which are typically found in real ceria surfaces. Since formates evolution is hindered and independent of the OH coverage during CO oxidation, we conclude that these species are mere spectators. Alternatively, carboxylates can evolve as CO
2, leaving behind a surface V
O (
4). The generated CO
2 can then be readsorbed on a O
2− site to give rise to a carbonate
(4a’), a process that is exergonic by ca. 0.2 eV at room temperature. In contrast to the clean surface, carbonate formation competes with CO
2 desorption
(5). However, since OH groups tend to stabilize carbonates on the surface , the presence of a new OH group is expected to favor the presence of carbonates over CO
2 desorption. This situation is reversed at 200 °C and higher temperatures, and CO
2 desorption prevails regardless of the coverage. While on the surface, carbonates can also be hydrogenated to bicarbonates via H transfer from the coverage
(4b’), which are less stable. As previously discussed by some of us and others
[30][31][30,31], a higher bicarbonates-to-carbonates ratio enhances the CO-PROX activity in CuO/CeO
2 catalysts. Furthermore, the depletion of the hydroxyl band correlates with the bicarbonate formation rate. However, according to our DFT calculations, this process has associated a TS with an energy barrier of 0.87 eV (TS3) at room temperature, and therefore, is likely to be able to compete with CO
2 desorption. When comparing the calculated barriers at higher OH coverages, we observe that bicarbonate formation is slightly facilitated. Altogether, the bicarbonate route does not seem to be feasible on the (111) surface based on the calculated reaction thermodynamics and kinetics. In fact, this would not be a limiting step in metal-free ceria catalysts since much higher temperatures are needed to overcome the CO oxidation onset. However, as depicted by the energies of CO
x + OH adsorbates, the (100) surface is the most prone to accumulate carbonates as these species are remarkably stabilized. Hence, in this minor facet, we envision that bicarbonates may have a key role in the CO-PROX catalysis at low temperatures.
Regardless of the reaction pathway, CO
x is released as CO
2 to the gas phase, followed by the regeneration of the V
O by a gas O
2 molecule
(6). To shed light into this process, we investigated all the possible reaction pathways. Firstly, we considered an additional CO adsorbed on a surface still containing the carbonate and the V
O, while leaving the O
2 uptake to the end of the CO oxidation cycles. This reaction pathway was found to be higher in energy all along the reaction cycle since O
2 stabilizes the reaction intermediates. Secondly, we explored the V
O restoration by O
2 whilst maintaining on surface the carbonate, which is a dead-end unless the carbonate releases the active site since CO(g) and O
22− do not interact in these conditions. Thus, the mechanism proposed in
Figure 7 is the lowest energy pathway encountered. The second CO molecule finds a free O
2− site after CO
2 desorption. Instead of forming a carboxylate, we found that a O–O–COO intermediate is stabilized as a result of the CO–O
22– interaction
(8). This intermediate has an elongated O–O bond at 1.497 Å, indicative of the O
22− dissociation degree, while the C–O bond distance is 1.436 Å and the lattice O is displaced upwards from its ground position. Subsequently, this structure leads to a bidentate carbonate and a surface oxygen
(9) via the rearrangement of the surface and the O–O bond cleavage. The desorption of the resulting carbonate regenerates the initial state of the catalyst.
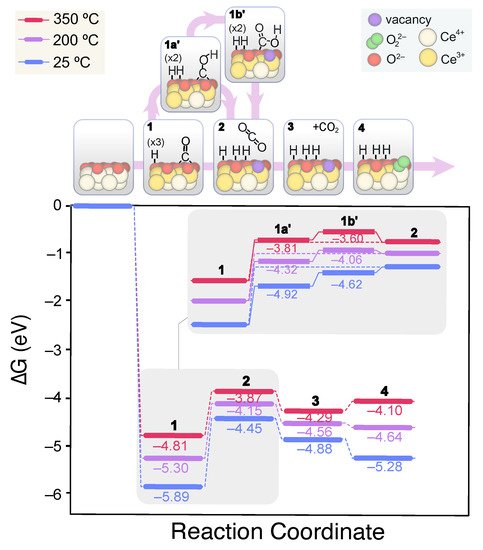
Unlike the (111) surface, CO adsorption on the (110) facet leads to highly stable bidentate carbonates in presence or absence of OH groups. Importantly, CO adsorption involves the reduction of two surface Ce
4+ cations and the oxidation of C. Nevertheless, for catalytic CO oxidation, the product must be desorbed and the active site regenerated. The carbonates desorption to CO
2 involves an up-hill process of 2.32 eV, whereas their protonation to less stable bicarbonates goes through a high energy TS of 3.7 eV. On the (110) surface, two types of bicarbonates can be formed, labeled herein as type A and B. The former are bound in a bidentate fashion and are more stable than the B-type by ca. –0.3 eV (see
Figure 5b). The formation of type B bicarbonates from carbonates is more hampered due to the lower accessibility of the O being protonated. However, the evolution of type A bicarbonates to CO
2 + OH involves more rearrangement and thus higher energies due to the greater distance of H
+ to the surface. Hence, we propose that type A bicarbonates evolve to the B type through a low energy (i.e., 1.25 eV) H migration, from which CO
2 can be released more easily. These insights are depicted in
Figure 8, which displays the obtained lower energy CO oxidation mechanism computed for the 3 OH-covered surface. As in the case of CeO
2(111), with the OH coverage, the lesser the barrier energies for the overall CO oxidation process, though this cannot be attributed to the more facile bicarbonates formation.
Figure 8. Calculated Gibbs energy diagram for the CO oxidation mechanism on a stoichiometric CeO2(110) surface covered with 3 OH groups at different experimental temperatures. The structures of the different reaction intermediates are depicted at the top of the diagram.
Despite being the least stable surface, the (100) facet might also contribute to the CO oxidation process in polycrystalline ceria catalysts. According to our calculations, CO adsorption on (100) is weak, as in the case of (111), and CO oxidation proceeds via a similar reaction mechanism. However, the (100) surface is less dense, and its more open structure is able to stabilize multidentate carbonates whose desorption is strongly hampered. Thus, the (100) surface may reabsorb and retain the released CO2 either through this or other catalytically active surfaces, increasing the accumulation of product-type adsorbates and leading to surface poisoning. In this case, the protonation of multidentate carbonates to bidentate bicarbonates is pivotal to boost CO2 release, a process that is computed to be endergonic by ca. 1.90 eV. Given that this energy input is important, the greater abundance of the (100) facet on ceria crystals can be tentatively related to a poorer overall CO oxidation activity.
