The Current Green Economy Situations in European Union: Comparison
Please note this is a comparison between Version 2 by Nora Tang and Version 1 by Ireneusz Miciuła.

Energy is undoubtedly one of the fundamental factors in the development of economies around the world. This is particularly evident during crises related to the reduction of supplies or the lack of energy sources. For example, the oil crisis of the 1970s of the twentieth century showed the problem of energy security, which has returned today and is one of the important topics of discussion in the European Union (EU) countries. Changes in the situation of the energy markets and geopolitical conditions show that the problem of energy security is fundamental for the functioning of modern economies. It directly influences economic development and other strategic areas, including the Lisbon Strategy for Growth and Jobs and the Millennium Development Goals.

  • energy and climate policy
  • state security
  • economic efficiency
  • European Union
  • sustainable development
  • green economy
  • renewable energy sources (RES)
  • energy sources

1. Introduction

Coal consumption in virtually all systems and categories increased very dynamically in the first 15 years of the 21st century, in a global, continental and geopolitical systems. Coal consumption was limited only by those countries of the Europe that had exhausted most of their resources, i.e., Belgium, France, Great Britain, or in the case of hard coal only—Germany. The world has been developing energetically at a fast and stable pace for over half a century. Overall, energy consumption has increased since 1965 from 3750 to 12,685 million toe in 2012. According to the forecast for the global energy market, the energy efficiency of all global installations is to increase from 5640 gigawatts (GW) in 2012 to 9266 GW in 2030. Over the same period, electricity production is expected to increase from 22,441 terawatt hours (TWh) to 34,458 TWh [36][1]. The biggest difference is the consumption of coal, which in Europe is decreasing; worldwide, it is growing, with the fastest growth occurring in the 21st century [37][2]. While in 2000 the whole world consumed a total of 2350 million tons of coal converted as oil equivalent (toe), in 2012 it was already 3910 million toe, which means nearly a 70% increase over 12 years [38][3]. The most spectacular growth took place in China, where coal consumption increased by more than 200 percent in 12 years. At the current level of extraction, the documented reserves of domestic coal will suffice the Chinese for half a century. Other Asian tigers, such as India and Indonesia, are recording similar increases in consumption.

2. The Energy Industry

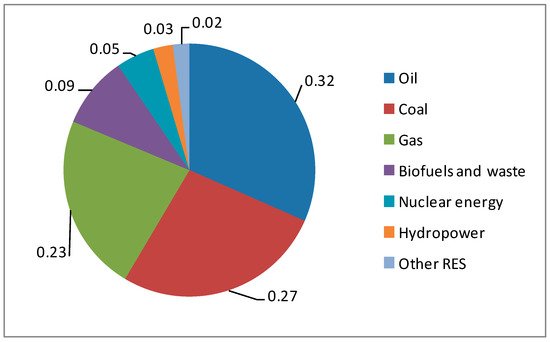
With regard to the energy industry, different trends can be noticed between the European market and the world [39][4]. While gas energy will record growth in both markets, the potential of coal energy will be characterized by a significant increase globally, and by a decrease in Europe. The share of coal-based energy will decline in different regions of the world for different reasons—in North America, due to the possibility of extracting rich shale gas deposits, and in Europe after 2020, as a result the entry into force of new legislation on emission levels. This also results from the exhaustion of hard coal resources in some developed countries of Western Europe. Power generation levels from all three of the main fuels are expected to be higher and, in addition, projections indicate that coal will become the dominant fuel. Currently, it constitutes almost 30% of the power of existing installations, and in 2030 it may reach the level of approximately 35% of the amount of energy produced and globally will again become the main energy resource [40][5]. Gas is also expected to catch up quickly and gain even more importance. The current level of use of various energy sources is shown in Figure 1.
Figure 1. Energy from various sources in the world in 2018 (in terms of percentage) [41][6].
Looking at information from modern media, it seems that renewable energy sources produce a large amount of energy. However, this is only an impression created by the lobby of Western European countries, for which there is no other option but to invest in this type of energy source. The statistics of quantitative data on the consumption of primary energy sources in the 21st century indicate a completely different reality. Indeed, we can see that non-renewable energy sources such as oil, natural gas and coal still dominate. The percentage breakdown of energy use is currently stagnating due to the emergence of more alternatives and market saturation. Forecasts until 2030 show that oil will play a smaller role in the basket of energy sources, and, temporarily, coal will again become dominant in the world. From the perspective of 2050, gas will also be of great importance. Coal is the most dynamically developing energy source in the 21st century, followed by gas. By analyzing the situation of energy sources since 2000, it is possible to determine the percentage dynamics of the increase in the consumption of individual raw materials, which result from changes counted in million toe. Overall, energy consumption increased by 35.7%, and the increase in individual energy commodities was as follows [42][7]:
  • 70.2% coal;
  • 51.4% natural gas;
  • 19.5% hydropower;
  • 16.8% crude oil;
  • 6.3% nuclear energy.
The upturn in coal is the result of the need to provide energy for the rapid economic development of China and other Asian countries, as well as the increase in production in most countries of the world. In the case of gas, it results from the need for more clean and flexible production systems and from the increase in the level of global production. In North America, this happened due to the discovery of rich shale gas deposits. At the same time, the forecasts indicate the rapid development of gas energy in China and the Middle East. Additionally, the European Union, where voices about “impurity” of coal are the loudest, in statistical terms has increased its consumption since 2010, and these values have returned to the level from the beginning of the 21st century, despite the “clean” policy and resource depletion in some EU countries [43][8]. This shows the ineffectiveness of the EU’s actions or the irrationality of the adopted policy, which was adopted for other hidden goals of the main states that determine its shape.
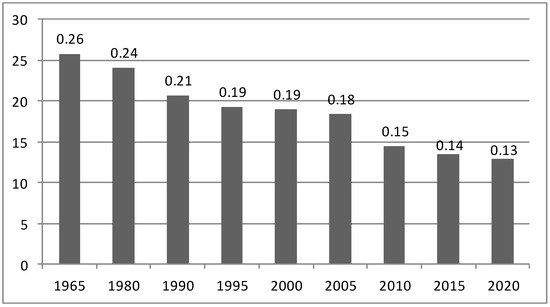
Analyzing the share of energy consumption by Europe in the global balance, one can see a sharp decline in the share of EU countries in world consumption, from 26% in 1965 to less than 13% in 2018 [44][9]. The economies of the rich countries of Western Europe are saturated, and the countries of Central and Eastern Europe are not making up for backlog at the same pace as the developing countries of the world, especially Asia. In addition, there was a pandemic crisis and we are now dealing with stagnation in the economies of the EU Member States. Figure 2 shows the declining share of Europe in global energy consumption.
Figure 2. Europe’s share of global energy consumption (in %) [41,42][6][7].
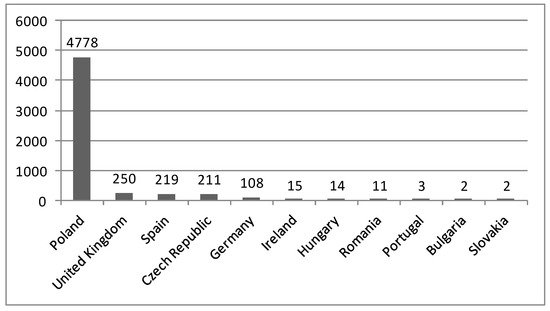
Europe is an ever-smaller player in the global energy market. This is also visible in the analysis of the share in the global use of the three main energy sources that best indicate energy trends in Europe. The percentage of crude oil consumption decreased from 29% in the 1970s to 14% in 2018 [41][6]. The share of gas, after a sharp increase until the early 1980s, when it was 19%, had a long period of stability, only to drop to 12% in 2018 after 2005. However, the largest decrease was recorded by coal, as in 1965 Europe consumed 36% global balance sheet and in 2018 less than 8% [42][7]. This is a persistent trend that shows the need for energy consumption in other, rapidly developing regions of the world, as well as stagnant economies and energy problems in EU countries. When analyzing hard coal resources in the EU countries, it can be said that the era of hard coal mining in the absence of the discovery of new deposits naturally ended as a result of resource depletion. Poland should only be omitted, which currently has approximately 85% of all hard coal resources among the European Union countries (Figure 3).
Figure 3. Hard coal resources in EU countries in 2018 (million tonnes) [45][10].

3. The Strategy of Energy Policy

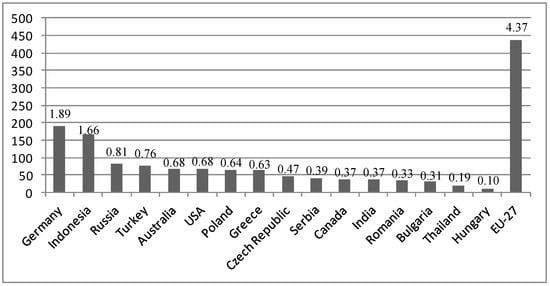
The strategy of energy policy in the global and EU context must be based on comprehensive detailed analyzes. For example, conclusions for the coal industry should be drawn from the analysis of all types of coal currently available because often in the literature on the subject you can find analyses based solely on hard coal resources, which may cause wrong strategic decisions in the energy policy (hard coal contains 75–97% carbon element and a calorific value between 17 and 30 MJ/kg. For comparison, the calorific value of pure carbon is approximately 33.2 MJ/kg). The best examples are the EU Member States, where the energy and climate policy, at least in theory confirmed by EU legal acts, aims to limit coal as an energy resource due to excessive carbon dioxide emissions. On the other hand, practice, i.e., statistical data, shows something completely different, and despite the exhaustion of hard coal resources, coal consumption continues to increase. In addition, forecasts indicate that, as in the world, also in EU countries, coal consumption will grow, despite the policy of limiting so-called “Dirty” energy, i.e., energy that emits a significant number of greenhouse gases [46][11]. Germany is an excellent example of this issue. The country that is most responsible for the direction of the contemporary EU climate and energy policy, due to the influence of the Green party, is at the same time the largest coal producer in Europe, and in terms of lignite mining (lignite has a carbon content of 62–75% and a calorific value between 7.5 and 21 MJ/kg, but, for example, drying the raw coal can bring this value up to 29 MJ/kg) is the largest in the world (Figure 4). Additionally, investments in the construction of another six lignite mines has commenced, which will further strengthen Germany as a world leader [47][12]. Therefore, in the coming years, lignite mining in Germany will exceed 200 million tons per year.
Figure 4. Lignite mining in the world in 2018 (million tons) [47][12].
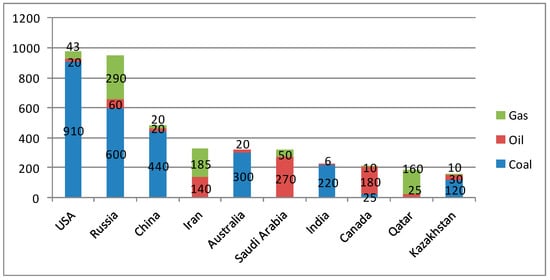
Therefore, action strategies in the EU countries should be developed taking into account the investments carried out in practice, including in Germany, which differ from the arrangements for energy policy. In addition, Germany, which in terms of value has the largest share of carbon dioxide emissions among EU countries, generates almost 50% of electricity from coal, including over 30% from less efficient lignite [47][12]. For the economy, this will act as compensation for the high costs of green energy and ensure the security of electricity supply in the event of fluctuations in RES production [48][13]. Therefore, a rational energy policy has been implemented, which is contrary to the decisions of the EU. Problems in the EU energy and climate policy result from contradictory goals and failure to adhere to the developed policy and the lack of rich deposits of the main energy sources. Figure 5 shows the top 10 richest countries in the world with the three main energy resources.
Figure 5. The ten richest countries in the world in energy resources (billion toe) [48,49][13][14].
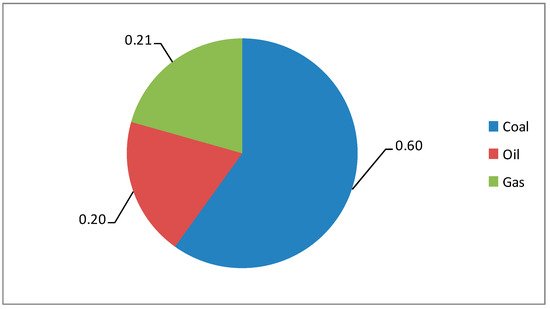
Global data leave no doubt that, according to the forecasts in the 21st century, coal will again become the first energy resource in the world. This tendency is confirmed by the world’s carbon resources, which are globally evenly distributed and constitute 60% of the basket of the three main energy sources of the modern world (Figure 6).
Figure 6. World resources of the three main energy raw materials (in terms of percentage) [41][6].
The current geopolitical situation requires the implementation of fundamental investments in energy infrastructure (for example, the Nabucco project) in order to diversify the directions of supplies and the possibility of selecting energy sources on a market basis [50][15]. This has a direct impact on the strategic aspects of the security of energy supplies for national economies. The significance of these investments is confirmed by quantitative data indicating the current dependence of EU countries on Russia, which undoubtedly results in a lack of security and competitiveness (Table 21) [41][6] and constitutes an element of direct political and economic pressure.
Table 21. The dependence of individual EU Member States on gas imports from Russia [41].
 The dependence of individual EU Member States on gas imports from Russia [6].
CountryGas Imports from Russia (Billion m3)
[22]. Due to insufficient supply in Europe and higher prices, the practical consequence of these regulations is the import of biomass from outside the EU, e.g., from Africa, Asia and South America, which negates the benefits associated with reducing emissions [58][23]. Green policies and investments in RES lead to many unexpected paradoxes, namely:
  • Increasing “dirty” energy. An example is German suppliers who, in order to offset the costs of RES, buy the cheapest, and therefore the dirtiest, lignite-based electricity. In addition, taking into account efficiency, lignite is already used to generate 30% of energy in Germany, and new units are being built to ensure a constant source of electricity in the event of fluctuations in production from RES. This is called the “energy transformation paradox”—despite the increase in the share of RES in energy consumption, CO2 emissions are growing [59][24]:
  • Expensive energy—RES technologies will be expensive for a long time to come. In Germany, as a result of the largest investments in green energy, the price of electricity is the highest in Europe, and statistics show that over 300,000 households are disconnected from the grid for unpaid bills. This phenomenon is known as “energy poverty”.
  • The long-term carbon footprint, which is greater for some green technologies than for the dirty old ones. For example, electric cars are extremely harmful to the environment due to the huge number of installed batteries.
  • The EU regulations consider the electricity generated from the co-combustion of coal with biomass (mainly wood) to be clean. The energy industry has received a good deal, so wood from other parts of the world is flowing into Europe at a great rate, so much so that new sawmills are being built in North America to export to Europe.
  • The countries that are the world leaders in producing energy from coal invest the most in green technologies.
Dependence on Imported Natural Gas from Russia
Share in ConsumptionImport Share
Lithuania3.72100.0%100%
Slovakia6.22100.0%99.20%
Estonia0.85100.0%100%
Finland4.5899.9%100%
Latvia1.6496.5%100%
Czech Republic6.878.9%78.80%
Bulgaria2.878.6%100%
Greece3.1677.6%77%
Austria5.464.0%55.90%
Hungary7.8558.8%75.10%
Slovenia0.5958.0%58.20%
Poland6.8641.8%67.70%
Germany38.339.3%43.30%
Romania4.528.2%86%
Italy22.626.7%30.70%
France5.713.4%13.30%
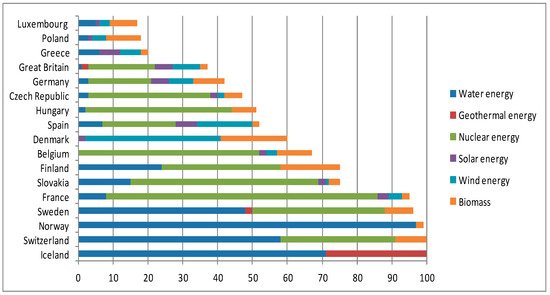
Due to the dependence of European countries on external supplies, the current energy strategy is aimed at gaining access to the entire energy market thanks to infrastructure investments and greater use of own resources thanks to technological innovations. Figure 7 shows the current share of low-emission energy sources in electricity production in selected European Union countries.
Figure 7. Share of low-emission sources in electricity production in 2018 (in terms of percentage) [51,52][16][17].

4. Limitations in the Use of Low-Carbon Energy Sources
Analyzing the above data, we see large limitations in the use of low-carbon energy sources. Some countries in Europe already have a structure of energy sources in line with the EU ideal, while we have very high values for the use of renewable energy. For example, these are: Iceland, where 100% is hydro and geothermal energy, Norway, where 95% of the needs are met by hydropower; Switzerland, where 60% is hydropower and 35% nuclear; and Sweden, where 50% is hydro and 40% nuclear [51][16]. Austria also has high values of renewable energy use thanks to 62% share of hydropower; Finland, thanks to a 25% share of hydropower and 35% of nuclear energy; and France, which satisfies as much as 80% of the needs from nuclear energy [52][17]. However, these countries achieved shares of low-carbon energy based on natural geographic conditions and already had them before the EU targets for the share of RES in the energy mix. This analysis shows that natural geographic conditions, such as large water bodies and topography, naturally allowed some EU countries to achieve this structure of the energy mix. On the other hand, further percentages in this structure are due to investing in nuclear energy [53][18].
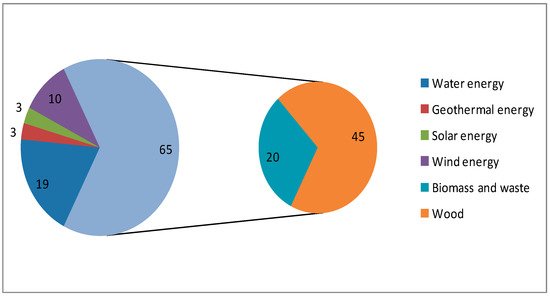
On the other hand, it should be noted that there are countries that have made significant progress in achieving greater importance of renewable sources in the energy mix. The countries such as Portugal (17% change), Denmark (15% change), Spain (11% change) and Ireland (10% change) achieved the most significant changes after establishing the EU strategy for the objectives of low-carbon energy sources [52][17]. However, when undertaking a detailed analysis of the changes, we will see that all these countries owe these changes thanks to the wind energy that was already present in their energy mixes. Therefore, we can see that it was natural conditions that decided about the possibility of increasing this share, and there was only a shortage of funds for these investments. An interesting example is Germany, which, despite huge investments in renewable energy, increased its share of low-carbon energy only from 38% to 42%, because it also partially gave up nuclear energy [51][16]. Therefore, other countries that will not have adequate natural opportunities and lack investments in nuclear energy will have a similar share of RES as Greece, Poland and Luxembourg [54][19]. As a result, some countries are particularly disadvantaged in terms of the need to implement the EU climate package. Figure 8 shows the percentage of renewable energy sources in the EU-27.
Figure 8. RES consumption for the EU-27 in 2019 (in terms of percentage) [55][20].
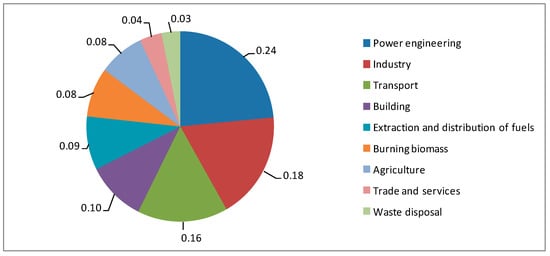
The above data confirm the limited applicability of RES; 65% of the mix is wood (45%) and other biomass and waste (20%). Hydropower has a significant share (19%) and the use of wind energy is increasing (10%) [55][20]. Global promotion for the complete conversion to the use of renewable energy in the current state of technology is unjustified. Practice proves that there is no logical justification for using renewable energy sources where it is not profitable. In addition, with some RES, there may be problems with meeting energy demand due to changing weather conditions. Additionally, paradoxically, the analyses show that it is also not significantly beneficial for climate protection. There are several reasons for this, including that biomass combustion and deforestation constitute 10% of greenhouse gas emissions. The global emission of 30 billion tons of CO2 annually gives 4.5 tons of CO2 per person [41][6]. A tree absorbs about 5 kg of CO2 per year on average [42][7]. These calculations show that it takes up to a thousand trees to cut emissions per person. Undoubtedly, forests are an indispensable factor of ecological balance and the neutralization of pollutants. Therefore, the protection of forests is an indispensable condition for limiting environmental degradation. The current EU regulations cause additional transport of biomass, which increases CO2 emissions. According to the data of the Intergovernmental Panel on Climate Change (IPCC), the main reasons for the decrease in oxygen concentration in the atmosphere and increase in CO2 concentration outside energy and industrial processes are followed by transport, burning biomass and deforestation [47][12], which is confirmed by Figure 9.
Figure 9. Sources of greenhouse gas emissions by sectors of the economy in 2019 [56][21].
When analyzing in detail the data on achieving the target of using 20% RES in EU countries, it should be stated that it is associated with high costs and leads to many unfavorable phenomena. Additionally, these changes are primarily unstable. The desire to reduce CO2 emissions resulted in the co-financing of energy crops, which often was not profitable without subsidies, and at the same time they were used as an additive to co-combustion with fossil fuels in power plants. In practice, the CO2 balance is much less favorable than it may appear from calculations, due to emissions during production (e.g., processing into pellets) and transport of biomass [57]
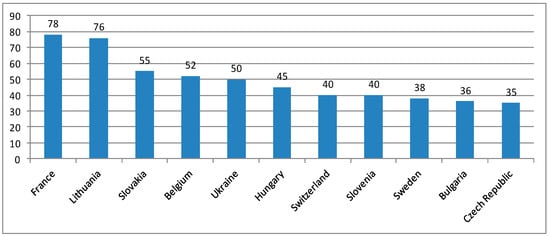
The above-mentioned arguments, as well as the need to ensure the security of energy supplies for the economy, meant that the “3 × 20” plan will not be implemented so rigorously [32][25]—certainly not in the short term, until 2030. Additionally, plans such as reducing energy consumption by 20% may turn out to be a pipe dream even in the time horizon up to 2050. Demand is certainly growing, and energy efficiency does not provide the ambitious results envisaged in the EU plans. Commissioner Oettinger said that European industry must have cheap energy to be competitive. RES are costly, unstable and require large initial investments in energy systems. Therefore, while reducing or depleting coal resources, many EU countries must to develop nuclear energy, which is already the dominant source in several countries, as shown in Figure 10.
Figure 10. Share of nuclear energy in electricity production in 2018 (in terms of percentage) [47][12].
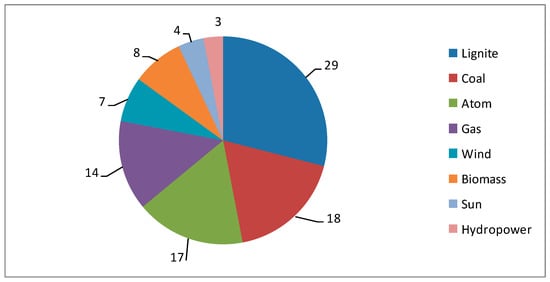
Everything points to Germany’s return to nuclear energy, which was to be abandoned by 2022, because with the development of renewable energy, the gas energy market is growing because electricity from wind and sun is not produced in a continuous and stable manner; therefore, gas-fired power plants that can be quickly turned on and off are necessary [60][26]. In Germany, the wind blows on average only 20% of the time, so the construction of windmills is really the construction of gas power plants and more efficient use of the Nordstream, and therefore greater dependence on Russian supplies. The construction of further coal-fired power plants will result in over 50% share of coal in the energy mix for electricity production, the structure of which is shown in Figure 11.
Figure 11. Electricity production by source in Germany in 2019 (in terms of percentage) [61][27].
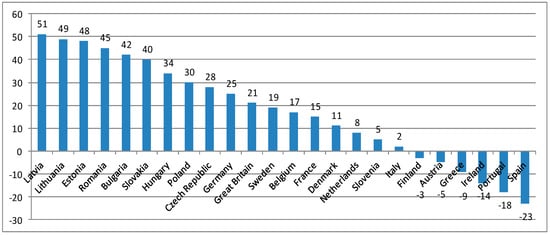
EU policy in relation to coal and nuclear energy is not clear because the European Union did not adopt specific values to be achieved for certain Member States. The instruments of energy and climate policy (taxes, trading in CO2 emissions) have a negative impact on the competitiveness of obtaining energy from these sources [41][6]. By contrast, the costly subsidy of renewable energy consumes billions of subsidies that are making EU countries indebted. High prices of electricity from RES burden end consumers and directly reduce the competitiveness of EU economies [52][17]. This is confirmed by current events on the world stage and the statements of EU heads of government. Consequently, a return to traditional energy sources is forecast and Europe is projected to continue to depend on external supplies, especially as climate charges are reduced. Figure 12 shows the implementation status of greenhouse gas reduction plans by 2030 for individual EU Member States.
Figure 12. Implementation of greenhouse gas reduction commitments by 2030. Implementation status in 2018 (in terms of percentage) [41,52][6][17].
It is surprising that the countries of Central and Eastern Europe have the highest level of fulfillment of greenhouse gas reduction commitments [62][28]. The main reasons for this are the economic crisis, the loss of available coal as an energy source and the shift to low-carbon sources. Germany owes 25% of its commitments to the implementation of the largest investments thanks to subsidies from the EU [63][29], and the United Kingdom has simply moved part of its carbon production abroad. However, this is only a reduction in emissions within the country; globally, nothing is decreasing, and it makes the UK dependent on supplies. In contrast, despite large investments in wind power, countries such as Spain, Portugal and Ireland have high emission-increasing values. This is due to the significant increase in energy demand, and the main source of meeting these needs is gas. Countries such as Greece, Austria and Finland, due to the economic crisis, currently use the cheapest source of energy, which is coal. In practice, the European Union itself loosened the climate policy by postponing the defined goals to be achieved by 20 years, until 2050. Because the EU decision-makers realized that these values would not be achieved, due to the need to ensure, in the first place, the security of energy supplies for economies and, furthermore, to support their competitiveness.
References

1. European Union Legal Assets Database. Available online: http://europa.eu/legislation_summaries/energy/index_en.htm (accessed

on 18 May 2021).

2. Horodziejczyk, D. New Energy Policy of the European Union. BAS Studies of the Chancellery of the Sejm; No. 12, Selected Social and Economic Issues; Energy Policy Institute: Warsaw, Poland, 2008.

3. Communication from the Commission to the European Council and the European Parliament, European Energy Policy; COM (2007) 1; European Commission: Brussels, Belgium, 2007.

4. European Commission. European Energy and Transport Trends to 2030—Update 2007; Publications Office of the European Union: Brussels, Belgium, 2008.

5. Buchan, D. Energy and Climate Change: Europe at The Crossroads; Oxford University Press for the Oxford Institute for Energy Studies: New York, NY, USA, 2009.

6. Leveque, F.; Glachant, J.M.; Barquin, J.; Holz, F.; Nuttall, W. Security of Energy Supply in Europe Natural Gas, Nuclear and Hydrogen;

Loyola de Palacio Series on European Energy Policy; Edward Elgar Pubilshing Limited: Cheltenham, UK, 2014.

7. Tatarzyński, M. Energy Policy of the European Union; National Security: Warsaw, Poland, 2007.

8. Maśloch, P.; Miciuła, I.; Wojtaszek, H. European Union Climate and Energy Policy Based on an Analysis of Issued Legal Acts. In Proceedings of the 5th International Conference on European Integration 2020, Ostrava, Czech Republic, 3–4 December 2020; Staníčková, M., Melecký, L., Doleželová, P., Powadová, T., Eds.; VŠB Technical University of Ostrava: Ostrava, Czechy, 2020; pp. 600–609.

9. Dannreuther, R.; Ostrowski, W. Global Resources—Conflict and Cooperation; Palgrave MacMillan: Hampshire, UK, 2013.
10. Nematchoua, M.K.; Asadi, S.; Reiter, S. Influence of energy mix on the life cycle of an eco-neighborhood, a case study of 150 countries. Renew. Energy 2020, 162, 81–97.

11. Chateau, B.; Rossetti di Valdalbero, D. World and European Energy and Environment Transition Outlook; European Commission: Brussels, Belgium, 2011.

12. Miciuła, I.; Stępień, P. Analysis of the Global Market of Energy Resources. In Eurasian Economic Perspectives. Eurasian Studies in

Business and Economics; Bilgin, M., Danis, H., Demir, E., Can, U., Eds.; Springer: Cham, Germany, 2019; Volume 10/2; https://doi.org/10.1007/978-3-030-11833-4_6.

13. CVCE EU. Available online: http://www.cvce.eu/obj/en-11a21305-941e-49d7-a171-ed5be548cd58 (accessed on 12 June 2021).

14. Hambura, S.; Muszyński, M. Treaties on the European Union; C.H.BECK Hart: Berlin, Germany, 2005.

15. Chick, M. Electricity and Energy Policy in Britain, France and the United States since 1945; Edward Elgar: Cheltenham, UK;

Northampton, MA, USA, 2007.

16. Euracoal. Available online: http://www.euracoal.be/ (accessed on 18 December 2020).

17. White Paper. An Energy Policy for the European Union; COM(1995) 682 Final; European Commission: Brussels, Belgium, 1995.

18. European Commission. Green Paper. 2030 Climate and Energy Policy Framework; COM (2013), 169 Final; European Commission: Brussels, Belgium, 2013.

19. Glachant, J.M.; Leveque, F. Electricity Reform in Europe towards a Single Energy Marke; Loyola de Palacio Series on European Energy Policy; Edward Elgar Pubilshing Limited: Cheltenham, UK, 2014.

20. European Commission. Available online: http://europa.eu/legislation_summaries/energy/index_pl.htm (accessed on 30 April 2020).

21. European Commission. European Energy and Transport Trends to 2030—Update 2009; EC: Brussels, Belgium, 2010.

22. Miciuła, I. Energy mix as the basic regularity of the principles of sustainable development. Econ. Sci. Rural. Dev. 2019, 52, 370–378.

23. Chevalier, J.M. The New Energy Crisis—Climate, Economics and Geopolitics; MacMillan: New York, NY, USA, 2009.

24. Energy for the future: Renewable sources of energy. In Green Paper for a Community Strategy; 20.11.1996. COM. (96) 576 Final; European Commission: Brussels, Belgium, 1996.

25. European Commission. White Paper for a Community Strategy; COM (97) 599 Final; European Commission: Brussels, Belgium, 1997.

26. Oettinger, G. UE Proposes Tough Energy Efficiency Package. Business Green, 8 March 2011.

27. Barcz, J. European Union Law. System Issues; PWN: Warsaw, Poland, 2006.

28. European Union Law (1992, Last Update 21.03.2018). Treaty of Maastricht on European Union. 2018. Available online:

http://europa.eu/legislation_summaries/institutional_affairs/treaties_maastricht_en.htm (accessed on 11 May 2021).

29. Miciuła, I.; Miciuła, K. Renewable Energy and Its Financial Aspects as an Element of the Sustainable Development of Poland; Scientific Papers of Wrocław University of Economics No. 330; Wrocław University of Economics: Wrocław, Poland, 2014; pp. 239-247.

30. Powers, L.W. The World Energy Dilemma; PennWell: Nashville, TN, USA, 2012.

31. Glachant, J.M.; Finon, D.; Hauteclocque, A. Competition, Contracts and Electricity Markets—A New Perspective; Firenze: Loyola de Palacio Series on European Energy Policy; Edward Elgar Pubilshing Limited: Cheltenham, UK, 2014.

32. Miciuła, I.; Stępień, P. The Impact of Current EU Climate and Energy Policies on the Economy of Poland. Pol. J. Environ. Stud. 2019, 28, 2273–2280, https://doi.org/10.15244/pjoes/90784.

33. The Economist. The Fuel of the Future: Environmental Lunacy in Europe. Available online:

http://www.economist.com/news/business/21575771-environmental-lunacy-europe-fuel-future (accessed on 10 September 2021).

34. Fazioli, R.; Pantaleone, F. Macroeconomic Factors Influencing Public Policy Strategies for Blue and Green Hydrogen. Energies 2021, 14, 7938, https://doi.org/10.3390/en14237938.

35. European Commission. Communication from the Commission to the European Parliament, the Council, the European Economic and Social Committee and the Committee of the Regions: A hydrogen strategy for a climate-neutral Europe. In Global CCS Institute: Global Status of CCS 2020; European Commission: Brussels, Belgium, 2020.

36. Thaler, H. Forecasts for the Global Energy Market; Frost & Sullivan: London, UK, 2014.

37. Pach-Gurgul, A. The energy-climate package and realisation of its objectives within the context of the sustainable development of the European Union. Cent. Eur. Rev. Econ. Financ. 2015, 10, 75–90.

38. Dyer, H.; Trombetta, M.J. International Handbook of Energy Security; Edward Elgar: Cheltenham, UK, 2013.

39. Späth, P.; Rohracher, H. ‘Energy regions’: The transformative power of regional discourses on socio-technical futures. Res. Policy 2010, 39, 449–458.

40. Vavrek, R.; Chovancova, J. Assessment of economic and environmental energy performance of EU countries using CV-TOPSIS technique. Ecol. Indic. 2019, 106, 105519.

41. International Energy Agency, Key World Energy Statistics 2020. Available online:

http://www.iea.org/publications/freepublications/publication/ (accessed on 22 July 2021).

42. BP Statistical Review of World Energy. Available online:

https://www.bp.com/en/global/corporate/energy-economics/statistical-review-of-world-energy.html (accessed on 14 September 2021).

43. Balitskiy, S.; Bilan, Y.; Strielkowski, W. Energy Security and Economic Growth in the European Union. J. Secur. Sustain. Issues 2014, 4, 123–130.
44. Stępień, P.; Miciuła, I. Liberalization of the Polish energy market and the EU commitments. Czech J. Soc. Sci. Bus. Econ. 2016, 5, 25.

45. Eurostat. Available online: http://ec.europa.eu/energy/statistics (accessed on 10 September 2021).

46. Moran, D.; Russell, J. Energy Security and Global Politics, Routledge Global Security Studies; Taylor & Francis Group: London, UK; New York, NY, USA, 2009.

47. Energy Information Administration. International Energy Annual; Energy Information Administration: Washington, DC, USA, 2020.

48. NaftaGaz Analysis Center. Available online: NaftaGaz.pl (accessed on 12 September 2021).

49. International Atomic Energy Agency. Available online: http://www.iaea.org (accessed on 22 September 2021).

50. Salata, F.; Ciancio, V.; Dell’Olmo, J.; Golasi, I.; Palusci, O. Effects of local conditions on the multi-variable and multi-objective

energy optimization of residential buildings using genetic algorithms. Appl. Energy 2020, 260, 114289.

51. Murphy, A.; Abramowitz, U.S. Energy Information Administration, Independent Statistics & Analysis. Available online:

http://www.eia.gov/todayinenergy/detail.cfm?id=18071 (accessed on 3 September 2021).

52. Enerdata. Global Energy Statistical Yearbook 2020. Available online: https://yearbook.enerdata.net/ (accessed on 3 September 2021).

53. Derdevet, M. L’Europe en Panne D’energie; Descartes & Cie: Paris, France, 2009.

54. Maśloch, P.; Maśloch, G.; Kuźmiński, Ł.; Wojtaszek, H.; Miciuła, I. Autonomous energy regions as a proposed choice of selecting selected EU regions—Aspects of their creation and management. Energies 2020, 13, 6444.

55. Eurostat. Available online: http://ec.europa.eu/eurostat/web/energy/statistics-illustrated (accessed on 20 July 2021).

56. Global Warming. Available online: http://www.globalwarming.org.in (accessed on 1 September 2021).

57. Molino, A.; Mehariya, S.; Karatza, D.; Chianese, S.; Iovine, A.; Casella, P.; Marino, T.; Musmarra, D. Bench-Scale Cultivation of Microalgae Scenedesmus almeriensis for CO2 Capture and Lutein Production. Energies 2019, 12, 2806.

58. Magrini, A.; Lentini, G.; Cuman, S.; Bodrato, A.; Marenco, L. From nearly zero energy buildings (NZEB) to positive energy buildings (PEB): The next challenge—The most recent European trends with some notes on the energy analysis of a forerunner PEB example. Dev. Built Environ. 2020, 3, 100019.

59. Research Institute: Agora Energiewende. Available online: http://www.agora-energiewende.de/Paradox.pdf (accessed on 7

June 2021).

60. Lumbreras, M.; Garay, R. Energy & economic assessment of façade-integrated solar thermal systems combined with ultra-low

temperature district-heating. Renew. Energy 2020, 159, 1000–1014.

61. Bloomberg New Energy Finance; BDEW: Berlin, Germany, 2020.

62. Mann, D.; Yeung, C.; Habets, R.; Vroon, Z.; Buskens, P. Comparative Building Energy Simulation Study of Static and Thermochromically

Adaptive Energy-Efficient Glazing in Various Climate Regions. Energies 2020, 13, 2842.

63. Valdovinos-García, E.M.; Barajas-Fernández, J.; Olán-Acosta, M.Á.; Petriz-Prieto, M.A.; Guzmán-López, A.; Bravo-Sánchez,

M.G. Techno-Economic Study of CO2 Capture of a Thermoelectric Plant Using Microalgae (Chlorella vulgaris) for Production of Feedstock for Bioenergy. Energies 2020, 13, 413.

64. Cadoret, I.; Padovano, F. The political drivers of renewable energies policies. Energy Econ. 2016, 56, 261–269.
65. Global Economy, World Economy. 2021. Available online: https://www.theglobaleconomy.com/ (accessed on 15 November 2021).

66. Brodny, J.; Tutak, M.; Saki, S.A. Forecasting the Structure of Energy Production from Renewable Energy Sources and Biofuels in Poland. Energies 2020, 13, 2539.

67. Nicolli, F.; Vona, F. Heterogeneous policies, heterogeneous technologies: The case of renewable energy. Energy Econ. 2016, 56, 190–204.

68. Stavytskyy, A.; Kharlamova, G.; Giedraitis, V.; Šumskis, V. Estimating the interrelation between energy security and macroeconomic factors in European countries. J. Int. Stud. 2018, 11, 217–238.

69. Sánchez-Pantoja, N.; Vidal, R.; Pastor, M.C. EU-Funded Projects with Actual Implementation of Renewable Energies in Cities. Analysis of Their Concern for Aesthetic Impact. Energies 2021, 14, 1627, https://doi.org/10.3390/en14061627.

70. Luo, X.; Wang, J.; Dooner, M.; Clarke, J. Overview of current development in electrical energy storage technologies and the application potential in power system operation. Appl. Energy 2015, 137, 511–536.

71. Telenga-Kopyczyńska, J.; Jonek-Kowalska, I. Algorithm for Selecting Best Available Techniques in Polish Coking Plants Supporting Multi-Criteria Investment Decisions in European Environmental Conditions. Energies 2021, 14, 2631, https://doi.org/10.3390/en14092631.

72. Jansen, M.; Staffell, I.; Kitzing, L.; Quoilin, S.; Wiggelinkhuizen, E.; Bulder, B.; Riepin, I.; Müsgens, F. Offshore wind competitiveness in mature markets without subsidy. Nat. Energy 2020, 5, 614–622.

73. Lucchi, E.; Polo Lopez, C.S.; Franco, G. A conceptual framework on the integration of solar energy systems in heritage sites and buildings. IOP Conf. Ser. Mater. Sci. Eng. 2020, 949, 012113, http://dx.doi.org/10.1088/1757-899X/949/1/012113.

74. EU. Horizon 2020 Challenge 10. Secure, Clean and Efficient Energy: Work Programme 2018–2020; EU: Brussels, Belgium, 2018.

75. European Commission. Clean Energy for All Europeans; European Commission: Brussels, Belgium, 2019.

76. Available online: http://www.fruits-rouges.org/wp-content/uploads/Les-gazoducs-North-Stream-South-Stream-et-Nabucco1.jpg (accessed on 25 August 2021).
77. Miciuła, I.; Wojtaszek, H.; Bazan, M.; Janiczek, T.; Włodarczyk, B.; Kabus, J.; Kana, R. Management of the Energy Mix and Emissivity of Individual Economies in the European Union as a Challenge of the Modern World Climate. Energies 2020, 13, 5191, https://doi.org/10.3390/en13195191.

78. Ding, H.; Zhou, D.; Zhou, P. Optimal policy supports for renewable energy technology development: A dynamic programming model. Energy Econ. 2020, 92, 104765.

79. Noailly, J.; Smeets, R. Financing Energy Innovation: Internal Finance and the Direction of Technical Change. Environ. Resour. Econ. 2021,69, 1–25.

80. Safarzyńska, K.; Bergh, J.C.V.D. Financial stability at risk due to investing rapidly in renewable energy. Energy Policy, 2017, 108, 12–20.

References

  1. Thaler, H. Forecasts for the Global Energy Market; Frost & Sullivan: London, UK, 2014.
  2. Pach-Gurgul, A. The energy-climate package and realisation of its objectives within the context of the sustainable development of the European Union. Cent. Eur. Rev. Econ. Financ. 2015, 10, 75–90.
  3. Dyer, H.; Trombetta, M.J. International Handbook of Energy Security; Edward Elgar: Cheltenham, UK, 2013.
  4. Späth, P.; Rohracher, H. ‘Energy regions’: The transformative power of regional discourses on socio-technical futures. Res. Policy 2010, 39, 449–458.
  5. Vavrek, R.; Chovancova, J. Assessment of economic and environmental energy performance of EU countries using CV-TOPSIS technique. Ecol. Indic. 2019, 106, 105519.
  6. International Energy Agency, Key World Energy Statistics 2020. Available online: http://www.iea.org/publications/freepublications/publication/ (accessed on 22 July 2021).
  7. BP Statistical Review of World Energy. Available online: https://www.bp.com/en/global/corporate/energy-economics/statistical-review-of-world-energy.html (accessed on 14 September 2021).
  8. Balitskiy, S.; Bilan, Y.; Strielkowski, W. Energy Security and Economic Growth in the European Union. J. Secur. Sustain. Issues 2014, 4, 123–130.
  9. Stępień, P.; Miciuła, I. Liberalization of the Polish energy market and the EU commitments. Czech J. Soc. Sci. Bus. Econ. 2016, 5, 25.
  10. Eurostat. Available online: http://ec.europa.eu/energy/statistics (accessed on 10 September 2021).
  11. Moran, D.; Russell, J. Energy Security and Global Politics, Routledge Global Security Studies; Taylor & Francis Group: London, UK; New York, NY, USA, 2009.
  12. Energy Information Administration. International Energy Annual; Energy Information Administration: Washington, DC, USA, 2020.
  13. NaftaGaz Analysis Center. Available online: NaftaGaz.pl (accessed on 12 September 2021).
  14. International Atomic Energy Agency. Available online: http://www.iaea.org (accessed on 22 September 2021).
  15. Salata, F.; Ciancio, V.; Dell’Olmo, J.; Golasi, I.; Palusci, O. Effects of local conditions on the multi-variable and multi-objective energy optimization of residential buildings using genetic algorithms. Appl. Energy 2020, 260, 114289.
  16. Murphy, A.; Abramowitz, U.S. Energy Information Administration, Independent Statistics & Analysis. Available online: http://www.eia.gov/todayinenergy/detail.cfm?id=18071 (accessed on 3 September 2021).
  17. Enerdata. Global Energy Statistical Yearbook 2020. Available online: https://yearbook.enerdata.net/ (accessed on 3 September 2021).
  18. Derdevet, M. L’Europe en Panne D’energie; Descartes & Cie: Paris, France, 2009.
  19. Maśloch, P.; Maśloch, G.; Kuźmiński, Ł.; Wojtaszek, H.; Miciuła, I. Autonomous energy regions as a proposed choice of selecting selected EU regions—Aspects of their creation and management. Energies 2020, 13, 6444.
  20. Eurostat. Available online: http://ec.europa.eu/eurostat/web/energy/statistics-illustrated (accessed on 20 July 2021).
  21. Global Warming. Available online: http://www.globalwarming.org.in (accessed on 1 September 2021).
  22. Molino, A.; Mehariya, S.; Karatza, D.; Chianese, S.; Iovine, A.; Casella, P.; Marino, T.; Musmarra, D. Bench-Scale Cultivation of Microalgae Scenedesmus almeriensis for CO2 Capture and Lutein Production. Energies 2019, 12, 2806.
  23. Magrini, A.; Lentini, G.; Cuman, S.; Bodrato, A.; Marenco, L. From nearly zero energy buildings (NZEB) to positive energy buildings (PEB): The next challenge—The most recent European trends with some notes on the energy analysis of a forerunner PEB example. Dev. Built Environ. 2020, 3, 100019.
  24. Research Institute: Agora Energiewende. Available online: http://www.agora-energiewende.de/Paradox.pdf (accessed on 7 June 2021).
  25. Miciuła, I.; Stępień, P. The Impact of Current EU Climate and Energy Policies on the Economy of Poland. Pol. J. Environ. Stud. 2019, 28, 2273–2280.
  26. Lumbreras, M.; Garay, R. Energy & economic assessment of façade-integrated solar thermal systems combined with ultra-low temperature district-heating. Renew. Energy 2020, 159, 1000–1014.
  27. Bloomberg New Energy Finance; BDEW: Berlin, Germany, 2020.
  28. Mann, D.; Yeung, C.; Habets, R.; Vroon, Z.; Buskens, P. Comparative Building Energy Simulation Study of Static and Thermochromically Adaptive Energy-Efficient Glazing in Various Climate Regions. Energies 2020, 13, 2842.
  29. Valdovinos-García, E.M.; Barajas-Fernández, J.; Olán-Acosta, M.Á.; Petriz-Prieto, M.A.; Guzmán-López, A.; Bravo-Sánchez, M.G. Techno-Economic Study of CO2 Capture of a Thermoelectric Plant Using Microalgae (Chlorella vulgaris) for Production of Feedstock for Bioenergy. Energies 2020, 13, 413.
More
Video Production Service