Your browser does not fully support modern features. Please upgrade for a smoother experience.
Please note this is a comparison between Version 2 by Vivi Li and Version 1 by Lillian Barros.
Cynara cardunculus L. is a species that belongs to the Asteraceae family, commonly designated as cardoon, and comprises three botanical varieties: var. altilis DC, var. scolymus (L.) Fiori, and var. sylvestris (Lamk) Fiori. This species is widely used in Mediterranean cuisine and folk medicine due to its nutritional composition, choleretic, hypocholesterolemic, and diuretic properties and effectiveness in the treatment of hepatic diseases.
- cardoon
- phenolic composition
- antioxidant activity
- seasonal changes
- anti-inflammatory activity
- oxidative hemolysis
- antimicrobial properties
1. Introduction
Plant species, including those of the Asteraceae family, contain a massive variety of compounds with high bioactive potential, being considered as the principal sources of new healing agents [1,2][1][2]. In particular, representatives of the Asteraceae family have already been characterized by the presence of specific phenolic acids and flavonoids [3]. Despite the significant contributions that compounds of natural origin have made to the discovery of potent drugs, with enormous structural complexity and diversity, their isolation and identification remain an important and rewarding area of study, as new compounds continue to be identified. Plant species remain an excellent source for the discovery of biomolecules with high pharmacological potential [4,5,6][4][5][6]. Plant secondary metabolites show antioxidant, anti-inflammatory, cytotoxic and hepatotoxic, and antimicrobial activities, and several studies are developing nowadays due to a huge plant biodiversity and their secondary metabolites [7,8][7][8].
Cynara cardunculus L. is a species that belongs to the Asteraceae family, commonly designated as cardoon, and comprises three botanical varieties: var. altilis DC, var. scolymus (L.) Fiori, and var. sylvestris (Lamk) Fiori. This species is widely used in Mediterranean cuisine and folk medicine due to its nutritional composition, choleretic, hypocholesterolemic, and diuretic properties and effectiveness in the treatment of hepatic diseases [9,10][9][10]. Cardoon is also an important source of components such as fiber, carbohydrates, inulin, minerals, and polyphenolic compounds [2,10,11][2][10][11]. Besides its nutritional and phytochemical interest, this species is used in a wide variety of industrial applications. For example, it can be used as vegetable rennet in the production of some protected designation of origin (PDO) cheeses [12,13][12][13], paper pulp [14], food oil [15], and bioenergy [16[16][17],17], as well as animal forage [18,19][18][19]. The multifaceted industrial applications of cardoon are fundamental for its economic valorization and exploitation [17]. However, industrial processing generates a large amount of wasted material, which can be an important source of biologically active compounds [17,20][17][20]. Since several parameters influence the chemical composition and bioactive properties of the species (i.e., environmental conditions, harvest time, genetic variability, and plant tissue) [10,21,22][10][21][22], the proper exploration and characterization of the species and all its constituents are extremely important and of great interest.
2. Plant Material
Petioles of Cynara cardunculus var. altilis DC cv. Bianco Avorio (Fratelli Ingegnoli Spa, Milano, Italy) were harvested during the growing period of 2017 to 2018 in Central Greece at the experimental field of the University of Thessaly in Velestino (22.756 E, 39.396 N) [22]. Petioles were collected at sixteen harvesting dates according to the principal growth stages (PGS) defined by the Biologische Bundesanstalt, Bundessortenamt, CHemische Industrie (BBCH) scale, comprising the stages between PSG 1 and PSG 9 [27][23]. Samples P1, P2, and P3 were collected in September, October, and the start of November (all PSG 1), respectively; P4 was collected at the end of November (PSG 2); samples P5, P6, P7, and P8 were collected at the beginning of January (PSG 3), February (PSG 3/4), March (PSG 4), and April (PSG 4/5), respectively; sample P9 was collected at the end of April (PSG 5); samples P10 and P11 were collected at the beginning (PSG 5/6) and at the end of May (PSG 6); P12 was collected at the beginning of June (PSG 6/7); samples P13 and P14 were collected at the beginning (PSG 7/8) and at the end of July (PSG 8); and samples P15 and P16 were collected at the beginning (PSG 8/9) and at the end of August (PSG 9). At each harvesting date, one leaf per plant from 15 individual plants (n = 15) was collected based on leaf phenology and according to the principal growth stages defined by Archontoulis et al. [27][23]. The morphology of leaves at different harvesting stages is presented in Figure 1. For each harvesting date, all the collected leaves were pooled into a batch sample. Each pooled sample consisted of at least 500 g of fresh tissue.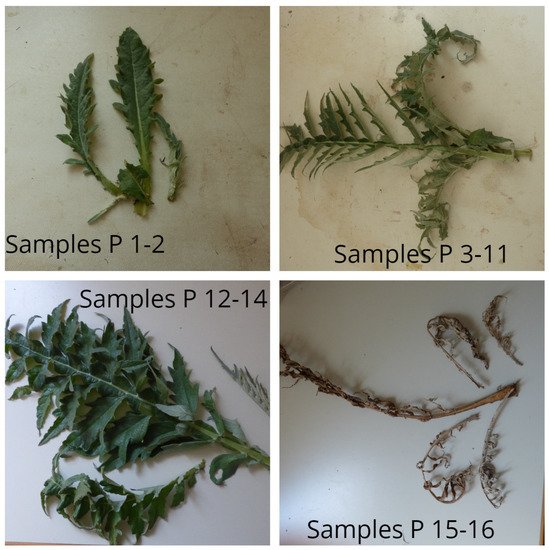
Figure 1. Leaf morphology at different harvesting stages (Sample P 1–16). Photo credits: Petropoulos S.A. (personal record).
3. Phenolic Compounds Composition
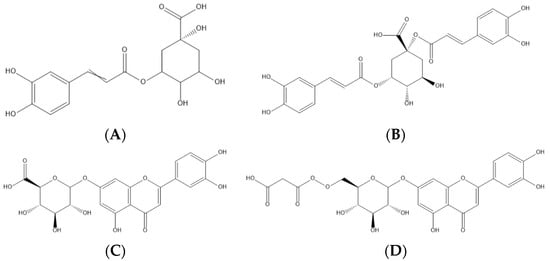
The results regarding the phenolic compound compositions, peak characteristics, and their tentative identifications are presented in Table 1. The quantification of each individual compound is presented in Table 2, as is the extraction yield (referring to the concentration of mg of compound/100 g of petioles but expressed in percentage) of each sample. In Figure 2 are presented the main phenolic acids and flavonoids found in the samples studied and, in the Supplementary Materials (SM1), the exemplified phenolic profiles of the sixteen samples of cardoon studied recorded at 280 nm. The phenolic compounds were tentatively identified according to their retention time (Rt), the wavelength of maximum absorbance (λmax), deprotonated ion ([M-H]−), and fragmentation pattern (MS2). A total of fifteen compounds were tentatively identified in cardoon petioles, including ten phenolic acid derivatives (peaks 1, 2, 3, 4, 5, 7, 10, 11, 12, and 15) and five flavonoid glycosides (peaks 6, 8, 9, 13, and 14).
plant tissues has previously been studied in samples of bracts [10] and the capitula (heads) [22]. In both studies, the younger stages of maturation showed greater cytotoxic, contrary to what was observed for the petiole extracts. As previously noticed [21[21][32],40], in addition to the stage of maturity and plant tissue, the bioactive potential may also be influenced by factors such as the genetic information, growing location, and tissue viability. To the best of the authors’ knowledge, the influence of the maturity stage on the cytotoxic potential of the cardoon petioles has not yet been described in the literature.
Figure 2. Representation of the four major phenolic compounds found in the cardoon samples studied—namely, two phenolic acids (5-O-caffeoylquinic—(A) and 1,5-di-O-caffeoylquinic acids—(B)) and two flavonoids (luteolin-O-hexuronoside—(C) and luteolin-O-malonyl-hexoside—(D)).
Table 1. Phenolic compounds tentatively identified in the hydroethanolic extracts of cardoon petioles.
| Peak | Rt (min) | λmax (nm) | [M-H] |
|---|
Table 2. Content of the phenolic compounds determined in the hydroethanolic extracts of cardoon petioles.
| Peak | Quantification (mg Equivalents of the Corresponding Standard Used for Quantification Per g of Extract) | − | (m/z) | MS2 (m/z) | Tentative Identification | |||||||||||||||
|---|---|---|---|---|---|---|---|---|---|---|---|---|---|---|---|---|---|---|---|---|
| P1 | P2 | P3 | P4 | P5 | P6 | P7 | P8 | P9 | P10 | P11 | P12 | P13 | P14 | P15 | P16 | |||||
| 1 | 4.18 | 321 | 353 | 191 (100), 179 (33), 173 (5), 135 (5) | 3-O-Caffeoylquinic acid | |||||||||||||||
| 2 | 6.14 | 266 | 153 | |||||||||||||||||
| 1 | n.d. | n.d. | n.d. | 1.22 ± 0.03 a | ||||||||||||||||
4.4. Antimicrobial Activity
The results obtained in the antibacterial assessment of the cardoon petioles are presented in Table 6. All the tested extracts revealed the capacity to inhibit the bacterial growth; in general, the Gram-positive bacteria revealed a higher susceptibility than the Gram-negative. These results are in agreement with previous reports, due to a greater susceptibility of Gram-positive bacteria as a result of their membrane constitution [10,22,47][10][22][39]. In general, petioles at principal growth stage 3 (sample P5) showed higher antibacterial activity, with lower MIC values for all the bacteria tested (MIC values between 0.75 and 1.51 mg/mL), even though the effectiveness varied greatly in the different types of bacteria studied. While the early maturation states (samples P2 and P3) showed a lower potential against the bacteria Bacillus cereus, Escherichia coli, and Salmonella Typhimurium (MIC values between 2.31 and 4.78 mg/mL), sample P4 (PSG 2) was the least effective against Staphylococcus aureus (MIC values of 6.84 mg/mL), sample P16 showed a low effectiveness against Listeria monocytogenes (MIC values of 4.73 mg/mL), and samples P11–13 were the least effective against Enterobacter cloacae (MIC values between 3.24 and 3.63 mg/mL). Sample P7 (PSG 3/4) also demonstrated an interesting effectiveness against Escherichia coli and Salmonella Typhimurium (MIC values between 0.78 and 1.57 mg/mL). Gram-positive Bacillus cereus was the more susceptible bacteria (MIC values between 0.75 and 2.39 mg/mL). On the other hand, Staphylococcus aureus was the bacteria that revealed higher MIC values and, therefore, lower susceptibility (MIC values between 1.51 and 6.84 mg/mL). Nevertheless, none of the tested extracts presented higher activity than the positive controls used (i.e., commercial antibiotics streptomycin and ampicillin).
Table 6. Antibacterial activity of the hydroethanolic extracts of the cardoon petioles.
| Antibacterial Activity (mg/mL) | |||||||||||||||||||||
|---|---|---|---|---|---|---|---|---|---|---|---|---|---|---|---|---|---|---|---|---|---|
| B. cereus | S. aureus | L. monocytogenes | E. cloacae | E. coli | S.Typhimurium | ||||||||||||||||
| MIC | MBC | MIC | MBC | MIC | MBC | MIC | MBC | MIC | MBC | MIC | MBC | ||||||||||
| P1 | 1.17 | 2.33 | 2.33 | 4.66 | |||||||||||||||||
| 109 (100) | Protocatechuic acid | ||||||||||||||||||||
| n.d. | 1.38 ± 0.01 | b | 2.7 ± 0.1 | a | 1.22 ± 0.02 | c | 0.42 ± 0.01 d | 0.290 ± 0.002 e | 0.32 ± 0.01 e | 0.297 ± 0.005 e | 0.342 ± 0.001 e | 0.064 ± 0.003 f | 0.279 ± 0.002 e | 0.058 ± 0.001 fg | n.d. | n.d. | 3 | 6.52 | 321 | 353 | 173 (100), 179 (11), 191 (10), 161 (5), 135 (5) |
| 3 | n.d. | n.d. | 4- | n.d. | O-Caffeoylquinic acid | ||||||||||||||||
| 37.2 ± 0.3 | a | 33.9 ± 0.3 | b | ||||||||||||||||||
5-O-Caffeoylquinic (peak 3) and 1,5-O-Dicafffeoylquinic acids (peak 11) were the phenolic compounds present in higher abundance throughout the studied maturation stages (6.1–37.2 and 5.03–30.1-mg/g extract, respectively) (Table 2). Samples of immature petioles (samples P1–4) are those at which higher contents of phenolic compounds were determined (69.7–101-mg/g extract), especially sample P3 (101-mg/g extract), which refers to the early stage of PGS 2. Many of the identified compounds were not found in the petiole samples harvested at the senescence (samples P15 and P16) and the early growth stages (samples P1–3). Only six of the identified phenolic compounds were detected in these samples (mostly derived from caffeoylquinic and dicaffeoylquinic acids). Moreover, differences in the extraction yields were observed between the tested samples (Table 2), with samples at the late maturity stages (P12–P16) showing the lowest extraction yield. This finding could be associated with the lignification that takes places at late maturity, which could make less effective the tested protocols in the polyphenol extractions [37,38][30][31]. Therefore, the results of this study showed that harvesting time has an influence on the phenolic content and composition in petioles. Although several reports have already proven that the stage of maturity influences the phenolic composition of different plant tissues of cardoons (flower heads, bracts, and receptacle), to the best of our knowledge, none of these studies has analyzed the phenolic composition of the petioles throughout the growth cycle.
4. Bioactive Properties
4.1. Antioxidant Potential
The antioxidant activity of the hydroethanolic extracts of cardoon petioles was studied using two cell-based methodologies (TBARS and OxHLIA), and the obtained results are presented in Table 3. All the analyzed samples exhibited the ability to inhibit the oxidation process in both cell-based assays performed. For the TBARS assay, the samples in the early maturation stages revealed, in general, lower IC50 values (i.e., more potent antioxidant activity); in particular, sample P3 (PSG 1), with the highest phenolic content among the analyzed samples, showed the highest antioxidant activity, with an IC50 value lower than the positive control Trolox (IC50 value of sample P3: 5.0 µg/mL; Trolox: 9.1 µg/mL).
Table 3. Antioxidant activity of the hydroethanolic extracts of cardoon petioles.
| Antioxidant Activity (IC50, µg/mL) | |||||||||||||||||||||||||
|---|---|---|---|---|---|---|---|---|---|---|---|---|---|---|---|---|---|---|---|---|---|---|---|---|---|
| Sample | TBARS | OxHLIA (Δt = 60 min) |
OxHLIA (Δt = 120 min) |
||||||||||||||||||||||
| P1 | 15.8 ± 0.1 m | 244 ± 5 b | 323 ± 7 e | ||||||||||||||||||||||
| 2.33 | 4.66 | 2.33 | 4.66 | 2.33 | 4.66 | 2.33 | 4.66 | P2 | 22.6 ± 0.4 j | 392 ± 10 | |||||||||||||||
| P2 | a | 2.39 | 563 ± 17 a | 4.78 | 4.78 | 9.55 | 4.78 | 9.55 | 1.15 | 2.31 | 2.39 | 4.78 | 4.78 | 9.55 | 12.18 ± 0.05 fg | 24.9 ± 0.4 c | 19.2 ± 0.1 d | 16.4 ± 0.2 e | 11.64 ± 0.02 h | 11.9 ± 0.2 gh | 6.1 ± 0.1 k | 8.7 ± 0.2 j | 9.7 ± 0.1 i | n.d. | n.d. |
| P3 | 5.0 ± 0.1 o | ||||||||||||||||||||||||
| P3 | 386 ± 2 | a | 542 ± 7 a | 2.31 | 4.61 | 4.61 | 9.23 | 2.31 | 4.61 | 4.61 | 9.23 | 4.61 | 9.23 | 4.61 | 9.23 | 4 | 6.63 | 326 | 353 | 191 (100), 179 (7), 173 (5), 135 (5) | cis | ||||
| 4 | 3.6 ± 0.1 b | -5- | O | 3.70 ± 0.03 | |||||||||||||||||||||
| P4 | b | 5.4 ± 0.2 | a | n.d. | 1.71-Caffeoylquinic acid | ||||||||||||||||||||
| n.d. | 3.42 | n.d. | n.d. | n.d. | 6.84 | n.d. | n.d. | n.d. | n.d. | n.d. | n.d. | 1.32 ± 0.03 | d | 2.02 ± 0.1 | c | ||||||||||
| P4 | 75.6 ± 0.5 d | 65 ± 4 | 6.84 | 3.42 | 6.84 | 5 | 7.10 | ||||||||||||||||||
| i | 180 ± 3 | h | 1.71 | 3.42 | 1.71 | 3.42 | 3.42 | 6.84 | 5 | 8.0 ± 0.2 326 | c353 | 191 (100), 179 (7), 173 (5), 135 (5) | 8.65 ± 0.05 btrans-5- | ||||||||||||
| P5 | 61.0 ± 0.5 e | 110 ± 5 | 16.0 ± 0.5 a | O | -Caffeoylquinic acid | ||||||||||||||||||||
| h | n.d. | n.d. | n.d. | n.d. | n.d. | 245 ± 7 | n.d. | n.d. | n.d. | n.d. | n.d. | n.d. | 2.524 ± 0.003 | ||||||||||||
| P5 | 0.75 | e | fg | 4.17 ± 0.04 | d | 1.51 | 1.51 | 3.02 | 1.51 | 3.02 | 1.51 | 3.02 | 0.75 | 6 | 15.97 | 285/sh324 | 463 | 287 (100) | Eriodictyol-O-hexuronoside | ||||||
| 1.51 | 1.51 | 3.02 | 7 | 16.69 | 322 | 515 | 353 (100), 335 (25), 191 (62), 179 (15) | 1,3-di-O-caffeoylquinic acid | |||||||||||||||||
| 8 | 18.61 | 266/343 | 461 | 285 (100) | Luteolin-O-hexuronoside derivative I | ||||||||||||||||||||
| 9 | 3,4-di- | O | -cafffeoylquinic acid | ||||||||||||||||||||||
| 13 | 23.69 | 268/332 | 533 | 489 (100), 285 (20) | Luteolin-O-malonyl hexoside derivative I | ||||||||||||||||||||
| 0.83 ± 0.01 | b | 0.52 ± 0.01 | ef | 0.48 ± 0.02 | g | 0.35 ± 0.01 | i | 0.51 ± 0.01 | f | 0.568 ± 0.002 c | 0.32 ± 0.01 j | 0.42 ± 0.02 h | 0.559 ± 0.004 cd | 0.54 ± 0.01 de | n.d. | n.d. | |||||||||
| 6 | n.d. | ||||||||||||||||||||||||
| P6 | n.d. | 20.3 ± 0.2 l | n.d. | 0.450 ± 0.001 d | 0.4143 ± 0.0001 g | 18.86 | 267/343 | 461 | |||||||||||||||||
| 2 | n.d. | n.d. | 0.398 ± 0.001 | h | 195 ± 5 | 0.598 ± 0.04 | a | d0.50 ± 0.01 e | 0.451 ± 0.001 d | 0.54 ± 0.01 b | 382 ± 5 0.43 ± 0.01 f | c0.42 ± 0.01 fg | 0.44 ± 0.01 r | 0.444 ± 0.004 de | |||||||||||
| P6 | n.d. | n.d. | |||||||||||||||||||||||
| 1.69 | 3.37 | 3.37 | 6.75 | 1.69 | 6.75 | 3.37 | 6.75 | 1.69 | 3.37 | 6.75 | >6.75 | 7 | |||||||||||||
| P7 | n.d. | 20.8 ± 0.5 kln.d. | |||||||||||||||||||||||
| P7 | 224 ± 9 | bc | n.d. | 466 ± 18 | 1.57b0.80 ± 0.01 a | 0.72 ± 0.01 b | 0.61 ± 0.01 de | 3.13 | 3.13 | 6.270.62 ± 0.01 cd | 0.393 ± 0.003 g | 0.60 ± 0.01 e | 0.457 ± 0.004 | 1.57 | 3.13 | 1.57f | 0.348 ± 0.004 i | 0.313 ± 0.005 j | 0.631 ± 0.002 c | 0.38 ± 0.01 h | n.d. | n.d. | |||
| 3.13 | 0.78 | 1.57 | 1.57 | 3.13 | 8 | n.d. | n.d. | n.d. | 1.58 ± 0.01 a | 0.68 ± 0.02 e | 0.69 ± 0.01 e | 0.95 ± 0.01 b | 0.89 ± 0.03 | ||||||||||||
| P8 | c | 0.90 ± 0.03 | c | 0.756 ± 0.002 | 1.63 | d | 0.439 ± 0.001 | h | 0.589 ± 0.001 | f | 0.54 ± 0.01 | g | 0.5411 ± 0.0004 | g | n.d. | n.d. | |||||||||
| P8 | 56.6 ± 0.5 f | 168 ± 4 e | 3.27 | 1.63 | 285 (100) | Luteolin-O | |||||||||||||||||||
| 370 ± 4 | cd | 3.27 | 1.63 | 3.27 | 1.63 | 3.27 | 0.82 | 1.63 | 1.63 | 3.27 | 9-hexuronoside derivative II | ||||||||||||||
| n.d. | n.d. | n.d. | 0.471 ± 0.001 | gh | 0.41 ± 0.01 hi | 0.395 ± 0.004 i | 0.96 ± 0.05 e | 0.49 ± 0.01 g | 1.10 ± 0.02 d | 1.26 ± 0.05 c | 0.75 ± 0.01 f | 0.76 ± 0.02 f | 3.49 ± 0.02 a | 2.6 ± 0.1 b | n.d. | n.d. | |||||||||
| P9 | 92 ± 1 b | 122 ± 4 gh | 206 ± 4 | 10 | 19.01 | 334 | 515 | 353 (100), 179 (10), 173 (29), 353 (10), 191 (10), 135 (8), 161 (5) | O-Dicaffeyolquinic acid | ||||||||||||||||
| gh | 10 | 3.6 ± 0.1 a | 1.29 ± 0.03 d | 1.71 ± 0.02 b | n.d. | n.d. | n.d. | n.d. | n.d. | n.d. | n.d. | n.d. | n.d. | ||||||||||||
| P10 | n.d. | 58 ± 2 f | n.d. | 1.02 ± 0.04 | e | 1.5 ± 0.1 | c | 122 ± 4 gh | 206 ± 4 | 11 | 20.39 | 324 | 515 | 353 (100), 191 (12), 335 (10) | 1,5-di-O-cafffeoylquinic acid | ||||||||||
| P12 | 34.5 ± 0.5 h | 135 ± 5 fg | 266 ± 4 f | ||||||||||||||||||||||
| P13 | 27 ± 2 i | 114 ± 2 gh | 185 ± 4 h | ||||||||||||||||||||||
| P14 | 44.9 ± 0.5 g | 102 ± 4 hj | 201 ± 5 gh | ||||||||||||||||||||||
| P15 | 287 ± 2 a | 208 ± 14 cd | 400 ± 40 c | ||||||||||||||||||||||
| P16 | 21.9 ± 0.4 jk | 150 ± 8 ef | 243 ± 4 ef | ||||||||||||||||||||||
| Trolox | 9.1 ± 0.3 n | 21.2 ± 0.7 k | 41.1 ± 0.8 i | ||||||||||||||||||||||
Results are expressed as the mean ± standard deviation. Different letters in the same column correspond to significant differences (p < 0.05). IC50 values correspond to the extract concentrations needed to inhibit 50% of the formation of thiobarbituric acid reactive substances (TBARS), the oxidative hemolysis (OxHLIA).
On the other hand, sample P4, also at early maturity (PGS 2), was the most effective to protect the erythrocytes from hemolysis (OxHLIA assay), showing the lowest IC50 values compared with the remaining samples (IC50 values of 65 and 180 µg/mL for Δt of 60 and 120 min, respectively). In contrast, the extracts of P15 (PSG 8/9) for TBARS and the P2 and P3 (PSG 1) samples for OxHLIA were the ones with the highest IC50 values and, therefore, with the lowest antioxidant activity.
The antioxidant potential in cardoon samples is one of the most-studied and described bioactivities of the species, mainly using the radical-scavenging capacity through the DPPH assay. The studies described in the literature verified that the antioxidant potential associated with this species depends on parameters such as the type and viability of the plant tissue, the genetic information, and the maturity state [10,21,33,40][10][21][26][32]. In the present study, the better antioxidant results in the TBARS assay were obtained in the samples at early maturity coinciding with the highest content of phenolic compounds. With the correlation study performed, it was possible to observe a negative correlation between the phenolic content and both antioxidant activity assays performed, since the higher the concentration of phenolic compounds, the lower the IC50 values (and, therefore, greater antioxidant activity). However, the R values were not very satisfactory, since phenolic acids (R = −0.296), flavonoids (R = −0.260), and total compounds (R = −0.301) only explain, approximately, 10% of the values obtained in the TBARS assay. In previous studies, a negative correlation was confirmed between the total phenolic compounds and phenolic acid content and high antioxidant activity as well [41,42][33][34]. Moreover, according to the study of Pagano et al. [43][35], the antioxidant activities observed were mostly correlated with the dicaffeoylquinic acid contents (−0.93 to −0.98 values for the Pearson’s coefficient), whereas lower coefficient values (−0.5) were observed for the caffeoylquinic acids. This finding could partly explain the findings of our study, where caffeoylquinic acids were the most abundant phenolic compounds. However, the same was not verified for the OxHLIA assay, pointing to other compounds that could be involved in the antioxidant capacity as evaluated by this method, e.g., sesquiterpene lactones and inulin [44,45][36][37]. According to the literature, the results regarding the correlation between the phenolic compound contents and the antioxidant activity are contradictory and can be highly affected by the extraction protocols and other parameters related to the genetic material and growing conditions [32,46][25][38] or the plant part [33,38][26][31]. Moreover, the fact that this study evaluates the antioxidant potential of petioles throughout the growth cycle is maybe another reason that our results are in contrast with other reports and show weak correlations between the phenolic compounds and antioxidant activity. Considering the variable chemical compositions during the growth season, the correlation analysis did not allow us to obtain as high Pearson’s coefficient values, as in the literature reports where a single harvest [33,41,42,43][26][33][34][35] or a limited number of harvests were applied [10,22][10][22].
To the best of the authors’ knowledge, this is the first report regarding the antioxidant activity of cardoon petioles collected throughout the growth cycle. In general, cardoon petioles exhibited higher antioxidant potential than cardoon bracts and heads with the same genetic information previously studied by our group [10,40][10][32].
4.2. Anti-Inflammatory Activity
The evaluation of the anti-inflammatory activity was performed through the measurements of the capacity to inhibit the proinflammatory mediator NO by the LPS-stimulated murine macrophage cell line (RAW 264.7). The obtained results are presented in Table 4. All petiole extracts exhibited anti-inflammatory activity, except for samples P5, P6, and P7 (IC50 > 400 µg/mL). The anti-inflammatory activity of the cardoon petiole extracts varied over the entire growth cycle, which suggests that the growing stage has an influence on the anti-inflammatory potential. The sample collected at principal growth stage 5 (P9) revealed the highest anti-inflammatory capacity, with an IC50 value of 14.2 µg/mL, which was lower than the positive control dexamethasone (IC50 = 16 µg/mL). This finding further supports our previous study regarding the correlation of antioxidant activity and phenolic compound contents, since sample P9 did not contain the highest amount of any detected phenolic compound, thus implying the presence of other bioactive compounds not detected in our study.
Table 4. Anti-inflammatory activity of the hydroethanolic extracts of cardoon petioles.
| Anti-Inflammatory Activity (IC50; µg/mL) | ||||||||||||||||
|---|---|---|---|---|---|---|---|---|---|---|---|---|---|---|---|---|
| Sample | RAW 246.7 | |||||||||||||||
| P1 | 154 ± 4 d | |||||||||||||||
| P2 | 91 ± 2 e | |||||||||||||||
| P3 | 179 ± 3 c | |||||||||||||||
| P4 | 222 ± 13 a | |||||||||||||||
| P5 | >400 | |||||||||||||||
| P6 | >400 | |||||||||||||||
| P7 | >400 | |||||||||||||||
| 11 | ||||||||||||||||
| P8 | 191 ± 10 b | |||||||||||||||
| 30.1 ± 0.4 | a | |||||||||||||||
| P9 | 14.2 ± 0.5 h | |||||||||||||||
| P9 | 1.89 | 3.78 | 1.89 | 3.78 | 1.89 | 3.78 | 1.89 | 3.78 | 0.94 | 1.89 | 1.89 | P10gh | ||||
| 3.78 | 34 ± 4 g | 36 ± 2 gh | 17 ± 1 i | 17 ± 2 g | 49 ± 3 jk | 15.0 ± 0.1 e | 13.1 ± 0.4 g | 23.7 ± 0.4 b | 8.4 ± 0.3 j | 11.5 ± 0.3 h | 16 ± 1 d | 5.0 ± 0.1 l | 12.9 ± 0.3 g | 14.78 ± 0.02 ef | 6.9 ± 0.2 k | P115.42 ± 0.05 |
| P11 | l | 40 ± 2 g | 22 ± 1 | c | 13.1 ± 0.1 | g | 9.6 ± 0.2 | i | 14.25 ± 0.03 | f | ||||||
| P12 | 36 ± 2 g | |||||||||||||||
| P13 | 18 ± 2 h | |||||||||||||||
| P14 | 31 ± 1 g | |||||||||||||||
| P15 | 80 ± 3 f | |||||||||||||||
| P16 | 79 ± 3 f | |||||||||||||||
| Dexamethasone | 16 ± 1 hi | |||||||||||||||
Results are expressed as the mean ± standard deviation. Different letters in the same column correspond to significant differences (p < 0.05). IC50 values correspond to the extract concentrations needed to inhibit 50% of the nitric oxide (NO) production.
Studies on the potential of cardoon as a source of compounds with anti-inflammatory power are scarce. Contrary to what was observed for the petiole extracts, immature samples of cardoon heads and bracts revealed the highest anti-inflammatory potential using the same cell-based assay: heads IC50 = 72 µg/mL [22] and bracts IC50 = 183 µg/mL [10]. The ability of cardoon seeds to inhibit the production of NO was also studied, and none of the extracts showed significant activity [40][32]. Petioles collected at principal growth stage 7/8 have an interesting potential to be explored as sources of compounds with anti-inflammatory potential, especially when considering that this stage refers to the late stages of maturity, where plants are usually harvested for other purposes. To the best of the authors’ knowledge, this is the first study that has assessed the anti-inflammatory potential of cardoon petioles throughout plant maturation.
4.3. Cytotoxic Effects against Tumor and Nontumor Cells
The cytotoxic potential of cardoon petiole extracts is presented in Table 5. The results are expressed as the extract concentrations that cause 50% of the cell proliferation inhibition (GI50 values). According to the obtained results, the cytotoxic potential of the petiole extracts not only depends on the growth stage but, also, on the employed type of cell lines. HeLa is the cell line that presented the greatest susceptibility, with lower values of GI50 at almost all states of maturity, except for samples P1, P3, and P16 (Table 5). For these samples, the HepG2 and MCF-7 cell lines were the most susceptible ones (lowest GI50 values). Samples at the mid-to-late maturation stages (especially sample P9) had greater cytotoxic potential, in contrast to the samples harvested at the early growth stages (samples P4–8) that presented higher GI50 values. In general, the GI50 values for the nontumor cells (PLP2) were higher (i.e., lower cytotoxicity) than those obtained for the human tumor cell lines. Considering our findings regarding the anti-inflammatory activity where sample P9 recorded the best performance among the tested samples, bioactive compounds other than polyphenols should be acclaimed for the observed activities.
Table 5. Cytotoxic activity of the hydroethanolic extracts of cardoon petioles.
| Cytotoxic Activity (GI50; µg/mL) | |||||||||||||||||||||||
|---|---|---|---|---|---|---|---|---|---|---|---|---|---|---|---|---|---|---|---|---|---|---|---|
| Sample | MCF-7 | NCI-H460 | HeLa | HepG2 | PLP2 | ||||||||||||||||||
| P1 | 150 ± 3 d | 173 ± 14 d | 153 ± 6 d | 155 ± 9 d | 239 ± 16 d | ||||||||||||||||||
| P2 | 76 ± 1 e | 80 ± 6 e | 58 ± 5 g | 65 ± 4 e | 143 ± 7 d | ||||||||||||||||||
| 83.9 ± 0.4 | |||||||||||||||||||||||
| P3 | 191 ± 4 c | 223 ± 7 c | 141 ± 8 de | 68 ± 2 e | 336 ± 11 a | ||||||||||||||||||
| c | |||||||||||||||||||||||
| P4 | 253 ± 5 b | 238 ± 23 c | 132 ± 5 e | 228 ± 9 c | 307 ± 9 b | ||||||||||||||||||
| P5 | >400 | 353 ± 25 a | 20 ± 2 c | 351 ± 14 a | >400 | ||||||||||||||||||
| P10 | 1.78 | 3.55 | 3.55 | 7.11 | 1.78 | 3.55 | 1.78 | 3.55 | 1.78 | 3.55 | 3.55 | 7.11 | |||||||||||
| P11 | 58 ± 4 fg | 55 ± 1 fg | 38 ± 2 h | 62 ± 5 e | 61 ± 2 j | ||||||||||||||||||
| P11 | 1.81 | 1.81 | 3.63 | 7.26 | 3.63 | 7.26 | 3.63 | 7.26 | 1.81 | 3.63 | 3.63 | P12 | 26 ± 1 i | 35 ± 1 gh | 19 ± 1 i | 16 ± 1 g | 44 ± 1 jk | ||||||
| 7.26 | |||||||||||||||||||||||
| P12 | 0.81 | 1.62 | 3.24 | 6.48 | 3.24 | 6.48 | 3.24 | 6.48 | 3.24 | 6.48 | 3.24 | 6.48 | P13 | 23 ± 1 i | 70 ± 1 ef | 17 ± 1 i | 19 ± 2 g | 37 ± 1 h | |||||
| P13 | 1.72 | 1.72 | 3.43 | 3.43 | 3.43 | 6.87 | 3.43 | 6.87 | 1.14 | 1.14 | 2.293.43 | 6.87 | 3.43 | 1.14 | 2.29 | 0.576.87 | 1.14 | 0.57 | 1.14 | 0.57 | 1.14 | P14 | 51 ± 3 |
| P14 | gh | 0.8530 ± 2 h | 1.7120 ± 1 i | 1.7119 ± 2 g | 3.4255 ± 1 j | ||||||||||||||||||
| 1.71 | 3.42 | 1.71 | 3.42 | ||||||||||||||||||||
| P14 | 0.28 | 0.57 | 1.71 | 3.42 | 1.71 | 0.57 | 1.14 | 1.14 | 3.42 | 2.28 | 0.57 | 1.14 | 1.14 | 2.28 | 0.57 | 2.28 | P15 | 66 ± 5 | |||||
| P15 | ef | 86 ± 3 e | 54 ± 3 gh | 47 ± 4 f | 112 ± 4 e | ||||||||||||||||||
| P15 | 1.15 | 2.31 | 2.31 | 4.61 | 2.31 | 4.61 | 2.31 | 4.61 | 2.31 | 4.61 | 2.31 | 0.90 | 1.80 | 1.804.61 | |||||||||
| 3.60 | 3.60 | 7.18 | 1.80 | 3.60 | 0.90 | 1.80 | 1.80 | 3.60 | P16 | 1.18 | 2.36 | 4.73 | 9.46 | 4.73 | 9.76 | 2.36 | 4.73 | 2.36 | 4.73 | 2.36 | 4.73 | ||
| Streptomycin | 0.10 | 0.20 | 0.04 | 0.10 | 0.20 | 0.30 | 0.20 | 0.30 | 0.20 | 0.30 | 0.20 | 0.30 | |||||||||||
| Ampicillin | 0.25 | 0.40 | 0.25 | 0.45 | 0.40 | 0.50 | 0.25 | 0.50 | 0.40 | 0.50 | 0.75 | 1.20 | |||||||||||
MIC: minimal inhibitory concentration; MBC: minimal bactericidal concentration. Positive control: streptomycin and ampicillin.
Cardoon petioles presented higher antibacterial activity than other plant tissues of cardoons previously studied, namely heads [22], bracts [10], viable and nonviable seeds harvested in Viseu, Portugal [40][32], and inflorescences from different genotypes [21]. These results further evidenced the influence that the different plant tissues, genetic information, growing location, and maturation stage of the species may have on its bioactive potential. Moreover, as mentioned in the case of the anti-inflammatory and cytotoxic activities, the phenolic profiles of the best-performing samples (P2 and P5) did not justify a correlation between the phenolic compound contents and the antibacterial activities of the cardoon petioles, and other bioactive compounds should be implicated.
The antifungal potential of the cardoon petioles collected at different maturation states was also analyzed, and the results are presented in Table 7. The antifungal potential changed depending on the fungi tested. In general, samples with mid-to-late maturations stages were more effective—namely, samples P10 and P11 against the fungi strains Penicillium funiculosum, Penicillium ochrochloron, and Penicillium verrucosum var. cyclopium (MIC values between 0.30 and 0.91 mg/mL). Sample P10 (PSG 5/6) presented lower MIC values than the positive control used (commercial antifungal ketoconazole). Sample P14 showed a higher efficiency against Aspergillus fumigatus (MIC value of 0.28 mg/mL). The sample collected at early maturity (sample P5) was the one with the highest antifungal capacity against Aspergillus versicolor (MIC value of 0.50 mg/mL). On the other hand, petioles harvested at the early maturation stages (samples P1–3) had less antifungal potential, particularly against Aspergillus fumigatus, Aspergillus versicolor, and Penicillium ochrochloron (MIC values between 0.92 and 3.71 mg/mL). For the remaining tested fungi strains (Aspergillus niger, Penicillium funiculosum, and Penicillium verrucosum var. cyclopium), petioles at lower maturity levels (samples P2–P5) revealed the highest MIC values and, therefore, the lowest antifungal potential. Previous works have already proven the antifungal potential of cardoon. It was verified that the maturity stage of cardoon heads and bracts had an influence on the antifungal potential [10,22][10][22] but, also, the genetic information [21] and the plant tissue [10,22,40][10][22][32]. The variable activities of the studied samples against the tested fungi imply that bioactive compounds other than polyphenols should be implicated in the observed antifungal properties of cardoon petioles.
Table 7. Antifungal activity of the hydroethanolic extracts of cardoon petioles.
| Antifungal Activity (mg/mL) | |||||||||||||||||||||||||||
|---|---|---|---|---|---|---|---|---|---|---|---|---|---|---|---|---|---|---|---|---|---|---|---|---|---|---|---|
| A. fumigatus | A. versicolor | A. niger | P. funiculosum | P. ochrochloron | P. verrucosum var. cyclopium | ||||||||||||||||||||||
| MIC | MFC | MIC | MFC | MIC | MFC | MIC | MFC | MIC | MFC | MIC | MFC | ||||||||||||||||
| P1 | 3.71 | 7.42 | 1.86 | 3.71 | 1.86 | 3.71 | 0.93 | 1.86 | 1.86 | 3.71 | 1.86 | 3.71 | |||||||||||||||
| P2 | 1.83 | 3.66 | 1.83 | 3.66 | 3.66 | 7.39 | 0.92 | 1.83 | 0.92 | 1.83 | 0.92 | 1.83 | |||||||||||||||
| P3 | 3.71 | 7.42 | 0.93 | 1.86 | 1.86 | 3.71 | 0.93 | 1.86 | 3.71 | 7.42 | 1.86 | 3.71 | |||||||||||||||
| P4 | 1.14 | 2.28 | 0.57 | 1.14 | >9.12 | > 9.12 | 0.57 | 1.14 | 0.57 | 1.14 | 0.57 | 1.14 | |||||||||||||||
| P5 | 1.01 | 2.01 | 0.50 | 1.01 | >8.05 | >8.05 | >8.05 | >8.05 | 1.01 | 2.01 | >8.05 | >8.05 | |||||||||||||||
| P6 | 1.12 | 2.25 | 1.12 | 2.25 | >9 | >9 | >9 | >9 | 5.62 | 1.12 | 9 | >9 | |||||||||||||||
| P7 | 0.52 | 1.04 | 0.52 | 1.04 | >8.36 | >8.36 | 0.52 | 1.04 | 0.52 | 1.04 | 1.04 | 2.09 | |||||||||||||||
| P8 | 2.18 | 4.36 | 1.09 | 2.18 | 1.09 | 2.18 | 0.54 | 1.09 | 0.54 | 1.09 | 0.54 | 1.09 | |||||||||||||||
| P9 | 2.52 | 5.04 | 1.26 | 2.52 | 1.26 | 2.52 | 1.26 | 2.52 | 1.26 | 2.52 | 0.63 | 1.26 | |||||||||||||||
| P10 | 2.37 | 4.74 | 1.18 | 2.37 | 1.18 | 2.37 | 0.59 | 1.18 | 0.30 | 0.59 | 0.30 | 0.59 | |||||||||||||||
| 157 ± 6 | |||||||||||||||||||||||||||
| P11 | e | 0.91 | 289 ± 9 ef | 1.81 | 0.91 | 1.81 | 1.81 | 3.63 | 0.45 | 0.91 | 0.91 | 1.81 | 0.45 | 0.91 | 12 | 22.66 | 329 | 515 | 353 (100), 335 (5), 229 (2), 255 (2), 203 (2), 191 (75), | ||||||||
| 12 | 2.4 ± 0.1 h | 3.2 ± 0.1 f | 3.5 ± 0.1 e | 179 (13), 173 (5, MS3 base peak) | 4.58 ± 0.02 c | 1.63 ± 0.03 k | 2.8 ± 0.1 g | 3.03 ± 0.04 f | 1.69 ± 0.01 k | 3.6 ± 0.1 | |||||||||||||||||
| P12 | 0.54 | 1.08 | 0.54 | 1.08 | e | 4.4 ± 0.1 | d | 1.60 ± 0.04 | 0.54 | k | 2.2 ± 0.1 | i | 6.3 ± 0.2 | 1.08a | 5.30 ± 0.02 b | 1.54 ± 0.03 | 1.08k | 1.90 ± 0.03 j | |||||||||
| 2.16 | 1.08 | 2.16 | 1.08 | 2.16 | 13 | 1.48 ± 0.01 d | 3.05 ± 0.05 b | 10.8 ± 0.1 a | n.d. | n.d. | n.d. | n.d. | n.d. | n.d. | n.d. | n.d. | n.d. | n.d. | n.d. | 2.01 ± 0.04c | 1.27 ± 0.02 e | 14 | 23.77 | 267/346 | 533 | 285 (100), 489 (50), 447 (5) | Luteolin-O-malonyl-hexoside derivative II |
| 14 | n.d. | n.d. | n.d. | 1.08 ± 0.01 b | 0.70 ± 0.01 g | 0.62 ± 0.02 hi | 1.16 ± 0.01 a | 0.679 ± 0.002 g | 0.94 ± 0.01 c | 0.82 ± 0.04 e | 0.59 ± 0.02 i | 0.64 ± 0.02 h | 0.763 ± 0.002 f | 0.91 ± 0.02 d | n.d. | n.d. | 15 | 25.58 | 330 | 515 | 353 (100), 191 (12, MS3 base peak) | 3,5-di-O-caffeolyquinic acid | |||||
| 15 | |||||||||||||||||||||||
| n.d. | |||||||||||||||||||||||
| n.d. | |||||||||||||||||||||||
| n.d. | |||||||||||||||||||||||
| 0.79 ± 0.02 | |||||||||||||||||||||||
| a | |||||||||||||||||||||||
| P16 | |||||||||||||||||||||||
| 60 ± 2 | |||||||||||||||||||||||
| fg | |||||||||||||||||||||||
| 72 ± 5 | |||||||||||||||||||||||
| P13 | 0.57 | 0.457 ± 0.004 | e | 0.54 ± 0.03 | d | 0.38 ± 0.01 | f | 0.29 ± 0.01 g | 0.63 ± 0.0 2 b | 0.45 ± 0.02 e | 0.4788 ± 0.0003 e | 0.30 ± 0.01 g | 0.7895 ± 0.0003 a | 0.57 ± 0.02 c | n.d. | n.d. | |||||||
| TPA | 47.8 ± 0.3 c | 31.8 ± 0.2 h | 40 ± 1 e | ef69.7 ± 0. 1 a | 48.6 ± 0.4 b | 55 ± 3 gh | 39 ± 3 f | 116 ± 6 e29.3 ± 0.5 i | 46.1 ± 0.4 d | 27.3 ± 0.2 j | 34.9 ± 0.4 f | 32.56 ± 0.04 g | 21.9 ± 0.4 l | 14.9 ± 0.2 n | 39.5 ± 0.2 e | 29.6 ± 0.2 i | 16.1 ± 0.2 m | 23.85 ± 0.03 l | |||||
| P16 | 3.64 | 7.28 | 0.91 | 1.82 | 1.82 | 3.64 | TF | 1.48 ± 0.01 k | 3.05 ± 0.05 f | 10.8 ± 0.1 a | 3.59 ± 0.01 d | 2.211 ± 0.003 i | 2.10 ± 0.01 ij | 3.7 ± 0.1 d | 2.55 ± 0.05 g | 3.4 ± 0.1 e | 3.4 ± 0.1 e | 2.202 ± 0.005 i | 2.407 ± 0.001 h | 5.241 ± 0.003 b | 4.5 ± 0.1 c | 2.01 ± 0.04 j | 1.27 ± 0.02 l |
| TPC | 98.5 ± 0.6 b | 69.7 ± 0.3 d | 101 ± 1 a | 73.3 ± 0.1 c | 50.8 ± 0.4 e | 31.4 ± 0.5 k | 49.8 ± 0.3 f | 29.8 ± 0.1 l | 38.3 ± 0.3 h | 33.9 ± 0.1 i | 24.08 ± 0.39 m | 17.3 ± 0.2 n | 44.8 ± 0.2 g | 34.1 ± 0.3 j | 36.2 ± 0.5 l | 50.2 ± 0.1 ef | |||||||
| Yield (%) | 25.46 | 27.4 | 30.99 | 30.9 | 34.79 | 39.36 | 33.53 | 37.56 | 22.86 | 30.98 | 20.17 | 15.46 | 14.42 | 11.90 | 14.4 | 14.57 |
Results are presented as the mean ± standard deviation. Different letters in the same row correspond to significant differences (p < 0.05). n.d.: not detected. TPA: total phenolic acids (sum of the amounts of compounds 1, 2, 3, 4, 5, 7, 10, 11, 12, and 15); TF: total flavonoids (sum of the amounts of compounds 6, 8, 9, 13, and 14); and TPC: total phenolic compounds (sum of the amounts of all fifteen compounds).
Protocatechuic acid (peak 2) was identified by comparing the retention time and the maximum UV spectra with the chromatographic characteristics of the corresponding available standard compound. The caffeoylquinic and dicaffeoylquinic acids (peaks 1, 3, 4, 5, 7, 10, 11, 12, and 15) were identified according to the hierarchical keys proposed by Clifford et al. [31][24] and Clifford, Susan, and Nikolai [32][25], based on the deprotonated ion ([M-H]− at m/z 353 and 515, respectively) and characteristic intensity of the fragment ions produced. The MSn spectra for the dicaffeoylquinic acids are provided in the Supplementary Materials (SM2). Regarding the flavonoids, peak 6 was tentatively identified as eriodictyol-O-hexuronoside, presenting a deprotonated ion [M-H]− at m/z 463 and a unique MS2 fragment at m/z 287 (eriodictyol aglycone), corresponding to the loss of 176 u of a hexuronoside unit. Finally, two O-glycosylated luteolin derivatives were tentatively identified as luteolin-O-hexuronoside derivatives I and II (peaks 8 and 9, respectively), since both presented the same deprotonated ion [M-H]− at m/z 461 and a unique MS2 fragment at m/z 285 (luteolin aglycone), corresponding to the loss of 176 u of a hexuronoside unit. The same behavior was observed for peaks 13 and 14, luteolin-O-malonyl hexoside derivatives I and II, respectively, presenting a deprotonated ion [M-H]− at m/z 533 and MS2 fragments at m/z 489 and 447 (44 u + 42 u, malonyl group) and m/z 285 (162 u, a hexosyl moiety).
Peaks 1 and 3 (3-O-caffeoylquinic and 4-O-caffeoylquinic acids) have been previously described in cardoons [20,21,33,34][20][21]
| P6 | |||||
| >400 | |||||
| >400 | |||||
| 204 ± 15 | a | >400 | 314 ± 19 | b | |
| P7 | 345 ± 20 a | >400 | 269 ± 8 b | >400 | >400 |
| P8 | 203 ± 15 c | 312 ± 8 b | 82 ± 3 f | 304 ± 11 b | 282 ± 12 c |
| P9 | 12 ± 1 ij | 16.0 ± 0.5 hi | 11.1 ± 0.3 i | 14 ± 1 g | 16 ± 1 i |
| P10 | 43 ± 2 h | ||||
| Ellipticine | |||||
| 1.21 ± 0.02 | |||||
| k | |||||
| 0.9 ± 0.1 | |||||
| j | 1.03 ± 0.09 | j | 1.10 ± 0.09 | h | 2.3 ± 0.2 j |
Results are expressed as the mean ± standard deviation. Different letters in the same column correspond to significant differences (p < 0.05). GI50 values correspond to the extract concentrations that cause 50% of the cell growth inhibition.
The study of the influence of the maturation stage on the cytotoxic potential of Cynara cardunculus
| 0.91 | ||||||||||
| 1.82 | ||||||||||
| 1.82 | ||||||||||
| 3.64 | ||||||||||
| 0.91 | ||||||||||
| 1.82 | ||||||||||
| Ketoconazole | ||||||||||
| 0.25 | ||||||||||
| 0.50 | 0.20 | 0.50 | 0.20 | 0.50 | 0.20 | 0.50 | 1.00 | 1.50 | 0.20 | 0.30 |
MIC: minimal inhibitory concentration; MFC: minimal fungicidal concentration. Positive control: ketoconazole.
5. Principal Component Analysis (PCA)
The principal component analysis (PCA) is used to reduce the complexity of multivariate data as a means of identifying specific patterns and expressing data in ways that highlight similarities and differences and, further, visualize groups of samples according to their maturation stage [48,49][40][41]. The first seven principal components (PCs) were associated with Eigen values higher than 1 and explained 91.74% of the cumulative variance, with PC1 accounting for 39.51%, PC2 for 17.62%, PC3 for 11.91%, PC4 for 7.39%, PC5 for 6.71%, PC6 for 4.54%, and finally, PC7 for 4.06%. For simplification reasons, only the first three PCAs will be considered, since they added more than 10% to the cumulative variance, up to a total of 66.23%. PC1 was positively correlated with phenolic compounds with peak numbers 4, 5, 6, and 13 and total phenolic compounds PLP2 and OxHLIA Δt60 and negatively correlated with TBARS and phenolic compounds with peak numbers 7, 8, 14, and 15 and malic and citric acids. PC2 was only negatively correlated with the phenolic compound with peak number 3, total phenolic acids, total phenolic compounds, HepG2, MCF-7, RAW264.7, PLP2, oxalic acid, quinic acid, and total organic acid. PC3 was positively correlated with phenolic compounds with peak numbers 2 and 3, HepG2, NCI-H460, and quinic acids and negatively correlated with phenolic compounds with peak numbers 9 and 12 and the total flavonoids. These results indicated the correct application of the PCA, allowing the differentiation of petiole samples between the tested maturity stages, as shown in the corresponding scatterplot (Figure 3). Moreover, the presented plot suggests that the differences in the chemical compositions and bioactive properties of the tested petiole samples are correlated with the maturation stage. In particular, nine distinct groups were detected consisting of samples P1 and P2; sample P3; sample P4; sample P5; samples P6, P9, P10, and P14; samples P7 and P13; samples P8, 11, and 12; sample P15; and sample P16. The early (samples P1–P5) and late maturity stages (samples P15 and P16) are scattered in the scatterplot, whereas the intermedium maturity stages (samples P6–P14) are closely located. The loading plot (Figure 4) of the first two components revealed groups of positively correlated variables—namely, the upper-left quadrant comprising malic acid and the phenolic compound with peak number 9; the lower-left quadrant comprising phenolic compounds with peak numbers 1, 3, 6, 7, 8, 14, and 15; TPA; and citric acid; and the lower-right quadrant comprising phenolic compounds with peak numbers 4, 5, 10, and 13; oxalic acid; TPC; RAW264.7; NCI-H460; OxHLIA Δt60; and OxHLIA Δt120.
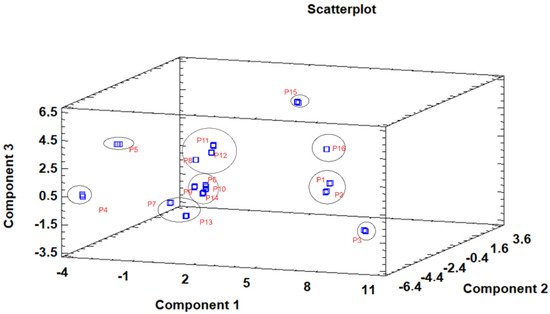
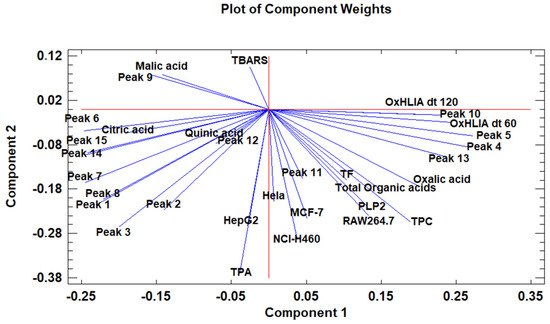
Figure 3. Three−dimensional principal component scatterplot of the tested variables at different maturation stages of cardoon petioles (samples P 1–16).
Figure 4. The principal component loading plot of the tested variables at different maturation stages of cardoon petioles.
References
- Garcia-Oliveira, P.; Barral, M.; Carpena, M.; Gullón, P.; Fraga-Corral, M.; Otero, P.; Prieto, M.A.; Simal-Gandara, J. Traditional plants from Asteraceae family as potential candidates for functional food industry. Food Funct. 2021, 12, 2850–2873.
- Rolnik, A.; Olas, B. The Plants of the Asteraceae Family as Agents in the Protection of Human Health. Int. J. Mol. Sci. 2021, 22, 3009.
- Sytar, O.; Hemmerich, I.; Zivcak, M.; Rauh, C.; Brestic, M. Comparative analysis of bioactive phenolic compounds composition from 26 medicinal plants. Saudi J. Biol. Sci. 2018, 25, 631–641.
- Atanasov, A.G.; Zotchev, S.B.; Dirsch, V.M.; The International Natural Product Sciences Taskforce; Supuran, C.T. Natural products in drug discovery: Advances and opportunities. Nat. Rev. Drug Discov. 2021, 20, 200–216.
- Thomford, N.E.; Senthebane, D.A.; Rowe, A.; Munro, D.; Seele, P.; Maroyi, A.; Dzobo, K. Natural Products for Drug Discovery in the 21st Century: Innovations for Novel Drug Discovery. Int. J. Mol. Sci. 2018, 19, 1578.
- Zhang, L.; Song, J.; Kong, L.; Yuan, T.; Li, W.; Zhang, W.; Hou, B.; Lu, Y.; Du, G. The strategies and techniques of drug discovery from natural products. Pharmacol. Ther. 2020, 216, 107686.
- Seca, A.M.L.; Pinto, D.C.G.A. Biological Potential and Medical Use of Secondary Metabolites. Medicines 2019, 6, 66.
- Karakaya, S.; Koca, M.; Sytar, O.; Duman, H. The natural phenolic compounds and their antioxidant and anticholinesterase potential of herb Leiotulus dasyanthus (K. Koch) Pimenov & Ostr. Nat. Prod. Res. 2020, 34, 1303–1305.
- Conceição, C.; Martins, P.; Alvarenga, N.; Dias, J.; Lamy, E.; Garrido, L.; Gomes, S.; Freitas, S.; Belo, A.; Brás, T.; et al. Cynara cardunculus: Use in Cheesemaking and Pharmaceutical Applications. In Technological Approaches for Novel Applications in Dairy Processing; IntechOpen: London, UK, 2018; pp. 73–107.
- Mandim, F.; Petropoulos, S.A.; Dias, M.I.; Pinela, J.; Kostic, M.; Soković, M.; Santos-Buelga, C.; Ferreira, I.C.F.R.; Barros, L. Seasonal variation in bioactive properties and phenolic composition of cardoon (Cynara cardunculus var. altilis) bracts. Food Chem. 2021, 336, 127744.
- de Falco, B.; Incerti, G.; Amato, M.; Lanzotti, V. Artichoke: Botanical, agronomical, phytochemical, and pharmacological overview. Phytochem. Rev. 2015, 14, 993–1018.
- Ben Amira, A.; Besbes, S.; Attia, H.; Blecker, C. Milk-clotting properties of plant rennets and their enzymatic, rheological, and sensory role in cheese making: A review. Int. J. Food Prop. 2017, 20, S76–S93.
- Folgado, A.; Pires, A.S.; Figueiredo, A.C.; Pimentel, C.; Abranches, R. Toward alternative sources of milk coagulants for cheese manufacturing: Establishment of hairy roots culture and protease characterization from Cynara cardunculus L. Plant Cell Rep. 2020, 39, 89–100.
- Gominho, J.; Lourenco, A.; Palma, P.; Lourenço, M.E.; Curt, M.d.; Fernández, J.; Pereira, H. Large scale cultivation of Cynara cardunculus L. for biomass production—A case study. Ind. Crop. Prod. 2010, 33, 1–6.
- Ben Amira, A.; Blecker, C.; Richel, A.; Arias, A.A.; Fickers, P.; Francis, F.; Besbes, S.; Attia, H. Influence of the ripening stage and the lyophilization of wild cardoon flowers on their chemical composition, enzymatic activities of extracts and technological properties of cheese curds. Food Chem. 2018, 245, 919–925.
- Domínguez, M.T.; Montiel-Rozas, M.M.; Madejón, P.; Diaz, M.J.; Madejón, E. The potential of native species as bioenergy crops on trace-element contaminated Mediterranean lands. Sci. Total. Environ. 2017, 590–591, 29–39.
- Gominho, J.; Curt, M.D.; Lourenço, A.; Fernández, J.; Pereira, H. Cynara cardunculus L. as a biomass and multi-purpose crop: A review of 30 years of research. Biomass Bioenergy 2018, 109, 257–275.
- Barracosa, P.; Oliveira, J.; Barros, M.; Pires, E. Morphological evaluation of cardoon (Cynara cardunculus L.): Assessing biodiversity for applications based on tradition, innovation and sustainability. Genet. Resour. Crop. Evol. 2018, 65, 17–28.
- Cabiddu, A.; Contini, S.; Gallo, A.; Lucini, L.; Bani, P.; Decandia, M.; Molle, G.; Piluzza, G.; Sulas, L. In vitro fermentation of cardoon seed press cake—A valuable byproduct from biorefinery as a novel supplement for small ruminants. Ind. Crop. Prod. 2019, 130, 420–427.
- Chihoub, W.; Dias, M.I.; Barros, L.; Calhelha, R.C.; Alves, M.J.; Harzallah-Skhiri, F.; Ferreira, I.C. Valorisation of the green waste parts from turnip, radish and wild cardoon: Nutritional value, phenolic profile and bioactivity evaluation. Food Res. Int. 2019, 126, 108651.
- Dias, M.I.; Barros, L.; Barreira, J.; Alves, M.J.; Barracosa, P.; Ferreira, I.C. Phenolic profile and bioactivity of cardoon (Cynara cardunculus L.) inflorescence parts: Selecting the best genotype for food applications. Food Chem. 2018, 268, 196–202.
- Mandim, F.; Petropoulos, S.A.; Giannoulis, K.D.; Dias, M.I.; Fernandes, Â.; Pinela, J.; Kostic, M.; Soković, M.; Barros, L.; Santos-Buelga, C.; et al. Seasonal variation of bioactive properties and phenolic composition of Cynara cardunculus var. altilis. Food Res. Int. 2020, 134, 109281.
- Archontoulis, S.V.; Struik, P.C.; Vos, J.; Danalatos, N.G. Phenological growth stages of Cynara cardunculus: Codification and description according to the BBCH scale. Ann. Appl. Biol. 2010, 156, 253–270.
- Clifford, M.N.; Johnston, K.L.; Knight, S.; Kuhnert, N. Hierarchical scheme for LC-MSnidentification of chlorogenic acids. J. Agric. Food Chem. 2003, 51, 2900–2911.
- Clifford, M.N.; Knight, S.; Kuhnert, N. Discriminating between the Six Isomers of Dicaffeoylquinic Acid by LC-MSn. J. Agric. Food Chem. 2005, 53, 3821–3832.
- Petropoulos, S.A.; Pereira, C.; Tzortzakis, N.; Barros, L.; Ferreira, I.C.F.R. Nutritional Value and Bioactive Compounds Characterization of Plant Parts from Cynara cardunculus L. (Asteraceae) Cultivated in Central Greece. Front. Plant Sci. 2018, 9, 459.
- Petropoulos, S.A.; Pereira, C.; Ntatsi, G.; Danalatos, N.; Barros, L.; Ferreira, I.C.F.R. Nutritional value and chemical composition of Greek artichoke genotypes. Food Chem. 2018, 267, 296–302.
- Graça, V.; Barros, L.; Calhelha, R.C.; Dias, M.I.; Ferreira, I.C.F.R.; Santos, P. Bio-guided fractionation of extracts of Geranium robertianum L.: Relationship between phenolic profile and biological activity. Ind. Crop. Prod. 2017, 108, 543–552.
- Shallan, M.A.; Ali, M.A.; Meshrf, W.A.; Marrez, D.A. In vitro antimicrobial, antioxidant and anticancer activities of globe artichoke (Cynara cardunculus var. scolymus L.) bracts and receptacles ethanolic extract. Biocatal. Agric. Biotechnol. 2020, 29, 101774.
- Pandino, G.; Lombardo, S.; Mauromicale, G.; Williamson, G. Profile of polyphenols and phenolic acids in bracts and receptacles of globe artichoke (Cynara cardunculus var. scolymus) germplasm. J. Food Compos. Anal. 2011, 24, 148–153.
- Graziani, G.; Docimo, T.; Palma, M.; Sparvoli, F.; Izzo, L.; Tucci, M.; Ritieni, A. Changes in Phenolics and Fatty Acids Composition and Related Gene Expression during the Development from Seed to Leaves of Three Cultivated Cardoon Genotypes. Antioxidants 2020, 9, 1096.
- Mandim, F.; Dias, M.I.; Pinela, J.; Barracosa, P.; Ivanov, M.; Stojkovic, D.; Sokovic, M.; Santos-Buelga, C.; Barros, L.; Ferreira, I.C.F.R. Chemical composition and in vitro biological activities of cardoon (Cynara cardunculus L. var. altilis DC.) seeds as influenced by viability. Food Chem. 2020, 323, 126838.
- Piluzza, G.; Bullitta, S. Correlations between phenolic content and antioxidant properties in twenty-four plant species of traditional ethnoveterinary use in the Mediterranean area. Pharm. Biol. 2011, 49, 240–247.
- Zheng, W.; Wang, S.Y. Antioxidant activity and phenolic compounds in selected herbs. J. Agric. Food Chem. 2001, 49, 5165–5170.
- Pagano, I.; Piccinelli, A.L.; Celano, R.; Campone, L.; Gazzerro, P.; De Falco, E.; Rastrelli, L. Chemical profile and cellular antioxidant activity of artichoke by-products. Food Funct. 2016, 7, 4841–4850.
- Docimo, T.; De Stefano, R.; Cappetta, E.; Piccinelli, A.L.; Celano, R.; De Palma, M.; Tucci, M. Physiological, Biochemical, and Metabolic Responses to Short and Prolonged Saline Stress in Two Cultivated Cardoon Genotypes. Plants 2020, 9, 554.
- Shang, H.M.; Zhou, H.Z.; Yang, J.Y.; Li, R.; Song, H.; Wu, H.X. In vitro and in vivo antioxidant activities of inulin. PLoS ONE 2018, 13, e0192273.
- Llorach, R.; Espín, J.C.; Tomás-Barberán, F.A.; Ferreres, F. Artichoke (Cynara scolymus L.) Byproducts as a Potential Source of Health-Promoting Antioxidant Phenolics. J. Agric. Food Chem. 2002, 50, 3458–3464.
- Scavo, A.; Pandino, G.; Restuccia, C.; Parafati, L.; Cirvilleri, G.; Mauromicale, G. Antimicrobial activity of cultivated cardoon (Cynara cardunculus L. var. altilis DC.) leaf extracts against bacterial species of agricultural and food interest. Ind. Crop. Prod. 2019, 129, 206–211.
- Petropoulos, S.A.; Pereira, C.; Barros, L.; Ferreira, I.C.F.R. Leaf parts from Greek artichoke genotypes as a good source of bioactive compounds and antioxidants. Food Funct. 2017, 8, 2022–2029.
- El-Nakhel, C.; Petropoulos, S.A.; Pannico, A.; Kyriacou, M.C.; Giordano, M.; Colla, G.; Troise, A.D.; Vitaglione, P.; De Pascale, S.; Rouphael, Y. The bioactive profile of lettuce produced in a closed soilless system as configured by combinatorial effects of genotype and macrocation supply composition. Food Chem. 2019, 309, 125713.
More