A combination of the tyrosine kinase inhibitor—sorafenib—and the opioid analgesic—morphine—can be found in the treatment of cancer patients. Since both are substrates of P-glycoprotein (P-gp), and sorafenib is also an inhibitor of P-gp, their co-administration may affect their pharmacokinetics, and thus the safety and efficacy of cancer therapy.
1. Introduction
About 50% of cancer patients undergoing active anti-cancer therapy and 90% of patients in the advanced stages experience severe pain
[1]. In the clinical practice of cancer therapies, it can be expected that a combination of tyrosine kinase inhibitors (TKIs), such as sorafenib, and opioid analgesics, including morphine, are used, which, according to the WHO guidelines, is the first-choice opioid in the relief of cancer pain
[2].
Sorafenib belongs to the group of multi-kinase inhibitors, showing antiproliferative activity of cancer cells and anti-angiogenic properties
[3]. Molecularly targeted therapy, an example of which is sorafenib, is the most promising form of pharmacotherapy among cancer patients. The use of this drug is indicated in the treatment of hepatocellular carcinoma (HCC), which is one of the most common cancers worldwide and is the third most common cause of cancer death
[4]. Sorafenib is also used in patients with advanced renal cell carcinoma (RCC)
[5], of which 30% of patients are in metastatic state at diagnosis, as well as in the treatment of differentiated thyroid cancer, including metastatic cancer, in which the use of radioactive iodine is ineffective
[6].
Sorafenib is mainly metabolized in the liver, where it undergoes N-oxidation with CYP3A4 to become the pharmacologically active sorafenib N-oxide (SR_NO), and then is transformed to inactive glucuronides as a result of UDP-glucuronosyltransferase (UGT1A9 and UGT1A1) enzyme activity
[7]. The pharmacokinetics of sorafenib and its metabolites depend on many efflux transporters, such as organic cation transporter−1 (OCT1), organic anion transporting polypeptide 1B1/3 (OATP1B1/3), multidrug resistance-associated protein 2 (MRP2) and protein 3 (MRP3), breast cancer resistance protein (BCRP), and P-glycoprotein (P-pg), which is also an inhibitor
[8][9][8,9]. Sorafenib has been shown to inhibit P-gp in vitro
[3][10][3,10] and in vivo
[11][12][11,12]. After simultaneous administration of sorafenib and P-gp substrates, such as digoxin thereof, the growth of their plasma concentrations cannot be excluded
[3][10][3,10].
Morphine is metabolized primarily by the UGT enzyme, which is expressed in the liver, small intestine, brain, and other organs
[13]. In humans, the glucuronidation of morphine is mediated via a UGT2B7 isoform in the liver, and the major metabolite of morphine is morphine-3-glucuronide (M3G), which doesn’t have analgesic properties and may antagonize the pharmacological effects of morphine
[13][14][15][13,14,15]. Only 10% of morphine is metabolized to morphine-6-glucuronide (M6G), which has a greater analgesic activity than morphine
[16]. Both M3G and M6G are highly hydrophilic, but only M6G can penetrate the blood-brain barrier (BBB) because M3G does not bind to μ-, δ- and κ-opioid receptors
[15]. UGT1A1, 1A3, and 1A9 are also involved in the metabolism of morphine but to a lesser extent
[16].
Some in vitro
[17][18][19][17,18,19], in vivo
[17][20][21][22][23][24][25][17,20,21,22,23,24,25], and clinical
[26][27][28][26,27,28] studies have shown that morphine is probably a substrate of P-gp. Likewise, its glucuronidated metabolites M3G
[29] and M6G
[30] are considered to be substrates of this drug transporter
[31]. Animal studies have shown that P-gp inhibitors increase central nervous system (CNS) concentrations and antinociceptive effects of morphine
[21][22][23][24][31][21,22,23,24,31]. A significantly increased morphine analgesia
[32] and brain distribution
[20][31][33][20,31,33] were observed in P-gp-deficient mice, suggesting that its analgesic effect is considerably dependent on P-gp expression. A study by Hamabe et al.
[34] showed a statistically significant negative correlation between the analgesic effect of morphine and the expression of P-gp in the cerebral cortex. Lötsch et al. showed that inhibition of P-gp in rats caused an increased central nervous system uptake and enhanced antinociception of M6G
[30]. Clinical studies also support the hypothesis that morphine and its glucuronide metabolites are P-gp substrates
[26][27][29][31][26,27,29,31]. Fudin et al.
[26] showed that the P-gp inducer rifampin decreased morphine blood concentrations, and that the P-gp inhibitor telaprevir
[35] may increase intestinal morphine absorption. It has been proven that patients with P-gp positive tumors require a higher dose of morphine to achieve an analgesic effect
[27].
However, there are also numerous reports that neither morphine
[29][36][29,36] nor M3G
[37] and M6G
[29][31][37][29,31,37] are P-gp substrates. Both in vitro
[38] and clinical
[39] studies suggest that morphine appears to be a likely OCT1 substrate/inhibitor
[31][38][31,38] and that MRP2 and MRP3 are involved in the hepatic excretion of M3G and M6G
[31][40][31,40]. Bourasset et al.
[41] indicated in turn that M6G is not a P-gp or MRP1 substrate, but rather a GLUT1 and/or a weak OATP2-like substrate at the BBB in mice. So, the effect of P-gp on the pharmacokinetics of morphine is not yet elucidated.
Bearing in mind that sorafenib and probably morphine belong to the P-gp substrates, and sorafenib is also a P-gp inhibitor
[10][11][12][10,11,12], the combined use of these drugs may alter their pharmacokinetics, and finally, the safety and efficacy of the cancer therapy. This drug combination in cancer patients may be associated then with drug–drug interactions (DDI) with a higher risk of treatment disruption
[42].
2. Current Insights
We evaluated the pharmacokinetics of two P-gp substrates—sorafenib (which is also a potent P-gp inhibitor) and morphine (for which the role of the P-gp in the pharmacokinetics is unclear), which were co-administered in healthy rats.
The doses of sorafenib (100 mg/kg b.w., orally) and morphine (5 mg/kg b.w., intraperitoneally) used in our study were selected based on the available literature
[12][13][12,13] and did not cause any adverse effects in healthy rats. The study is not free of limitations. The pharmacokinetic profile of sorafenib and morphine may be different between Wistar rats and humans, and we did not measure the concentrations of sorafenib glucuronide. No animals that modelled HCC or induced pain were used. However, using healthy animals allowed for eliminating the impact of comorbidities on the inter-individual variability.
2.1. The Influence of Morphine on the Pharmacokinetics of Sorafenib and SR_NO
Pharmacokinetic interactions of practical importance are mainly based on changes in drug absorption and metabolism
[42][43][44][42,45,46]. Our study showed that the co-administration of morphine and sorafenib resulted in a higher exposure of sorafenib when compared to sorafenib alone. It was documented by an approx. 1.1-fold higher C
max (the ratio C
max I
SOR+MF/C
max II
SOR was 2.08) and higher values of AUC
0–t and AUC
0–∞ (by 0.6-fold) in the I
SOR+MF group when compared to the control animals (II
SOR group). Apart from that, a significant decrease in the k
a (0.03 vs. 0.74 h
−1) was noted in the I
SOR+MF group. This fact may be the reason for the observed increase in the C
max of sorafenib in the presence of morphine (
Table 1,
Figure 1).
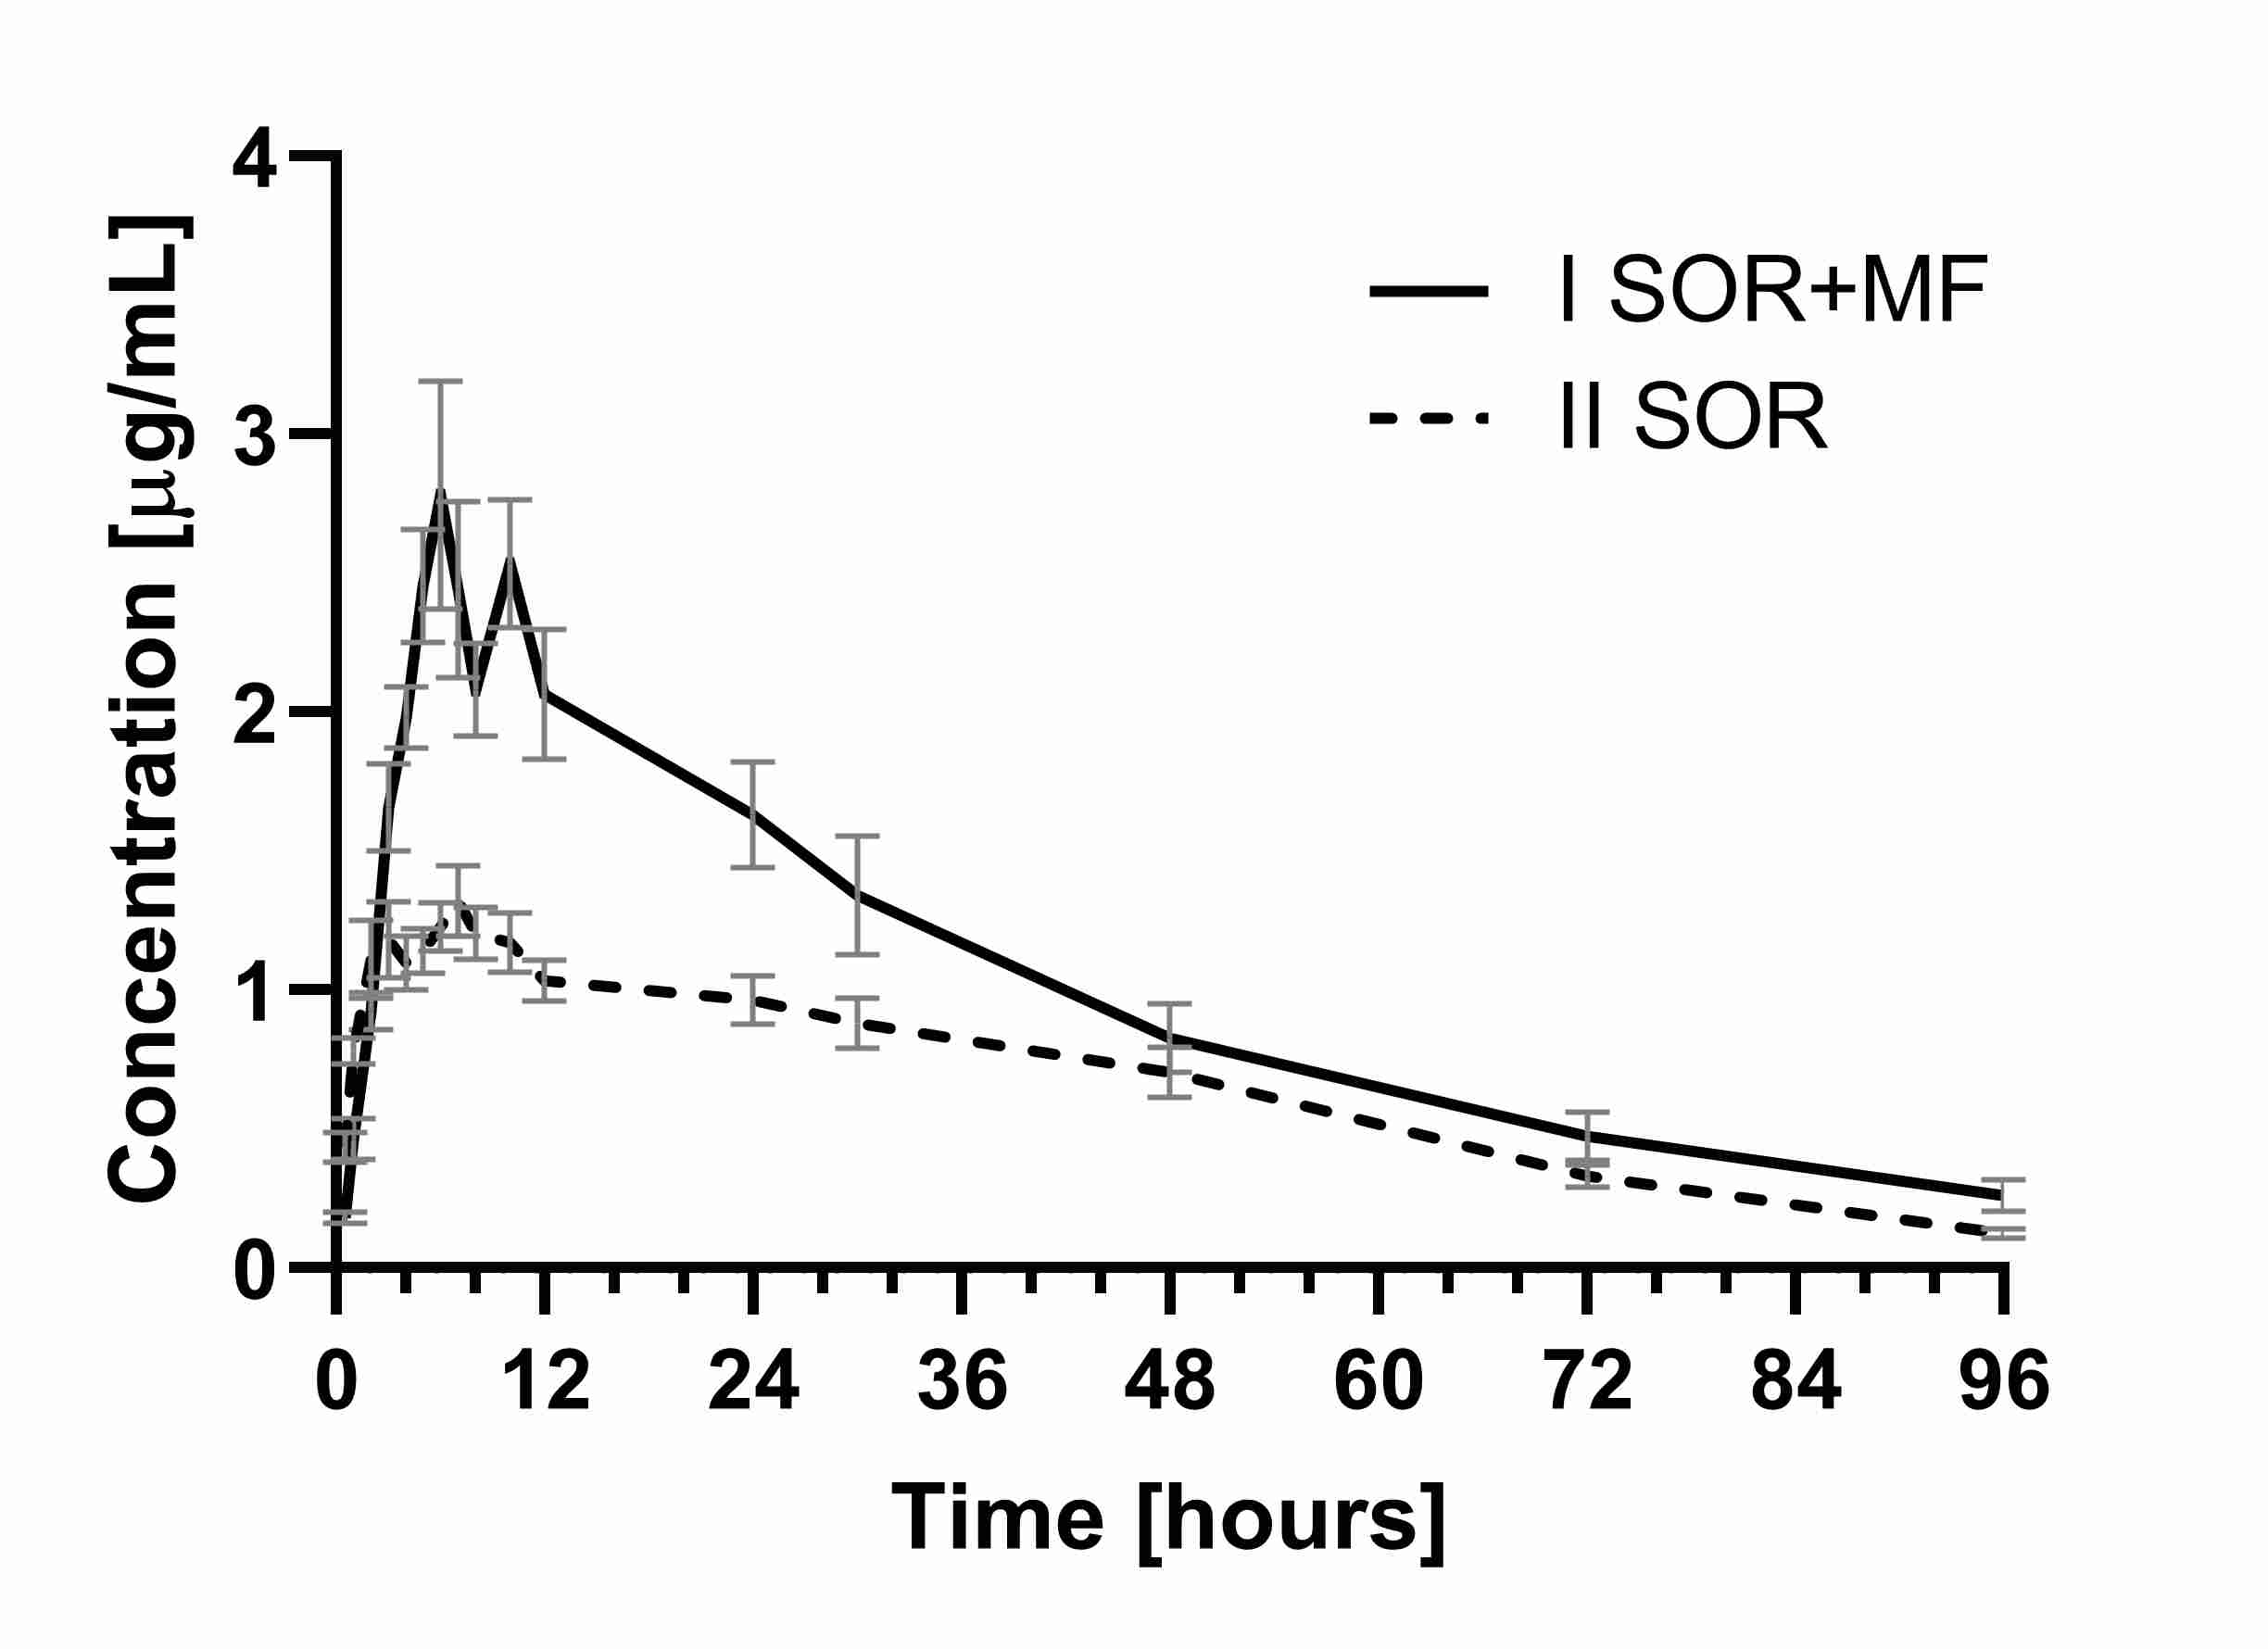
Figure 1. The sorafenib plasma concentration–time profiles in rats receiving sorafenib (IISOR) and sorafenib + morphine (ISOR+MF).
A similar tendency was observed for the main active metabolite of sorafenib—SR_NO, where C
max and AUC
0–t also increased in the I
SOR+MF group (by 145.5 and 61.9%, respectively) (
Table 1,
Figure 2). Also, the sum of the C
max for sorafenib and SR_NO values was significantly higher (
p < 0.001) in the group treated with morphine than the II
SOR group.
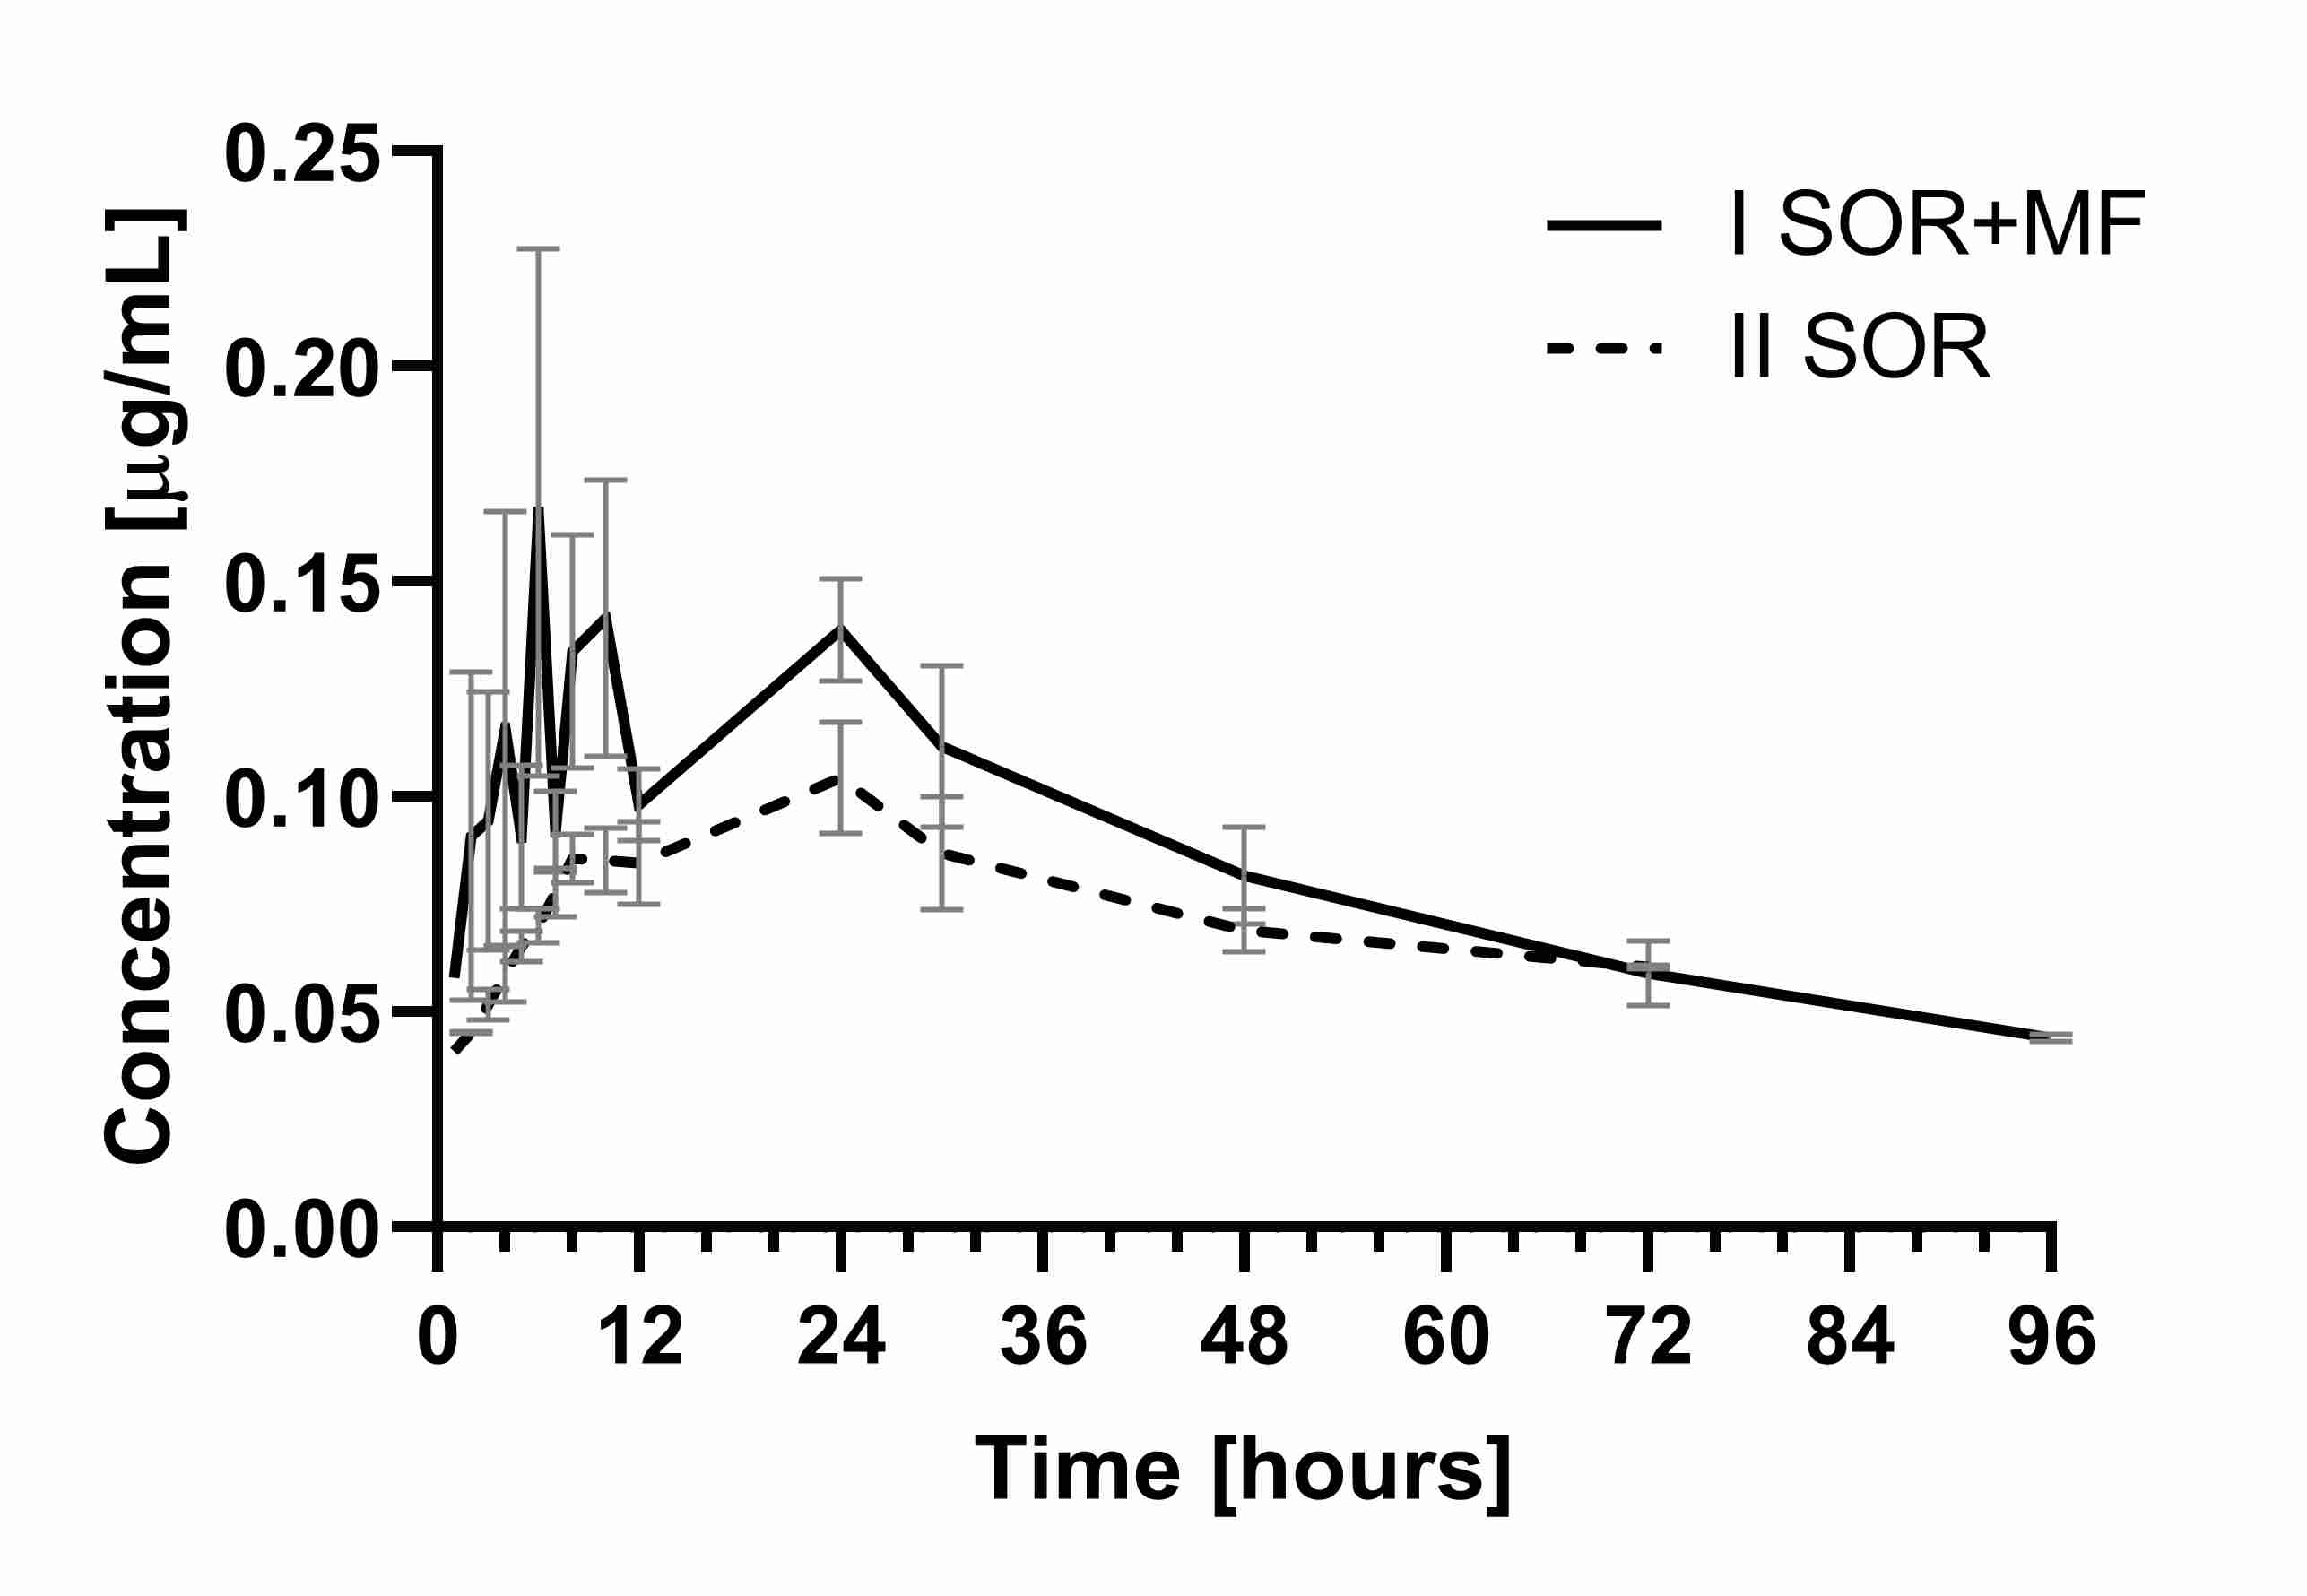
Figure 2. The sorafenib N-oxide plasma concentration–time profiles in rats receiving sorafenib (IISOR) and sorafenib + morphine (ISOR+MF).
Since SR_NO shows an in vitro potency similar to that of sorafenib, the risk of toxicity is further enhanced. A higher sorafenib N-oxide exposure probably follows an increased exposure to sorafenib. However, the ratios of sorafenib N-oxide/sorafenib for the C
max, AUC
0–t, and AUC
0–∞ in the II
SOR and I
SOR+MF group did not differ significantly, demonstrating no effect of morphine on sorafenib oxidation.
According to the FDA guidelines
[45][47], the significantly highest C
max value is generally related to the toxicity of a drug and is used therefore to evaluate or predict the risk of toxicity changes in DDI studies. In the evaluation of DDIs by regulatory agencies, systemic exposure is based on the plasma AUC
0–t. Following FDA
[45][47] and EMA
[46][48] classification, the AUC
0–t change is considered to influence the drug’s efficacy but also its toxicity. Those guidelines indicate that an AUC
0–t ratio (AUC
0–t in the presence of a perpetrator/AUC
0–t in the absence of a perpetrator) ≥5, 2–5, and 1.25–2 determined a strong, moderate, and weak pharmacokinetic-based DDI occurrence, respectively. In our study, the AUC
0–t of sorafenib in the presence of morphine was significantly higher, but the ratio of AUC
0–t I
SOR+MF/AUC
0–t II
SOR was 1.56.
Considering the above, in clinical practice, the increased systemic exposure of sorafenib and its active N-oxide metabolite in the presence of morphine may improve the response to therapy, but on the other hand, the higher C
max could be associated with the severity of such adverse events as gastrointestinal disorders or hand-foot syndrome
[3][10][3,10].
A significant role of P-gp on the absorption of tyrosine kinase inhibitors has been studied
[42][47][42,49]. Sorafenib, which is similar to, for example, critozinib and lapatinib, is a P-gp substrate, the absorption of which may depend on this efflux transporter
[42]. Co-administration of another substrate or inhibitor of P-gp might lead then to a clinically relevant DDI in the absorption phase, such as reducing the absorption rate constant observed in our study. Sorafenib t
max values may confirm more prolonged sorafenib absorption in the I
SOR+MF group when compared to the II
SOR group (7.63 vs. 5.13 h), although these differences were not statistically significant (
p = 0.0616). In addition, there was a parallel increase of the AUC
0–t of sorafenib and its metabolite SR_NO in the I
SOR+MF group when compared to the II
SOR group. Moreover, there were no statistically significant differences for the SR_NO/sorafenib ratios for the C
max, AUC
0–t and AUC
0–∞. This may confirm an interaction of sorafenib and morphine at the absorption level.
We have observed indeed a significantly lower clearance of sorafenib in the I
SOR+MF group (by 0.4-fold). Since sorafenib is largely eliminated by hepatic metabolism and excreted in feces as metabolites or unchanged, DDIs caused by changes in renal elimination may not be of significant importance. In addition, the k
el of sorafenib was increased in the presence of morphine. However, it cannot be excluded that P-gp present in the kidneys may be of some importance in the renal elimination of all tyrosine kinase inhibitors, including sorafenib
[42][48][42,50]. However, in the presence of morphine, the CL/F and Vd/F of sorafenib decreased to a similar extent (about 70%) and the t
1/2 did not increase significantly when compared to the sorafenib alone group, which speaks to the lack of interaction of these drugs at the level of metabolism.
In summary, observed changes in sorafenib pharmacokinetics in the I
SOR+MF group may be due to the competition between sorafenib and morphine for their incorporation in the P-gp transport pathway. It could be related to the concentration-dependent inhibitory effects of morphine and M3G on P-gp. This fact may be checked in the continuation of this study, considering multiple administrations of morphine to achieve a steady-state and fluctuation of the opioid concentrations.
2.2. The Influence of Sorafenib on the Pharmacokinetics of Morphine and M3G
Since the role of P-gp in the pharmacokinetics of morphine and its glucuronidated metabolites is unclear, we investigated the effect of one of the more potent P-gp inhibitors—sorafenib—on the pharmacokinetics of morphine and its M3G metabolite in rats. Animal studies have shown, for example, a relationship between the use of the other potent P-gp inhibitors—such as elacridar—and the increase in the penetration of drugs across the BBB, e.g., digoxin, talinolol, quinidine, docetaxel, and sunitinib
[42][49][42,51].
The results of our study showed that the co-administration of morphine with sorafenib caused the increase of the C
max of morphine by 56.94% (the ratio C
max I
SOR+MF/C
max III
MF was 1.57) (
Table 2,
Figure 3).
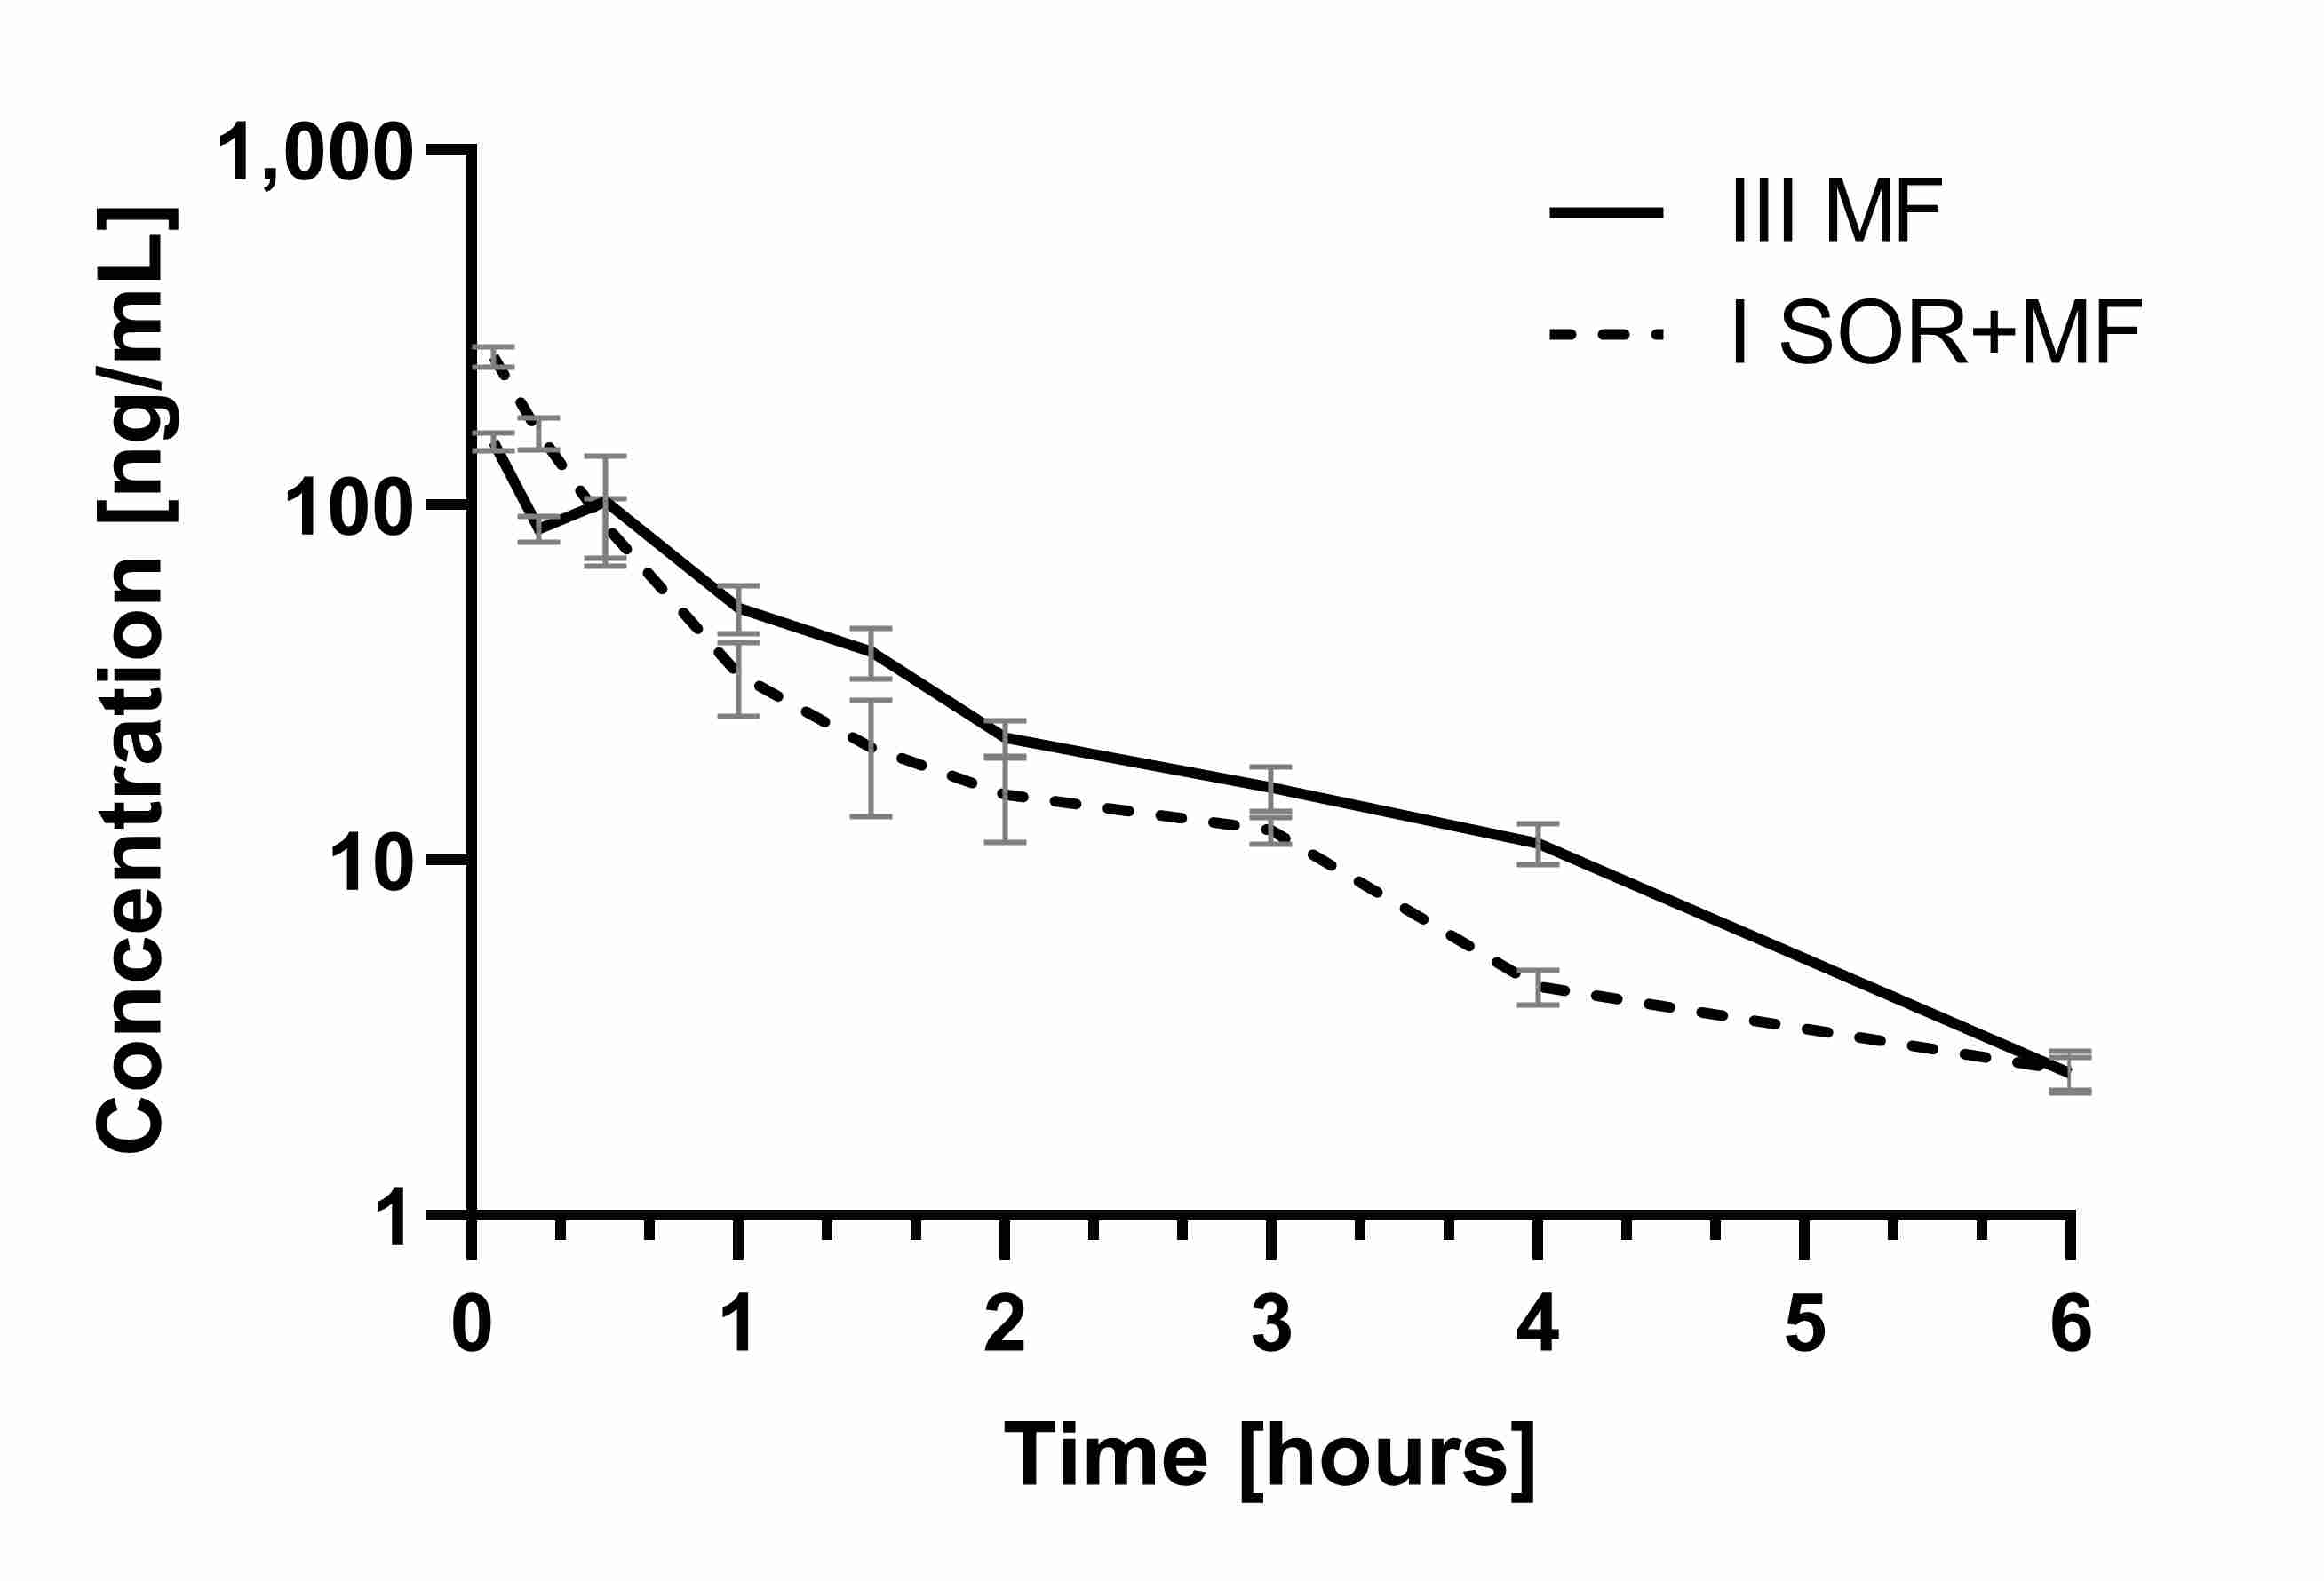
Figure 3. Th
e morphi
ne plasma concentration–time profiles in rats receiving mors morphine
(IIIMF) and sorafenib + morp
hine (ISOR+MF).
This morphine plasma C
max increase in the I
SOR+MF group may involve the risk of its adverse effects. The AUC values did not differ significantly between the groups. The ratio AUC
0–t I
SOR+MF/AUC
0–t III
MF was 0.91, and the confidence intervals (90% CI) were: 0.75; 1.16, and 0.78; 1.17, respectively. This is also confirmed by the calculation of dose-adjusted values (
Table 2). It is noteworthy that, in the presence of sorafenib, the plasma C
max, AUC
0–t, and AUC
0–∞ of M3G and the ratios (M3G/morphine) for AUC
0–t and AUC
0–∞ were also significantly higher (
Table 2). It is known that inactive M3G may be responsible for neurotoxic symptoms, such as myoclonus or hyperalgesia, as well as allodynia
[12][15][12,15]. The higher M3G/morphine AUC ratios in the I
SOR+MF group in our study may indicate the impact of sorafenib on morphine’s analgesic efficacy and safety. Unfortunately, we did not evaluate the pharmacological effects of morphine, which is a limitation of this study. However, we can suppose that a higher C
max of morphine may not cause stronger analgesic activity because it is compensated by a higher concentration of M3G, which reduces the pharmacological effects of morphine. However, we cannot exclude the increased risk of side effects, which M3G causes.
The analgesic efficacy of morphine is mainly associated with its ability to penetrate the BBB barrier, which is firmly dependent on membrane transporters, including brain P-gp. Brain P-gp can mediate the efflux of morphine from the brain, reducing its analgesic effect. Therefore, the level of P-gp expression in the brain is related to the analgesic effects of this opioid, and drugs that are brain P-gp inhibitors may decrease morphine efficacy
[27]. There is also documented that chronic morphine exposure induces P-glycoprotein in the rat brain what may enhance morphine efflux from the brain, reducing its analgesic activity
[22].
It should also be taken into account that morphine-related adverse reactions and its analgesic efficacy are generally associated with genetics polymorphism
[13]. Although, there are divergent research results on this issue as well. Some studies showed that ABCB1 polymorphisms impact morphine PK/PD
[23][50][23,52], but Coulbault et al.
[51][53] claims it does not affect. Moreover, changes in the pharmacokinetics of this opioid do not necessarily affect the analgesic effect or the severity of side effects
[14].
Meissner et al.
[28] documented that when a P-gp inhibitor cyclosporine was co-administered with morphine in healthy volunteers, an increase in the AUC value of morphine was noted. Although, the authors suggested that this may not have any significant clinical effects.
We did not achieve statistically significant differences in the AUC
0–t and AUC
0–∞ of morphine between the I
SOR+MF and III
MF groups. Also, the clearance, t
1/2, and other pharmacokinetic parameters of morphine were not changed between the groups (
Table 2). Therefore, the elevated plasma levels of morphine in the presence of sorafenib are probably not strongly caused by the inhibition of the P-gp efflux transporter in the proximal renal tubule, but rather by P-gp inhibition during the absorption phase. However, decreased renal excretion of M3G cannot be ruled out, because M3G has a higher affinity to renal P-gp than morphine itself, because it is more hydrophilic. Drewe et al.
[29] also suggested that P-gp inhibition may have a greater effect on the tubular secretion of M3G than on M6G; therefore P-gp inhibition will more likely increase M3G plasma concentrations.
The increase in plasma M3G after the intravenous administration of morphine in streptozocin-induced rats was observed, among others, by Hasegawa et al.
[52][54]. The fact that inhibition of Pgp in rats does not affect the volume of distribution and clearance of morphine was confirmed by Letrent et al.
[21] and Drewe et al.
[29]. Drewe et al.
[29] found that P-gp inhibition caused an increase in the AUC and t
1/2 of M3G, while the pharmacokinetics of morphine and its active metabolite M6G were not changed. Gadeyne et al.
[14] showed that P-gp inhibitors, ketoconazole, and elacridar did not have significant effects on morphine pharmacokinetics in dogs, although dogs in the ketoconazole group had higher sedation scores.
Table 1. Pharmacokinetic parameters of sorafenib and its metabolite sorafenib N-oxide after a single oral dose of100 mg/kg b.w. of sorafenib (IISOR group) and a single oral dose of 100 mg/kg b.w. of sorafenib + single intraperitoneal dose 5 mg/kg b.w. of morphine (ISOR+MF group).
|
Pharmacokinetic Parameters
|
IISOR
(n = 8)
|
ISOR+MF
(n = 8)
|
p-Value
ISOR+MF
vs. IISOR
|
Gmean Ratio *
(90% CI)
ISOR+MF vs. IISOR
|
|
sorafenib
|
|
Cmax (µg/mL)
|
1.56 ± 0.35 (22.6)
|
3.25 ± 0.80 (24.6)
|
0.0030
|
2.08 (1.70; 2.55)
|
|
Cmax/(D/kg)
|
0.03 ± 0.01 (23.9)
|
0.07 ± 0.02 (23.6)
|
<0.0001
|
2.13 (1.73; 2.62)
|
|
AUC0–t (µg × h/mL)
|
62.83 ± 16.14 (25.7)
|
97.98 ± 30.17 (30.8)
|
0.0115
|
1.53 (1.16; 2.02)
|
|
AUC0–t/(D/kg)
(µg × h × kg/mL/mg)
|
1.25 ± 0.32 (25.4)
|
1.99 ± 0.59 (29.7)
|
0.0075
|
1.57 (1.20; 2.05)
|
|
AUC0–∞ (µg × h/mL)
|
67.05 ± 16.70 (24.9)
|
109,08 ± 37.18 (34.1)
|
0.0115
|
1.58 (1.17; 2.13)
|
|
AUC0–∞/(D/kg)
(µg × h × kg/mL/mg)
|
1.33 ± 0.33 (24.9)
|
2.21 ± 0.73 (32.9)
|
0.0076
|
1.62 (1.21; 2.16)
|
|
tmax (h)
|
5.13 ± 2.17 (42.3)
|
7.63 ± 2.72 (35.7)
|
0.0616
|
1.54 (1.06; 2.25)
|
|
ka (h−1)
|
0.74 ± 0.31 (42.5)
|
0.03 ± 0.01 (20.5)
|
0.0008
|
0.03 (0.03; 0.05)
|
|
kel (h−1)
|
0.035 ± 0.01 (30.3)
|
0.29 ± 0.16 (53.5)
|
0.0008
|
8.16 (5.98; 11.12)
|
|
t1/2 (h)
|
21.89 ± 7.79 (35.6)
|
27.31 ± 5.32 (19.5)
|
0.0829
|
1.25 (1.02; 1.53)
|
|
Cl/F (L/h × kg)
|
0.80 ± 0.22 (27.1)
|
0.51 ± 0.23 (43.8)
|
0.0224
|
0.62 (0.46; 0.83)
|
|
Vd/F (L)
|
25.30 ± 11.59 (45.8)
|
19.14 ± 5.26 (27.5)
|
0.0829
|
0.77 (0.59; 1.01)
|
|
sorafenib N-oxide
|
|
Cmax (µg/mL)
|
0.11 ± 0.02 (21.8)
|
0.27 ± 0.16 (57.5)
|
0.0022
|
2.15 (1.50; 3.08)
|
|
AUC0–t (µg × h/mL)
|
4.10 ± 1.56 (38.1)
|
6.64 ± 2.44 (36.8)
|
0.0268
|
1.64 (1.14; 2.36)
|
|
AUC0–∞ (µg × h/mL)
|
8.61 ± 2.19 (25.4)
|
9.39 ± 2.97 (31.6)
|
0.1242
|
1.41 (0.95; 2.08)
|
|
tmax (h)
|
16.38 ± 8.21 (50.1)
|
14.50 ± 11.40 (78.6)
|
0.4531
|
0.76 (0.41; 1.39)
|
|
kel (h−1)
|
0.016 ± 0.010 (60.9)
|
0.023 ± 0.012 (51.6)
|
0.4001
|
0.80 (0.47; 1.36)
|
|
t1/2 (h)
|
53.31 ± 25.23 (47.3)
|
39.30 ± 22.54 (57.4)
|
0.4622
|
1.25 (0.73; 2.13)
|
|
ratio sorafenib N-oxide/sorafenib
|
|
Cmax (µg/mL)
|
0.07 ± 0.02 (26.8)
|
0.09 ± 0.07 (76.2)
|
0.5280
|
1.03 (0.67; 1.61)
|
|
AUC0–t (µg × h/mL)
|
0.07 ± 0.02 (37.1)
|
0.07 ± 0.03 (43.7)
|
0.6012
|
1.07 (0.70; 1.65)
|
|
AUC0–∞ (µg × h/mL)
|
0.14 ± 0.05 (38.1)
|
0.10 ± 0.07 (64.1)
|
0.9176
|
0.89 (0.53; 1.51)
|
Cmax, maximum observed plasma concentration; AUC0–t, area under the plasma concentration-time curve from zero to the last measurable concentration; AUC0–∞, area under the plasma concentration-time curve from zero to infinity; tmax, time to reach the Cmax; ka, absorption rate constant; kel, elimination rate constant; t1/2, half-life in the elimination phase; Cl/F, apparent plasma drug clearance; Vd/F, apparent volume of distribution; b.w., body weight; the pharmacokinetic parameter values are shown as the arithmetic means ± standard deviations (SD) with coefficients of variation (CV) (%) in the brackets; * geometric means (Gmean) ratio between ISOR+MF and IISOR groups (%) with a 90% confidence interval (CI) in the brackets; individual drug ratios were calculated according the following equations: the metabolite Cmax (ng/mL)/parent Cmax (ng/mL), metabolite AUC0–t (ng × h/mL)/parent drug AUC0–t (ng × h/mL), and metabolite AUC0–∞ (ng × h/mL)/parent drug AUC0–∞ (ng × h/mL).
Table 2. Pharmacokinetic parameters of morphine and its metabolite M3G after a single intraperitoneal dose of 5 mg/kg b.w. of morphine (IIIMF group) and a single oral dose of 100 mg/kg b.w. of sorafenib + single intraperitoneal dose of 5 mg/kg b.w. of morphine (ISOR+MF group).
|
Pharmacokinetic Parameters
|
IIIMF
(n = 7)
|
ISOR+MF
(n = 8)
|
p-Value
ISOR+MF
vs. IIIMF
|
Gmean Ratio *
(90% CI)
ISOR+MF vs. IIIMF
|
|
morphine
|
|
Cmax (ng/mL)
|
166.83 ± 46.12 (27.6)
|
261.83 ± 47.85 (18.3)
|
0.0018
|
1.59 (1.30; 1.94)
|
|
Cmax/(D/kg)
(kg × ng/mL/mg)
|
67.88 ± 18.74 (27.6)
|
106.14 ± 18.96 (17.9)
|
0.0018
|
1.58 (1.30; 1.93)
|
|
AUC0–t (ng × h/mL)
|
169.88 ± 47.37 (27.9)
|
155.40 ± 28.41 (18.3)
|
0.4786
|
0.93 (0.75; 1.16)
|
|
AUC0–t/(D/kg)
(ng × h × kg/mL/mg)
|
69.28 ± 19.99 (28.9)
|
63.06 ± 11.52 (18.3)
|
0.4655
|
0.93 (0.75; 1.16)
|
|
AUC0–∞ (ng × h/mL)
|
174.44 ± 46.73 (26.8)
|
162.57 ± 25.89 (15.9)
|
0.5458
|
0.95 (0.78; 1.17)
|
|
AUC0–∞/(D/kg)
(ng × h × kg/mL/mg)
|
71.14 ± 19.75 (27.8)
|
65.96 ± 10.49 (15.9)
|
0.5287
|
0.95 (0.77; 1.17)
|
|
tmax (h)
|
0.14 ± 0.16 (110.2)
|
0.08 ± 0.00 (0.0)
|
0.3559
|
0.77 (0.47; 1.27)
|
|
kel (h−1)
|
0.60 ± 0.18 (29.3)
|
0.54 ± 0.41 (76.1)
|
0.2976
|
0.75 (0.46; 1.23)
|
|
t1/2 (h)
|
1.22 ± 0.28 (22.7)
|
1.91 ± 1.13 (59.3)
|
0.2976
|
1.33 (0.82; 2.15)
|
|
Cl/F (L/h × kg)
|
15.05 ± 4.39 (29.2)
|
15.51 ± 2.36 (15.2)
|
0.8010
|
1.06 (0.86; 1.30)
|
|
Vd/F (L/kg)
|
27.49 ± 13.38 (48.7)
|
44.65 ± 29.20 (65.4)
|
0.1778
|
1.40 (0.76; 2.60)
|
|
M3G
|
|
Cmax (ng/mL)
|
9781.28 ± 3184.17 (32.6)
|
20,796.81 ± 3657.84,(17.6)
|
<0.0001
|
2.20 (1.73; 2.80)
|
|
AUC0–t (ng × h/mL)
|
10,035.88 ± 1408.48 (14.0)
|
14,734.53 ± 3979.45 (27.0)
|
0.0124
|
1.43 (1.14; 1.79)
|
|
AUC0–∞ (ng × h/mL)
|
10,131.53 ± 1393.15 (13.8)
|
14,871.32 ± 4001.35 (26.9)
|
0.0121
|
1.42 (1.14; 1.79)
|
|
tmax (h)
|
0.46 ± 0.09 (20.4)
|
0.34 ± 0.13 (37.6)
|
0.0662
|
0.71 (0.53; 0.96)
|
|
kel (h−1)
|
0.73 ± 0.20 (27.6)
|
0.68 ± 0.19 (28.0)
|
0.6355
|
0.93 (0.69; 1.24)
|
|
t1/2 (h)
|
1.03 ± 0.33 (32.5)
|
1.13 ± 0.47 (41.1)
|
0.7285
|
1.08 (0.81; 1.45)
|
|
M3G/morphine
|
|
Cmax (ng/mL)
|
63.87 ± 30.71 (48.1)
|
82.18 ± 21.67 (26.4)
|
0.2004
|
1.14 (0.78; 1.66)
|
|
AUC0–t (ng × h/mL)
|
64.45 ± 24.06 (37.3)
|
97.35 ± 33.05 (34.0)
|
0.0488
|
1.38 (0.96; 2.00)
|
|
AUC0–∞ (ng × h/mL)
|
62.88 ± 22.44 (35.7)
|
92.80 ± 28.44 (30.7)
|
0.0435
|
1.53 (1.10; 2.12)
|
Cmax, maximum observed plasma concentration; AUC0–t, area under the plasma concentration-time curve from zero to the last measurable concentration; AUC0–∞, area under the plasma concentration-time curve from zero to infinity; tmax, time to reach the Cmax; ka, absorption rate constant; kel, elimination rate constant; t1/2, half-life in the elimination phase; Cl/F, apparent plasma drug clearance; Vd/F, apparent volume of distribution; b.w., body weight; the pharmacokinetic parameter values are shown as the arithmetic means ± standard deviations (SD) with coefficients of variation (CV) (%) in the brackets; * geometric means (Gmean) ratio between ISOR+MF and IISOR groups (%) with a 90% confidence interval (CI) in the brackets; individual drug ratios were calculated according the following equations: the metabolite Cmax (ng/mL)/parent Cmax (ng/mL), metabolite AUC0–t (ng × h/mL)/parent drug AUC0–t (ng × h/mL), and metabolite AUC0–∞ (ng × h/mL)/parent drug AUC0–∞ (ng × h/mL).