The investigation of travel mode choice is an essential task in transport planning and policymaking for predicting travel demands. Typically, mode choice datasets are imbalanced and learning from such datasets is challenging. This study deals with imbalanced mode choice data by developing an algorithm (SVMAK) based on a support vector machine model and the theory of adjusting kernel scaling.
1. Introduction
A considerable amount of people’s daily trips is associated with their work. Transport planners and engineers attempt to discover work-related travel behaviors and establish strategies for reducing the adverse impacts of motorized transport on traffic, health, and the environment. One of these important behaviors is work mode choice which refers to the process where an individual chooses a certain mode for his/her trip to work. According to the literature, a variety of factors influence the work mode choice. Socioeconomic factors
[1][2][3][1,2,3], household attributes e.g.,
[4], trip characteristics e.g.,
[5], job e.g.,
[6][7][8][9][6,7,8,9], and built environment
[2][10][11][2,10,11] are some of these factors
[3][11][3,11].
Mode choice data include a wide range of variables and samples. Typically, these data are complex and incomplete
[12]. Furthermore, since motorized transport is dominant in most parts of the world, the travel surveys yield unbalanced mode choice classes; that is, there are more people who use cars than people who use other commute modes.
To date, many studies investigated the choice of travel mode to work (
Table 1). These methods employed both traditional statistical methods and machine learning (ML) techniques. However, the former is criticized because of its linearity assumptions concerning mode choice data
[13][14][15][13,14,15]. Thus, the employment of ML techniques has receieved more attention recently
[16][17][18][19][20][21][22][23][16,17,18,19,20,21,22,23]. The classification of the new cases established concerning the existing samples is an essential task in ML models. If at least one of the categories comprises a smaller number of samples than other categories, the classification process becomes complex
[24]. The class imbalance issue is simply an uneven data distribution amongst the different categories of the target. The precision of the classification algorithms will be unreliable when they are influenced by the majority class. In this case, the new samples are distributed to the majority category since the classification model tends to predict the minority category with less accuracy, which is an undesirable consequence
[25].
Support vector machine (SVM) is a renowned ML technique for classification
[26]. This algorithm also was used as a base to cope with imbalanced data. Batuwita and Palade
[27] developed the fuzzy SVM model and dealt with imbalanced data in the presence of noises and outliers. Wang and Japkowicz
[28] suggested boosting-SVMs with asymmetric cost. Their model runs by adjusting the classifier utilizing cost assignation, though it compensates the bias presented with adjustment through utilizing a combination system that is comparable, in effect, to adjust the distribution of data. Wu and Chang
[29] suggested the class-boundary alignment algorithm to augment the SVM model to deal with imbalanced data. They modified the class boundary by converting the kernel function if data is represented in a vector space. This modification can also be performed by adjusting the kernel matrix if the data do not possess a vector-space representation. To enhance forecast performance, Liu et al.
[30] suggested consolidating an integrated sampling system, which mixes both over-sampling and under-sampling, with an ensemble of SVM. These studies investigated the binary classification problem based on the SVM model; however, less examinations have been done concerning multiclass imbalanced classification based on this model.
Many studies in other domains, including medicine, economy, crash severity, and so on, tried to reduce the issues of imbalanced data, e.g.,
[31][32][33][31,32,33]. However, a very small number of studies have investigated the issues of imbalanced travel mode choice data and proposed a solution for it
[33].
Table 1. Some investigation on work mode choice.
| Author |
Main Factors Used |
Modelling Method |
| Lu and Kawamura [34] |
Mode preferences and responsiveness to level-of-service |
Multinomial logit |
| Badoe [4] |
Households (two-workers) |
Multinomial logit |
| Xie et al. [35] |
Sociodemographic and Level-of-service attributes |
Multinomial logit, Decision trees (DT), and Neural Networks (NN) |
| Patterson et al. [36] |
Gender |
Multinomial logit |
| Al-Ahmadi [37] |
Cultural, socioeconomic, safety, and religious parameters |
Disaggregate models and utility maximization |
| Gang [1] |
Socioeconomic |
Multinomial logit |
| Vega and Reynolds-Feighan [5] |
Travel time, travel cost, and employment destinations |
Binary logit and GIS |
| Vega and Reynolds-Feighan [38] |
Central and non-central and suburban employment patterns. |
GIS and Cross-Nested Logit (CNL) |
| Day, Habib and Miller [6] |
Commuter trip timing, occupation groups, labor rates, work hour rules, free parking availability, and the spatial distribution of work locations |
Multinomial logit |
| Habib [7] |
Work start time and work duration |
Multinomial logit |
| Heinen, Maat and van Wee [8] |
Office culture and colleagues’ and employers’ attitudes |
Binary logit |
| Hamre and Buehler [9] |
free car parking, public transportation benefits, showers/lockers, and bike parking at work |
Multinomial logit |
| Heinen and Bohte [39] |
Attitudes Toward Mode Choice |
Multinomial logit |
| Tran, Zhang, Chikaraishi and Fujiwara [10] |
Neighborhood and travel preferences, land use policy, land use diversity and population density |
Multinomial logit |
| Kunhikrishnan and Srinivasan [40] |
Contextual heterogeneity |
Binary logit |
| Franco [41] |
Downtown parking supply |
Spatial general equilibrium
model |
| Simons, De Bourdeaudhuij, Clarys, De Geus, Vandelanotte, Van Cauwenberg and Deforche [2] |
Gender, socio-economic-status (SES) and living environment (urban vs. rural) |
Zero-inflated negative binomial (ZINB) regression |
| Indriany et al. [42] |
Risk and uncertainty |
Binomial logit |
| Irfan et al. [43] |
Econometric Modeling |
Multinomial logit |
| Hatamzadeh et al. [44] |
Gender |
Binary logit |
2. Sensitivity Analysis
Many factors impact the travel mode choice; however, their effects are not the same. Thus, it is necessary to ascertain the magnitude of these impacts and identify the most influential factors on travel mode choice. For this purpose, the mutual information (MI) test method was employed[45][50], which computes the importance of the inputs. MI means a filtering system that captures the random association between inputs and the target. MI examines the dependence among variables and confirms the strength of the connection among them.
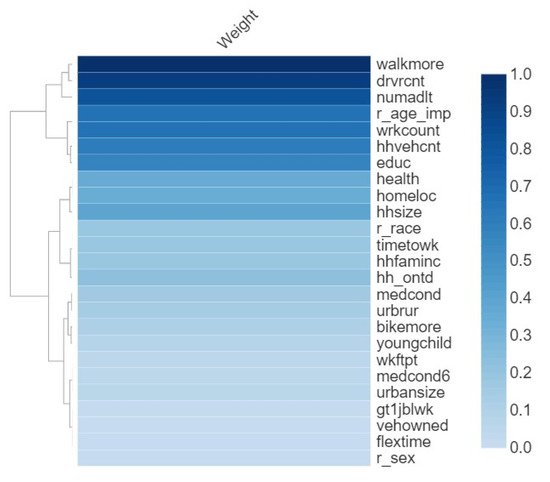
Ultimately, the importance magnitude of each attribute for predicting travel mode choice was achieved based on the scores obtained in the MI test. The outcomes of this analysis are shown in
Figure 14. The most important attributes were reason for not walking (walkmore), number of drivers in household (drvcnet), and count of adult household members at least 18 years old (numadlt). On the other hands, the lowest scores belonged to flexibility of work start time (flextime), owned vehicle longer than a year (vehowned), and gender (r_sex).
Figure 14.
Outcomes of sensitivity analysis.
Reasons for not walking among respondents included unsafe street crossings, heavy traffic, and insufficient night lighting. It is clear that any improvement in these street conditions can encourage people to shift from motorized transport to walking. Thus, it makes sense that this factor is among the most influential travel mode choice factors to work
[46][47][48][51,52,53]. The significance of the number of drivers in households can be attributed to its influence on the usage of vehicles and the generation of more trips. In practice, the likelihood of choosing active transportation options reduces as the number of drivers in a family grows
[49][54]. As the number of adults in a family increases, the need for independent trips rises. Because of the different responsibilities that each adult in the family has, it is not easy to consolidate trips into one trip. This can be easily one of the principal sources of more trip generation and use of motorized transportation.
The flexibility of work start time was among the least important factors. This could be attributable to work culture of the respondents in the US. However, several previous studies showed that the flexibility of work start time influences the mode choice e.g.,
[49][50][54,55]. The possession of a vehicle for longer than a year was also an unimportant factor for predicting the choice of travel mode to work. A possible reason for this is that people usually look for flexible and convenient travel options to work. Usually, they are reluctant to replace their private cars with healthy travel modes unless they face new challenges. These challenges can be health problems, heavy traffic, so on. Thus, it is sensible that this factor does not influence the mode choice substantially.