One of the most critical infrastructures in the world is electrical power grids (EPGs). New threats affecting EPGs, and their different consequences, are analyzed in this survey along with different approaches that can be taken to prevent or minimize those consequences, thus improving EPG resilience. The necessity for electrical power systems to become resilient to such events is becoming compelling; indeed, it is important to understand the origins and consequences of faults. This survey provides an analysis of different types of faults and their respective causes, showing which ones are more reported in the literature. As a result of the analysis performed, it was possible to identify four clusters concerning mitigation approaches, as well as to correlate them with the four different states of the electrical power system resilience curve.
- natural disasters
- cyber and physical attacks
- system errors
- electrical power grid faults
- resilient system
1. Power Grid Faults
The scale of the cause will influence the respective consequences of the originated fault. If a small cause occurs, it will originate a small-scale fault that will only affect some residential houses and will be easy to repair, possibly being solved in a few hours. On the contrary, if it is a large-scale cause, like, for example, a hurricane or a terrorist attack, it can originate a large-scale fault, like a blackout or a cascading failure, affecting a large geographical area and possibly taking days or weeks to recover from. Large-scale outages also have serious economic and social consequences that will affect the consumer. In the case of a large-scale outage, a robust system is expected to recover, when compared to a non-robust system, and to have the capacity of restoring to its initial state.
In the litentryrature, three main cause clusters are reported:
- Natural Causes: different types of natural disasters that could lead to a fault in the EPG, such as hurricanes, storms, flooding, earthquakes, tornados, heat waves or solar flares;
- Errors: causes related to human faults or equipment technical malfunction;
- Attacks: cyber-attacks such as denial of service (most common), or human attacks such as terrorism.
These causes, when they occur, can lead to a wide variety of faults in the EPG. In Table 1, different EPG faults are presented, separated into three clusters for each cause that originates the faults. First, there are natural causes, where extreme events like hurricanes, storms or flooding are considered. Second, there are errors, which can be due to human or equipment failure, and third, there are attacks, of cyber or physical origin. Table 1 shows the principal references where these causes/faults are reported.
Table 1. Faults reported in the literature.
|
Causes |
Faults |
Refs |
|
Natural Causes |
- Blackout |
[2,4,8,9,19,38,46–69] |
|
- Cascading fault |
||
|
- Collapse of transmission towers |
||
|
- Damage and faults on substations |
||
|
- Downed wires - Lines disconnected |
||
|
- Fault currents |
||
|
- Fault of distribution and transmission lines |
||
|
- Fault of transformers |
||
|
- Faults and damage to overhead transmission and distribution lines |
||
|
- Flashover of transmission lines |
||
|
- Increased current |
||
|
- Line faults - Power loss |
||
|
- Line overloads |
||
|
- Localized blackouts and momentary interruptions |
||
|
- Short circuits |
||
|
- Stability limits exceeded |
||
|
- Substation flood |
||
|
- Thermal overloads |
||
|
- Transfer capability limited |
||
|
- Transformer slippage on the foundation and fall or complete collapse of the foundation |
||
|
- Underground cable loads affected |
||
|
- Voltage and frequency instabilities |
||
|
Errors |
- Blackout |
[2,7,18,48,49,66,67,70–75] |
|
- Cascading outages |
||
|
- Fault currents |
||
|
- Fault of transformers |
||
|
- Frequency deviation |
||
|
- Hidden faults of protection |
||
|
- Line faults |
||
|
- Line overloads |
||
|
- Voltage and frequency instabilities |
||
|
Attacks |
- Blackout - Cascading failures - Control infrastructures of smart grids affected |
[1,2,9,18,57,62,66,67,76–85] |
|
- Delay, blockage or corruption |
||
|
- Downed wires - Economic and social disruptions |
||
|
- Line faults |
||
|
- Localized blackouts and momentary interruptions |
||
|
- Power loss - Widespread damage |
||
|
Causes |
Faults |
Refs |
|
Natural Causes |
- Blackout |
[1][2][3][4][5][6][7][8][9][10][11][12][13][14][15][16][17][18][19][20][21][22][23][24][25][26][27][28][29][30] |
|
- Cascading fault |
||
|
- Collapse of transmission towers |
||
|
- Damage and faults on substations |
||
|
- Downed wires - Lines disconnected |
||
|
- Fault currents |
||
|
- Fault of distribution and transmission lines |
||
|
- Fault of transformers |
||
|
- Faults and damage to overhead transmission and distribution lines |
||
|
- Flashover of transmission lines |
||
|
- Increased current |
||
|
- Line faults - Power loss |
||
|
- Line overloads |
||
|
- Localized blackouts and momentary interruptions |
||
|
- Short circuits |
||
|
- Stability limits exceeded |
||
|
- Substation flood |
||
|
- Thermal overloads |
||
|
- Transfer capability limited |
||
|
- Transformer slippage on the foundation and fall or complete collapse of the foundation |
||
|
- Underground cable loads affected |
||
|
- Voltage and frequency instabilities |
||
|
Errors |
- Blackout |
[1][31][32][9][10][27][28][33][34][35][36][37][38] |
|
- Cascading outages |
||
|
- Fault currents |
||
|
- Fault of transformers |
||
|
- Frequency deviation |
||
|
- Hidden faults of protection |
||
|
- Line faults |
||
|
- Line overloads |
||
|
- Voltage and frequency instabilities |
||
|
Attacks |
- Blackout - Cascading failures - Control infrastructures of smart grids affected |
[39][1][4][31][18][23][27][28][40][41][42][43][44][45][46][47][48][49] |
|
- Delay, blockage or corruption |
||
|
- Downed wires - Economic and social disruptions |
||
|
- Line faults |
||
|
- Localized blackouts and momentary interruptions |
||
|
- Power loss - Widespread damage |
2. The Origins of Power Grid Faults
In order to analyze all the relations amongst causes and faults in EPGs, a graphical representation using visualization software NodeXL (Social Media Research Foundation, California, CA, USA) was performed, following the strategy adopted in[50][51] [86,87]. With this analysis, it was possible to understand the importance of studying the cause/fault relations and identify less studied areas. For this analysis, a range of 65 articles was studied, and the same article can mention different faults regarding one cause or vice versa, i.e., the same fault can be instigated by different causes. The analysis performed is represented by the graph presented in Figure 1, created using the Force Atlas algorithm[52] [88]. The blue squares denote causes, and the corresponding faults are denoted by green triangles. The size of the elements (squares and triangles) is proportional to the number of times they are discussed in the surveyed literature.
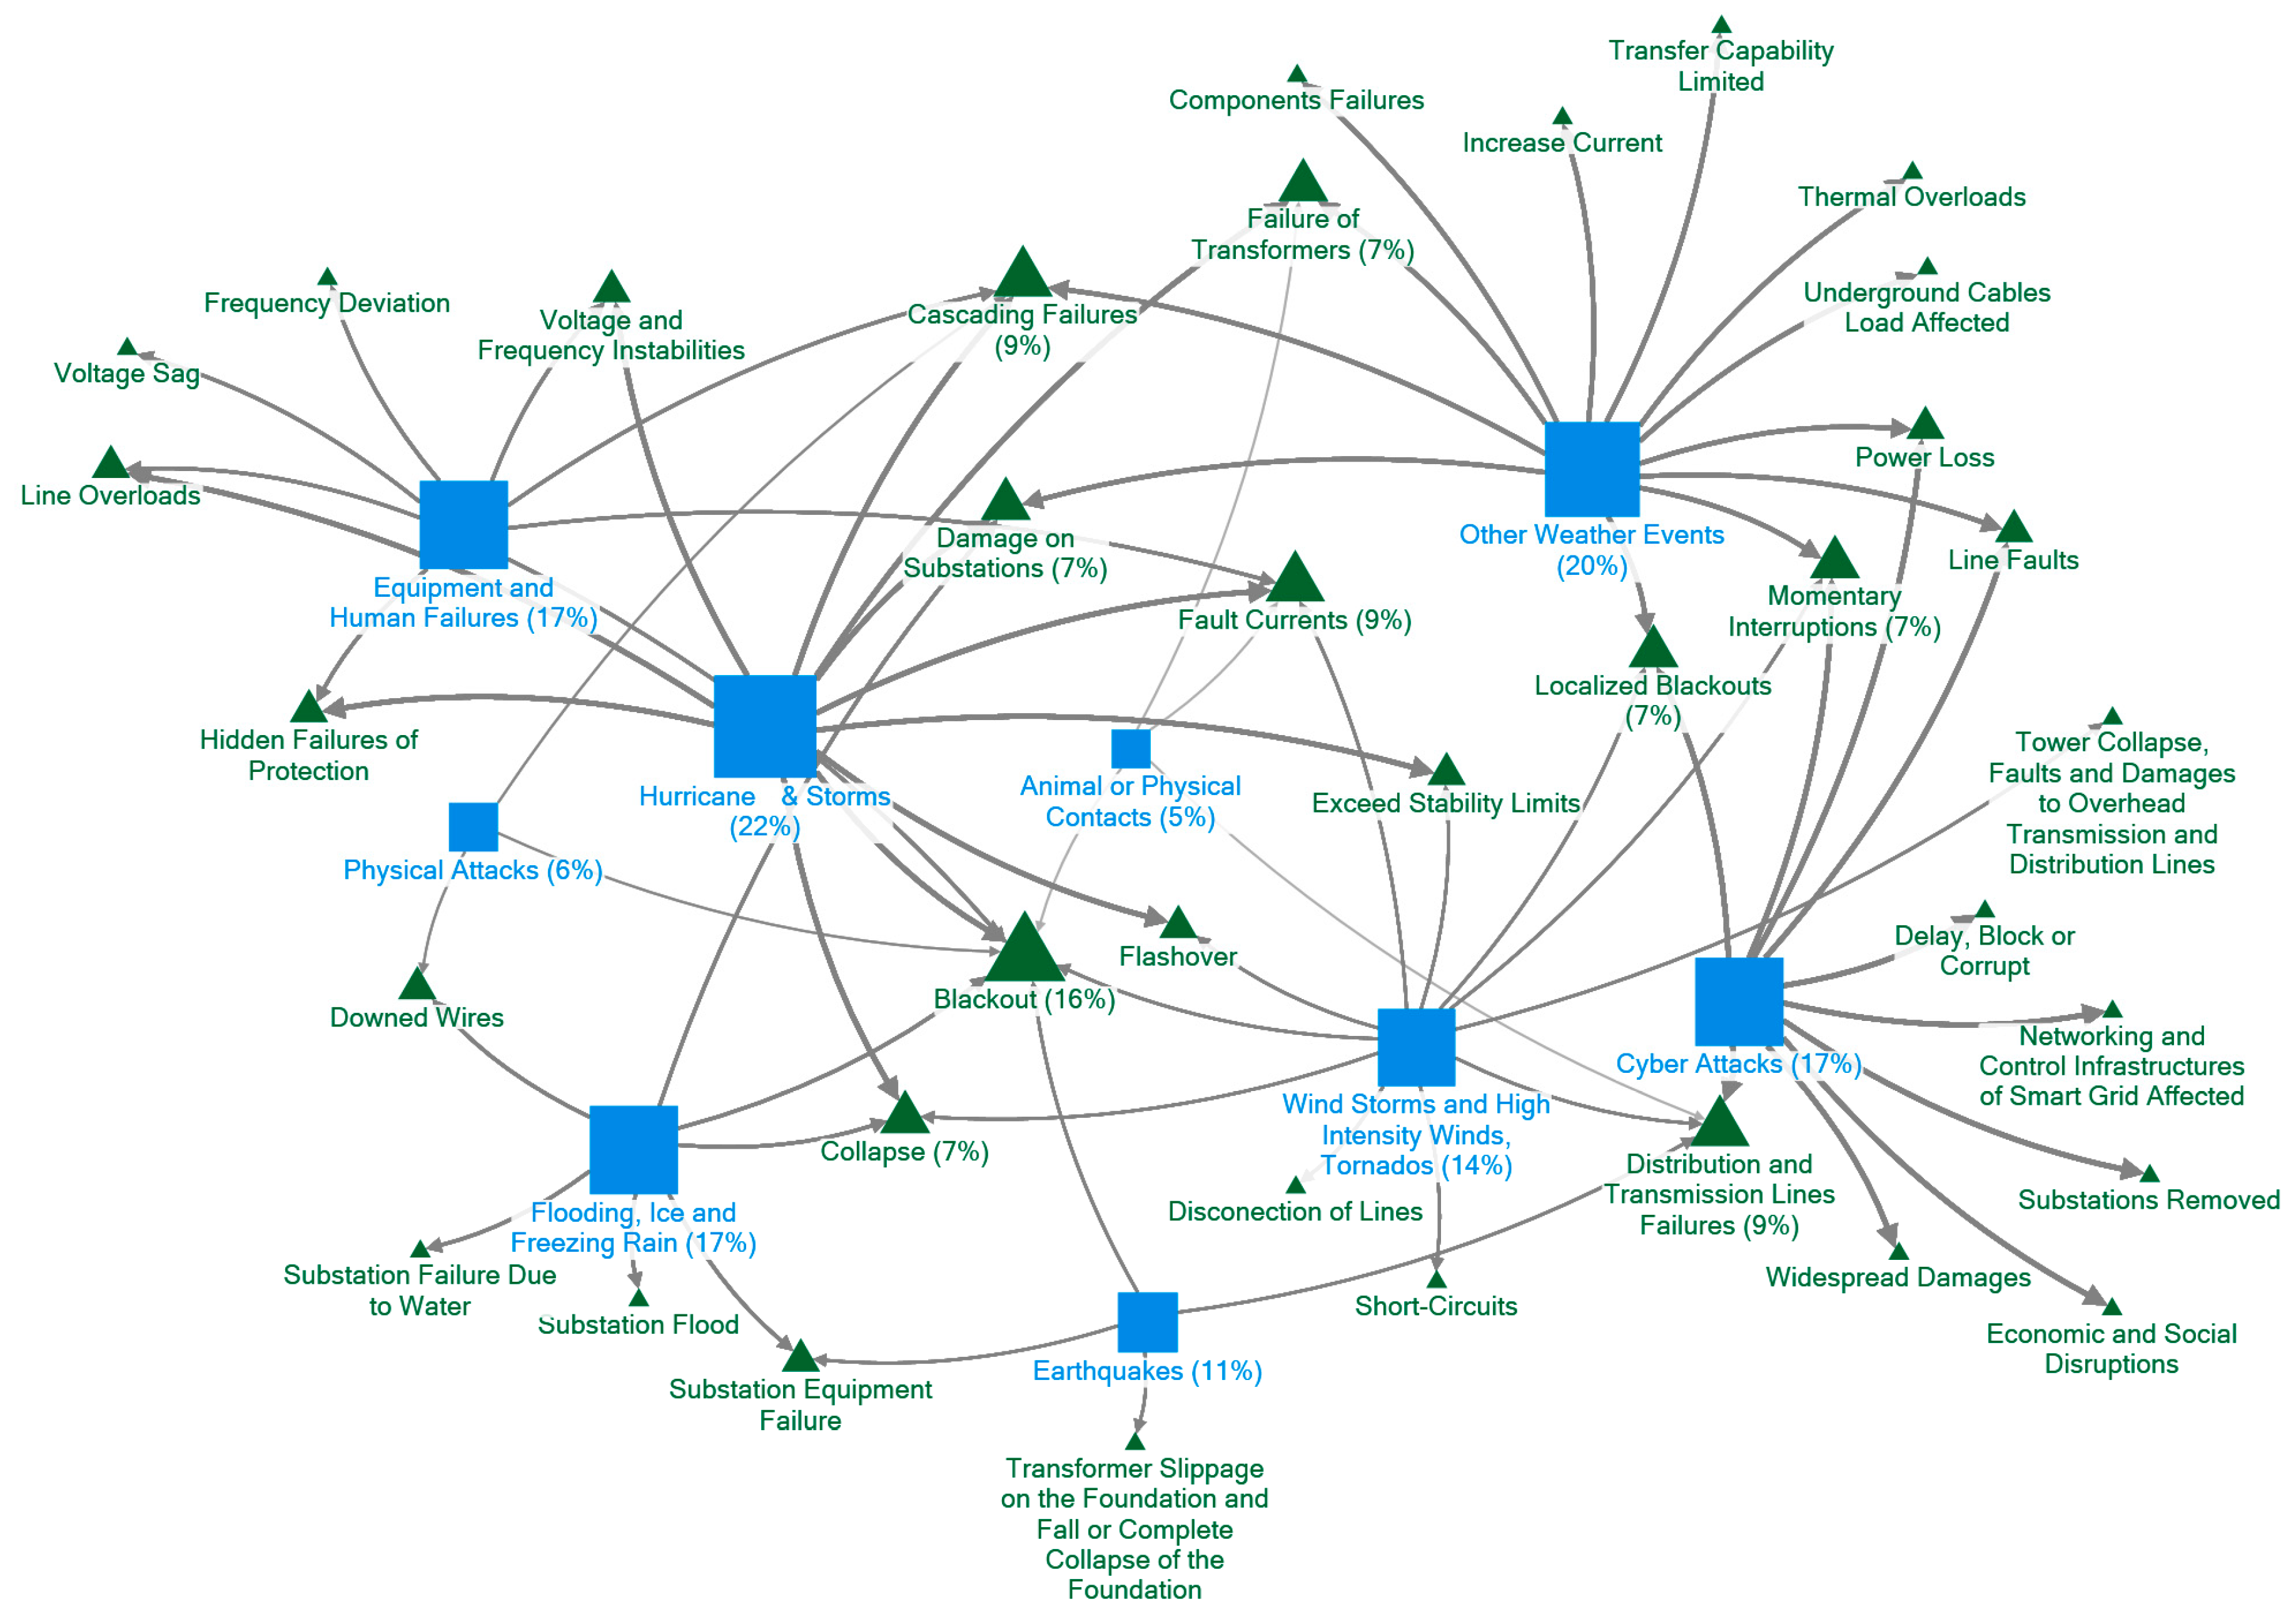
Figure 1. Graphical relationship of EPG faults and causes.
Analyzing Figure 13 and considering the abovementioned clusters, the literature review shows that 84% of articles mention faults due to natural causes. The most referenced natural causes are hurricanes and storms, with 22% of articles mentioning these causes, following by other natural events such as heat waves or thunderstorms, which were studied in 20% of all articles considered in this survey. Still in the natural causes cluster, windstorms and tornados represent a 14% percentage of articles, and earthquakes appear in 11% of the studied articles[15][27][28][29] [54,66–68]. Continuing to the errors cluster, equipment errors and human failures were analyzed together and represent 17% of studied articles, while animal or physical contacts with lines represent only 5% of the articles considered for this survey. Finally, for the attacks cluster, cyber-attacks represent 17% of read articles, a huge percentage when compared with physical attacks, which represent only 6% of the studied literature for this survey[19][30] [58,69].
The abovementioned causes are connected to the resulting faults, represented in Figure 3 by green triangles. As seen before in Table 1, the same fault can be originated by different causes. In Figure 1, the largest triangles represent faults that are mentioned more in the analyzed articles for this survey. Blackout, the fault represented by the largest triangle in Figure 1, was referenced in 16% of the 65 articles studied in this analysis. A detailed observation in Figure 2a, focusing on the blackout green triangle and its connecting lines from causes, shows that some of the lines are thicker than others. For example, the line that connects hurricanes and storms is denser than the line connecting physical attacks, meaning that blackout is more related with hurricanes and storms than with physical attacks.
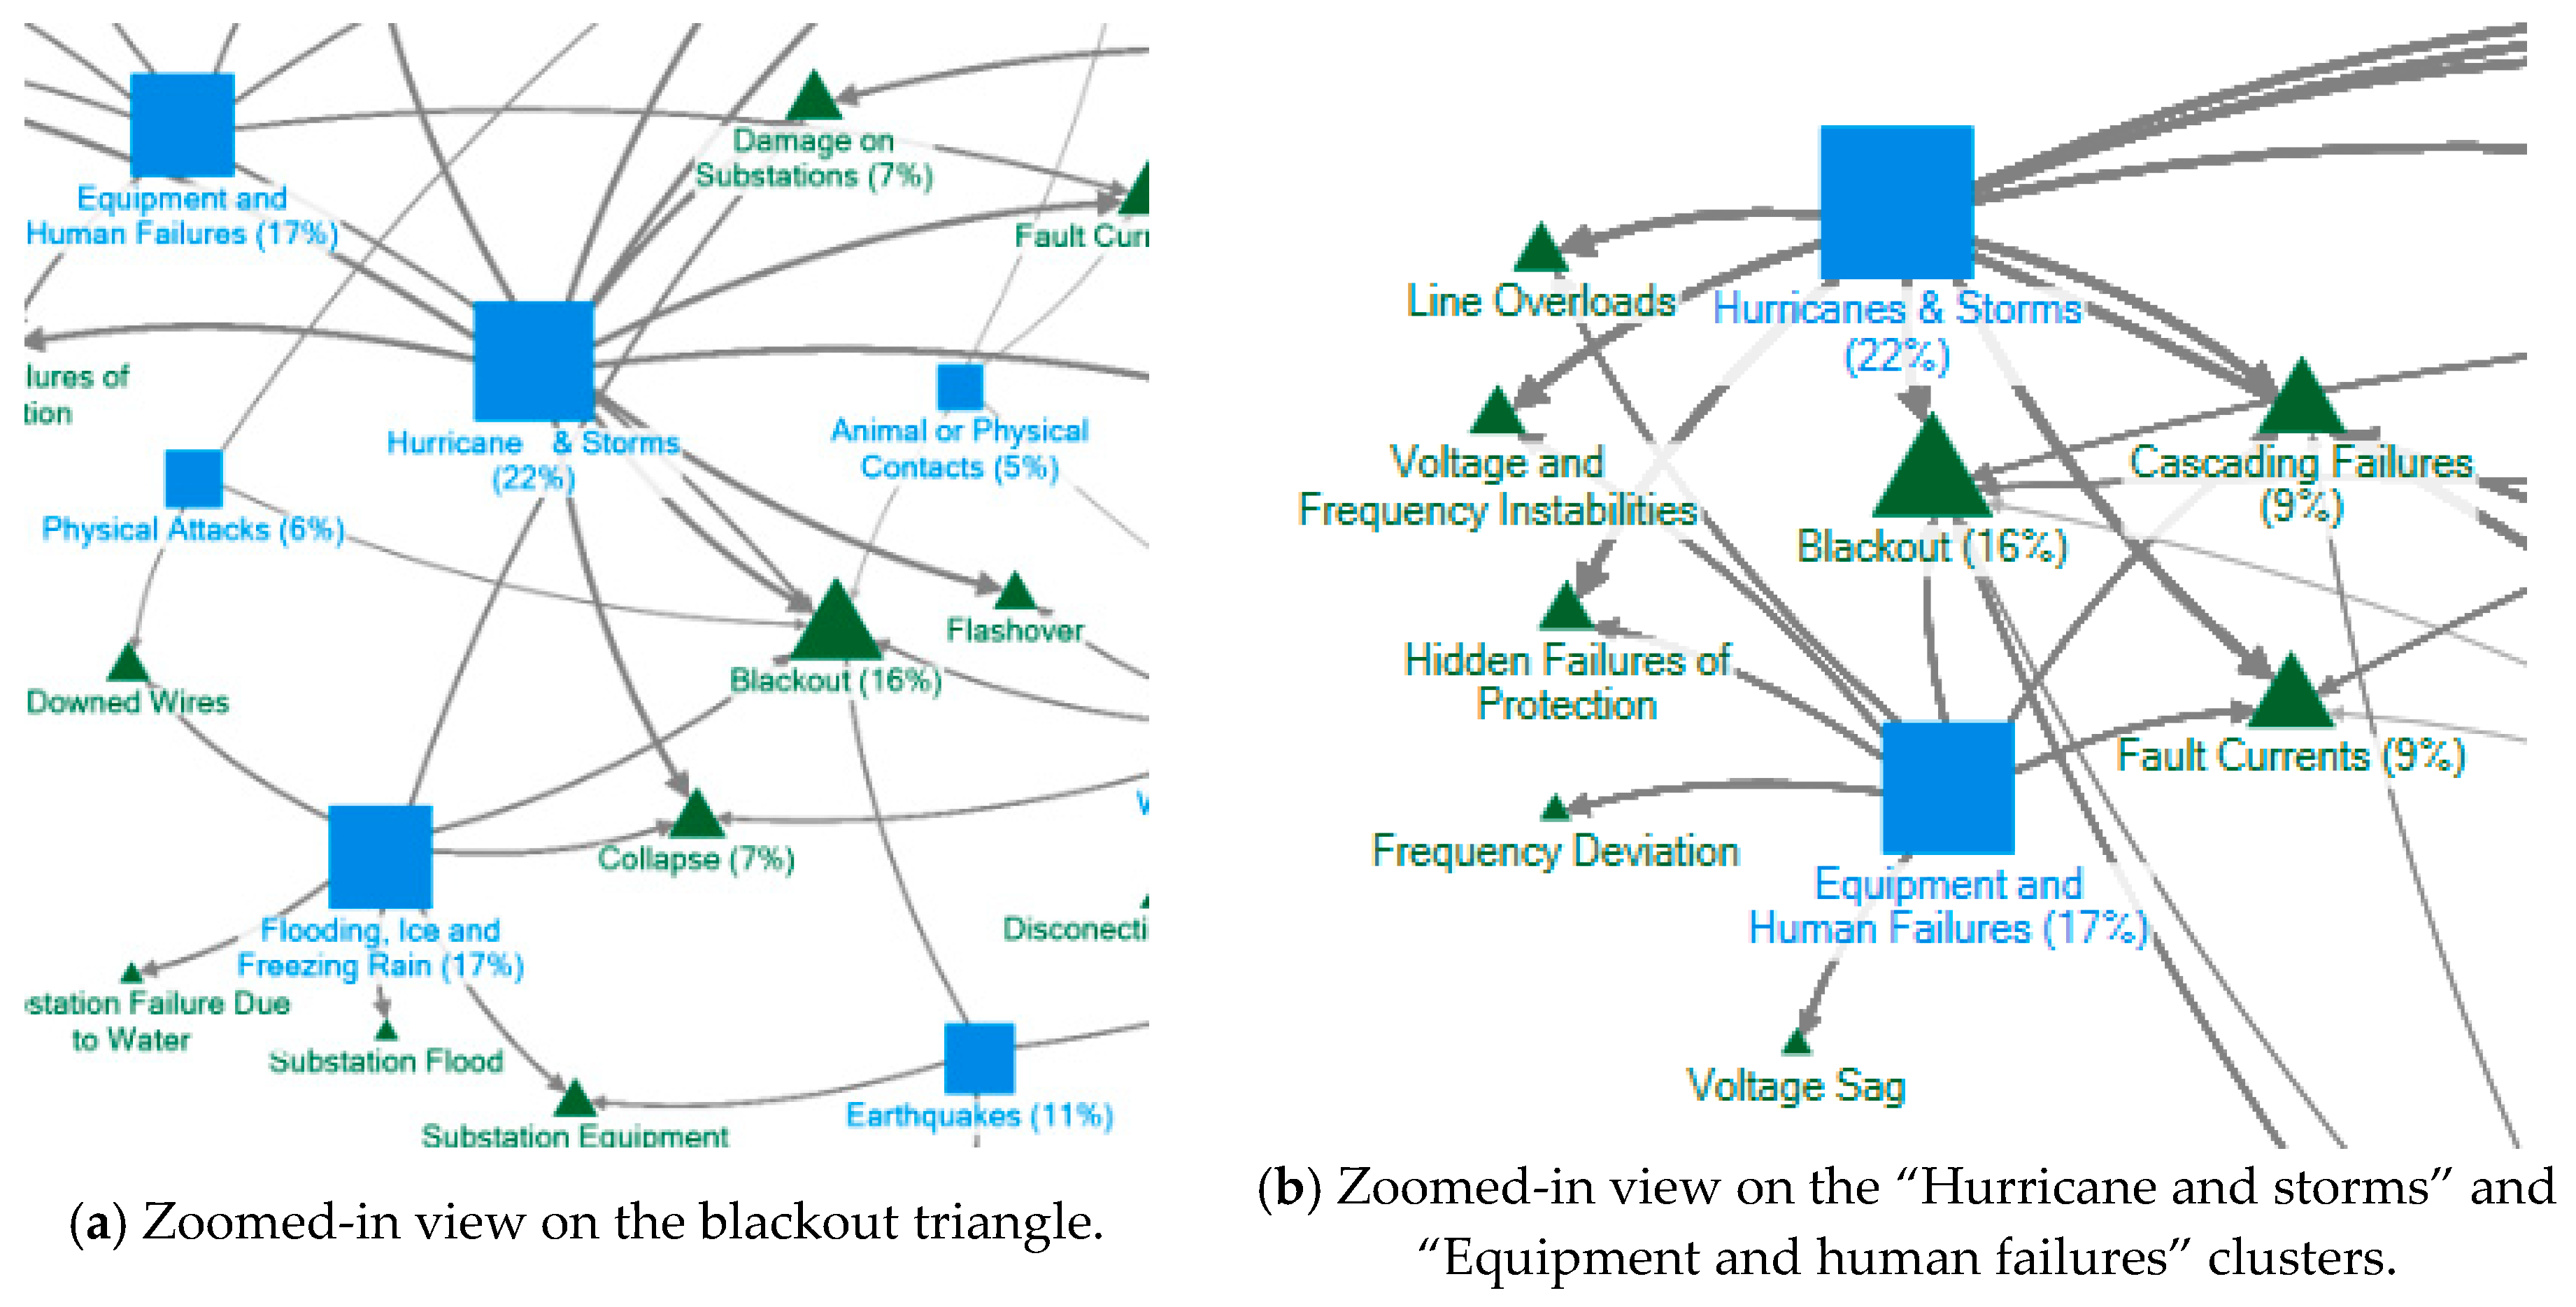
Figure 2. Close-up views of the causes/faults graph.
Also, looking at Figure 2b, both “Hurricane and storms” and “Equipment and human failures”, despite being of different clusters, i.e., natural causes and errors, can originate the same type of faults such as cascading failures and fault currents, the second most referenced faults in studied articles, being mentioned in 9% of them.
This publication can bentry if from found here:https://www.mdpi.com/1996-1073/12/24/4667