The active form of vitamin D, 1α,25-(OH)2D3, not only promotes intestinal calcium absorption, but also regulates the formation of osteoclasts (OCs) and their capacity for bone mineral dissolution. Gal-3 is a newly discovered bone metabolic regulator involved in the proliferation, differentiation, and apoptosis of various cells.
- galectin-3
- 1α
- 25-(OH)2D3
- osteoclasts
- bone resorption
1. Introduction
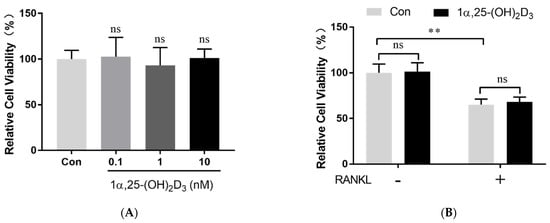
2. 1α,25-(OH)2D3 Had No Effect on Osteoclast Precursor Viability
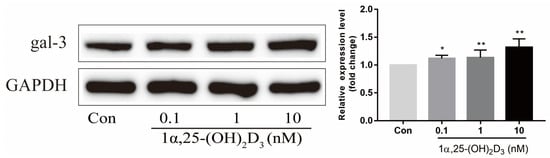
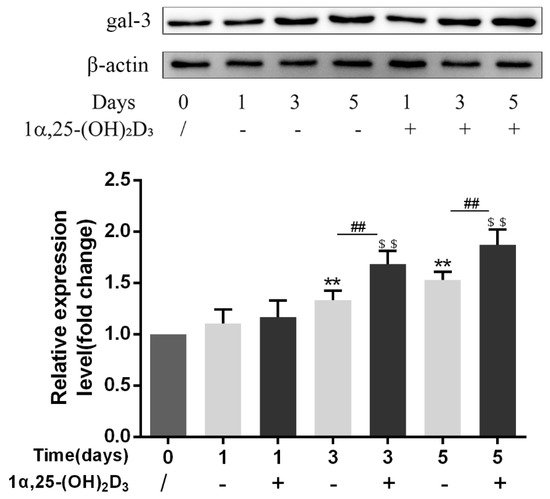
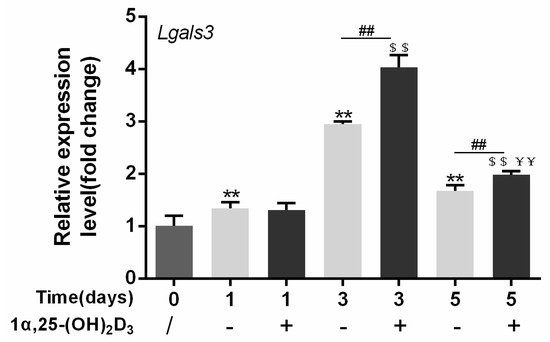
3. 1α,25-(OH)2D3 Promoted Gal-3 Expression
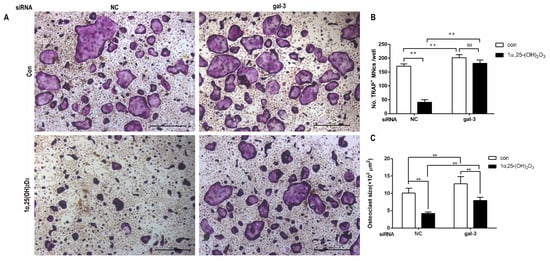
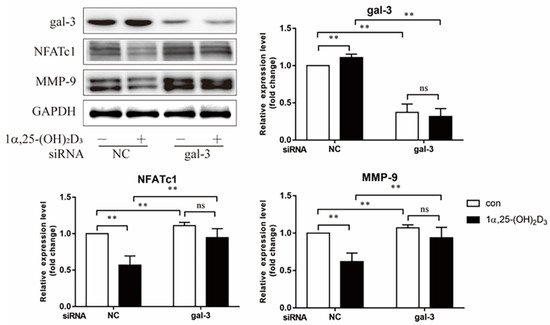
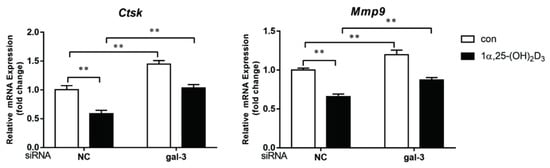
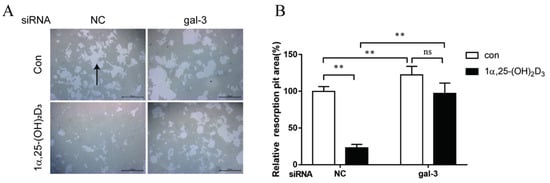
4. Gal-3 Contributed to Osteoclasts Formation and Activation Regulated by 1α,25-(OH)2D3
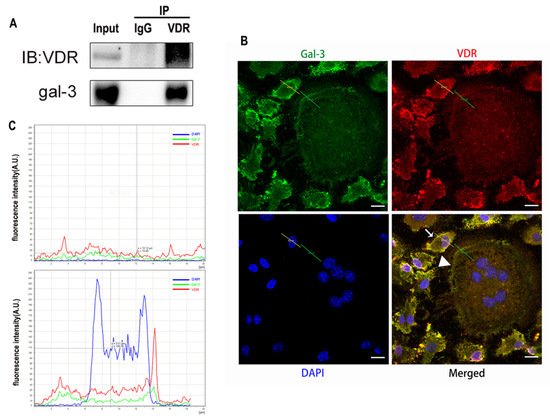
5. Interaction between Gal-3 and VDR
3. Discussion
Vitamin D is known as the anti-rickets vitamin, and the active form 1α,25-(OH)2D3 is involved in a variety of physiological processes. Among these physiological processes, the most important function is the regulation of calcium homeostasis together with PTH. When serum calcium is low, 1α,25-(OH)2D3 acts with PTH to increase calcium absorption from the intestine. If normal calcium cannot be maintained by intestinal calcium absorption, 1α,25-(OH)2D3 will act with PTH to increase the reabsorption of calcium from the kidney and increase calcium release from the bone stores [32]. Kitazawa et al. [33] also reported that 1α,25-(OH)2D3 increases calcium release from bone stores. They confirmed that 1α,25-(OH)2D3 can increase RANKL expression in stromal cells and support osteoclastogenesis indirectly. In addition, 1α,25-(OH)2D3 can also act directly on OCPs and conversely inhibit OC formation. Consistent with our previous results [34], we demonstrated that 1α,25-(OH)2D3 directly inhibited TRAP-positive OC formation. We also confirmed that 1α,25-(OH)2D3 inhibited the expression of OC-related genes and proteins, including Ctsk, MMP-9, and NFATc1 expression. The bone resorption activity of OCs was also inhibited by 1α,25-(OH)2D3. These data are consistent with those previous studies. For example, Sakai et al. [35] also found that 1α,25-(OH)2D3 inhibits OC formation by inhibiting the expression of c-Fos and NFATc1. Kikuta et al. [36] confirmed that 1α,25-(OH)2D3 and its analogue eldecalcitol promoted OPCs migration and inhibited OC formation by regulating the sphingosine1-phosphate (S1P) receptor system. Thus, we hypothesize that 1α,25-(OH)2D3 can both promote and inhibit OC formation under different circumstances to achieve bone health equilibrium based on previous research. Therefore, the effect of 1α,25-(OH)2D3 on bone health and its underlying mechanism should be further elucidated. In a previous study, we found that gal-3 expression changes during OC formation in the presence of 1α,25-(OH)2D3 by chance [23]. Here, we further confirmed that 1α,25-(OH)2D3 increases gal-3 expression at the protein and mRNA levels. We then used gal-3-knockdown OCPs to evaluate OC formation, bone resorption, and the expression of OC-related genes and proteins.
Gal-3 is the only member of chimera-type galectins and is structurally composed of a large N-terminal domain and one carbohydrate recognition domain (CRD). It contains three structurally distinct domains: (1) a short amino terminal consisting of 12 amino acids with a serine phosphorylation site responsible for its translocation [37]; (2) a collagen-alpha-like nearly 110 amino acid long structure rich in proline, alanine, and glycine; and (3) a C-terminal domain with nearly 140 amino acids encompassing the CRD [38]. It participates in a variety of cellular processes, such as proliferation, differentiation, migration, and apoptosis, and has a variety of biological effects, especially in nephropathy, carcinoma, and the quiescence of hematopoietic stem cells [39][40][41]. It is also an important regulator of bone remodeling. Iacobini et al. [42] found that Lgals3−/− OBs and OCs showed impaired terminal differentiation, reduced mineralization capacity, and resorption activity. They confirmed that gal-3 is an essential factor in normal osteocyte differentiation and activity, bone reconstruction, and biomechanical balance. Simon et al. [24] proved that extracellular gal-3 inhibited OC formation and gal-3-deficient bone marrow cells displayed a higher osteoclastogenic capacity. In the present study, we also found that gal-3-knockdown OCPs showed a stronger OC formation capacity and bone resorption capacity than those of normal OCPs. The expression levels of OC-related genes and proteins, including CTSK, MMP-9, and NFATc1, increased after gal-3 knockdown. As reported previously [24], our data also suggested that gal-3 is a negative regulator of OC formation and activation. In this study, we also found that 1α,25-(OH)2D3 not only inhibited OC formation and activation but also increased gal-3 expression in mRNA and protein levels. However, the mRNA expression of gal-3 in day 5 is lower than that in day 3. This might be relative to mRNA translation and characteristic of protein expression. It has been reported that some of the gal-3 crossed the membrane and translocated into the intracellular vesicles and/or directly onto the cell surface. Furthermore, cell surface-bound and extracellular gal-3 may re-enter the cell by endocytosis and take part in a recycling loop, and is then found in the vesicular non-cytosolic compartments [43]. This may be the cause of the inconsistent expression of gal-3 protein and mRNA, which needs further investigation. When gal-3 expression was inhibited by small interfering RNAs, the inhibitory effect of 1α,25-(OH)2D3 on OC formation and activation was significantly alleviated. These data suggest that gal-3 contributes to 1α,25-(OH)2D3-mediated OC formation and activity. Immunoprecipitation and immunofluorescence assays supported the interaction between gal-3 and VDR protein, further demonstrating that gal-3 might participate in OC formation and activation via interaction with VDR induced by 1α,25-(OH)2D3. However, Nakajima et al. [22] suggested that intact gal-3 promotes OC formation, whereas cleaved gal-3 inhibits OC formation. Therefore, the role of gal-3 in the regulation of OC formation and activation by vitamin D remains to be elucidated. In any case, gal-3 is a potential new target for the prevention of bone disease and maintenance of calcium homeostasis.4. Materials and Methods
4.1. Isolation and Culture of Osteoclast Precursors
The isolation and culture of OCPs were based on our previously reported methods with slight improvements [44]. C57BL/6 mice (5–6 weeks old) purchased from the Laboratory Animal Center of Yangzhou University were euthanized. The tibias and femurs were dislocated and the muscles were discarded. The protocol was approved by the Animal Care and Use Committee of Yangzhou University (SYXK[Su], July 20th, 2017] and was carried out in accordance with the Guide for the Care and Use of Laboratory Animals of the National Research Council. The tibias and femurs were cut longitudinally. The bone cavities were flushed with serum-free α-MEM (Gibco, Carlsbad, CA, USA) until they appeared empty. A 1 mL Pasteur pipette and 200 mesh sterile screen were used to disperse any cell aggregates. The liquid was then centrifuged for 10 min at 300× g. The cells that deposited at the bottom of the tube were collected, and red blood cells were removed using ACK Lysing Buffer (Thermo Fisher Scientific, Asheville, NC, USA). Cells were then suspended in α-MEM supplemented with 10% fetal bovine serum (FBS) (Gibco, Carlsbad, CA, USA) and 25 ng/mL M-CSF (416-ML-050, R&D Systems, Minneapolis, MN, USA). The cells were cultured overnight in an incubator at 37 °C under 5% CO2. The supernatant of the culture medium was carefully collected and centrifuged at 500× g for 5 min to obtain BMMs. Then, BMMs were seeded in α-MEM supplemented with 10% FBS and 25 ng/mL M-CSF. They were also incubated at 37°C in 5% CO2. On day 3, suspended cells were removed, and adherent cells were regarded as OCPs.
4.2. Cell Viability Detection by CCK-8
After the treatment with 25 ng/mL M-CSF for proliferation, 50 ng/mL RANKL (462-TEC-010, R&D Systems) and different concentrations of 1α,25-(OH)2D3 (0.1, 1, and 10 nmol/L) (D5310, Sigma-Aldrich, St. Louis, MO, USA) were added to the culture medium. Anhydrous alcohol was used as a control (0 nmol/L 1α,25-(OH)2D3). Cell viability was determined using the Cell Counting Kit-8 (CCK-8) (Dojindo, Kumamoto, Kyushu, Japan).
4.3. Cell Transfection
For transfection experiments, mouse BMMs seeded in 6-well plates were pre-treated with 25 ng/mL M-CSF for 2 days. They were then transfected with gal-3 or negative control (NC) siRNA for 1 d according to the supplier’s protocol (sc-35443, 36869, Santa Cruz Biotechnology, Santa Cruz, CA, USA) in the presence of 25 ng/mL M-CSF. The end of transfection was regarded as time zero. At this point, 50 ng/mL RANKL was added to 25 ng/mL M-CSF to induce OC formation in each group. The cells were divided into four groups as follows (Figure 11): NC siRNA + anhydrous alcohol (solvent), NC siRNA + 1α,25-(OH)2D3, gal-3 siRNA + anhydrous alcohol, and gal-3 siRNA + 1α,25-(OH)2D3. The medium was changed every 2 days.
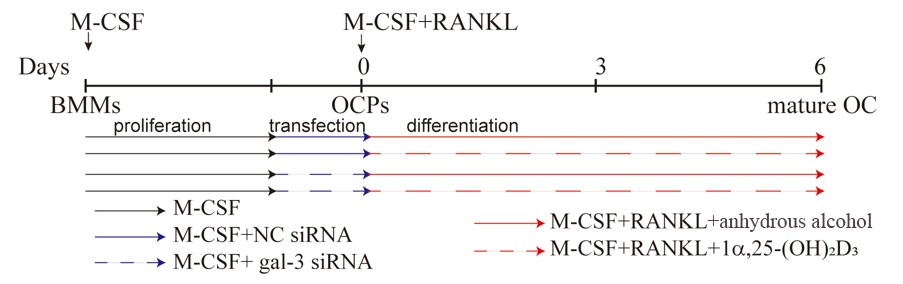 Figure 11. Timeline of cell transfection and the treatment with 1α,25-(OH)2D3. The black solid line represents M-CSF, the blue solid line represents M-CSF+NC siRNA, the blue dashed line represents M-CSF+gal-3 siRNA, the red solid line represents M-CSF+RANKL, and the red dashed line represents M-CSF+RANKL+1α,25-(OH)2D3.
4.4. Formation and Identification of Osteoclasts
According to previously reported methods [45][46], 25 ng/L M-CSF and 50 ng/L RANKL were used to induce OC formation. TRAP staining and bone resorption were observed to identify OC formation. OCPs were cultured in α-MEM supplemented with 10% FBS, 25 ng/mL M-CSF, and 50 ng/mL RANKL for 6 days. The cells were fixed in 4% paraformaldehyde solution for 10 min and washed with phosphate-buffered saline (PBS). They were then stained using the TRAP Staining Kit (Sigma-Aldrich) following the manufacturer’s instructions. Cells with more than three nuclei and wine-colored granules in the cytoplasm were regarded as OCs. For bone resorption, PBS was used to repeatedly wash the plates to remove the adherent cells from Corning Osteoassay Surface Multiple Well Plates (Corning, NY, USA). Images were obtained using an inverted microscope (Leica, Wetzlar, Hessen, Germany). Image-Pro Plus (JEDA Science Technology Development, Nanjing, China) was used to calculate the bone resorption pit area.
4.5. Western Blotting
According to our previously described methods [46], OCs were lysed on ice for 30 min using radio immunoprecipitation assay (RIPA) lysis buffer (Applygen, Beijing, China) with protease inhibitor (Beyotime, Shanghai, China). The protein concentration in each sample was measured using the BCA Protein Assay Kit (Beyotime) and normalized. Proteins were separated by SDS-PAGE (NCM Biotech, Suzhou, China) and transferred to polyvinylidene difluoride (PVDF) membranes (Millipore, Billerica, MA, USA). Then, the PVDF membranes were blocked with 5% bovine serum albumin (BSA) (Sigma-Aldrich) at room temperature for 2 h and incubated with anti-gal-3 (Proteintech, Rosemont, IL, USA), anti-NFATc1 (Santa Cruz Biotechnology), anti-MMP-9 (Abcam, Boston, MA, USA), anti-GAPDH, and anti-β-actin (CST, Danvers, MA, USA) antibodies overnight at 4 °C. Secondary antibodies with horseradish peroxidase (Jackson Laboratories, Bar Harbor, ME, USA) were added to the PVDF, which was washed with Tris-buffered saline and Tween (TBST). Proteins were visualized using a Tanon 5200 Electrochemiluminescence (ECL) Detection System (Tanon, Shanghai, China). ImageJ (National Institute of Mental Health, Bethesda, MD, USA) was used to analyze protein expression levels.
4.6. Quantitative Real-Time Polymerase Chain Reaction (qPCR)
RNA was extracted by TRIzol reagent (Invitrogen, Carlsbad, CA, USA). cDNA was synthesized using HiScript QRT SuperMix (Vazyme, Nanjing, China), and then qPCR was conducted using ChamQ SYBR qPCR Master Mix (Vazyme) according to the manufacturer's instructions. Primer sequences were designed based on Ctsk, MMP-9, Lgals3, and Gapdh gene sequences searched from NCBI of mouse and are shown in Table 1. Gapdh expression was used as an internal control. The cycle reaction was set at 95 °C for 10 s and 60 °C for 30 s for 40 cycles.
Table 1. Sequences of PCR primers used in this study.
Genes |
Sequences |
|
Lgals3 |
Forward (5′-3′) |
GTACAGCTAGCGGAGCGG |
Reverse(5′-3′) |
CGGATATCCTTGAGGGTTTG |
|
Ctsk |
Forward (5′-3′) |
CGCCTGCGGCATTACCAA |
Reverse(5′-3′) |
TAGCATCGCTGCGTCCCT |
|
Mmp-9 |
Forward (5′-3′) |
GCCCTGGAACTCACACGACA |
Reverse(5′-3′) |
TTGGAAACTCACACGCCAGAAG |
|
Gapdh |
Forward (5′-3′) |
AAATGGTGAAGGTCGGTGTG |
Reverse(5′-3′) |
TGAAGGGGTCGTTGATGG |
4.7. Co-immunoprecipitation
Co-immunoprecipitation studies were performed using previously described methods, with slight modifications [47]. Extracts of about 200 μg of protein per sample were precleared with protein A/G beads and then mixed with 2 μg of VDR antibody or control non-immune rabbit Ig immobilized on protein A/G beads in an“immunoprecipitation buffer” supplemented with protease inhibitors. The reactions were then incubated overnight at 4 °C. After being washed three times with 0.1% PBS-Tween, proteins degenerated by SDS buffer were resolved by SDS-PAGE and transferred onto PVDF membranes. The Western blotting was then probed with antibodies against gal-3 at 4 °C overnight.
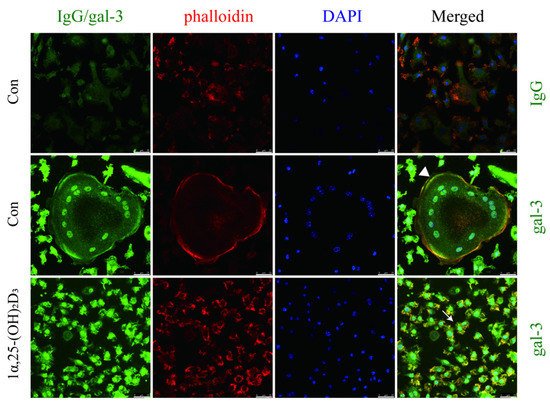
4.8. Immunofluorescent Staining of VDR and Gal-3
OCs cultured on sterile coverslips were washed with PBS. They were fixed with a 4% paraformaldehyde solution. Triton X-100 (0.5%, Amresco, Solon, OH, USA) was used for membrane permeabilization at room temperature. Cells were blocked with 5% BSA and incubated with anti-gal-3 and anti-VDR antibodies overnight at 4 °C. An IgG negative control was set. Phalloidin-iFluor 555 Reagent (Abcam) was used to detect F-actin, and nuclei were visualized with DAPI (Beyotime) according to the manufacturer’s instructions. Imaging was performed using a fluorescence microscope (Leica DMI3000B; Wetzlar). Immunofluorescent co-located figures were analyzed by Leica software, and a line segment from the top left to the bottom right. The point in the upper left is the origin, the x-axis represents the distance from the origin, and the y-axis represents the intensity of fluorescence. The green line across OCs which fluorescence intensity presented in the Figure 6B first figure, and the yellow line across OCPs which fluorescence intensity presents in the Figure 6B second figure. The red curve represents VDR, the green curve represents gal-3, and the blue curve represents the nucleus.
4.9. Statistical Analysis
Statistical analysis of all data was performed using GraphPad Prism 7 (GraphPad Software). Each experiment was repeated at least three times in vitro. Statistical significance was defined as p < 0.05.
5. Conclusions
In our study, we confirmed the regulatory effects of the 1α,25-(OH)2D3/VDR/gal-3 axis on the osteoclastogenesis potential of BMMs. OC formation and activation induced by RANKL via gal-3 was inhibited by 1α,25-(OH)2D3, which is a negative regulator of OC formation and activation. Figure 12 provides a visual overview of the detailed mechanism underlying OC formation and activation revealed in our study.
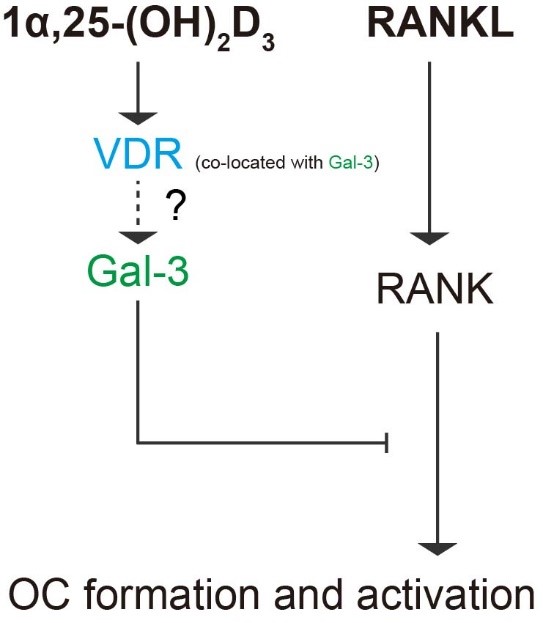
Figure 12. Schematic diagram of the role of gal-3 in OC formation and activation regulated by 1α,25-(OH)2D3. Briefly, 1α,25-(OH)2D3 inhibited OC formation and activation induced by RANKL and increased gal-3 expression. Gal-3, a negative regulator of OC formation and activation, colocalized with VDR and contributed to the inhibitory effect of 1α,25-(OH)2D3 on OC formation and activation.
References
- William J. Boyle; W. Scott Simonet; David L. Lacey; Osteoclast differentiation and activation. Nature 2003, 423, 337-342, 10.1038/nature01658.
- Megan M. Weivoda; Chee Kian Chew; David G. Monroe; Joshua N. Farr; Elizabeth J. Atkinson; Jennifer R. Geske; Brittany Eckhardt; Brianne Thicke; Ming Ruan; Amanda J. Tweed; et al.Louise K. McCreadyRobert A. RizzaAleksey MatveyenkoMoustapha KassemThomas Levin AndersenAdrian VellaMatthew T. DrakeBart L. ClarkeMerry Jo OurslerSundeep Khosla Identification of osteoclast-osteoblast coupling factors in humans reveals links between bone and energy metabolism. Nature Communications 2020, 11, 1-13, 10.1038/s41467-019-14003-6.
- Brendan F. Boyce; Advances in osteoclast biology reveal potential new drug targets and new roles for osteoclasts. Journal of Bone and Mineral Research 2013, 28, 711-722, 10.1002/jbmr.1885.
- Anaïs Marie Julie Møller; Jean-Marie Delaissé; Jacob Bastholm Olesen; Jonna Skov Madsen; Luisa Matos Canto; Troels Bechmann; Silvia Regina Rogatto; Kent Søe; Aging and menopause reprogram osteoclast precursors for aggressive bone resorption. Bone Research 2020, 8, 1-11, 10.1038/s41413-020-0102-7.
- K P McHugh; Z. Shen; T N Crotti; M R Flannery; R P O'sullivan; P E Purdue; S R Goldring; The role of cell-substrate interaction in regulating osteoclast activation: potential implications in targeting bone loss in rheumatoid arthritis. Annals of the Rheumatic Diseases 2009, 69, i83-i85, 10.1136/ard.2009.120188.
- Jianjiao Ni; Xiaofei Zhang; Juan Li; Zhiqin Zheng; Junhua Zhang; Weixin Zhao; Liang Liu; Tumour-derived exosomal lncRNA-SOX2OT promotes bone metastasis of non-small cell lung cancer by targeting the miRNA-194-5p/RAC1 signalling axis in osteoclasts. Cell Death & Disease 2021, 12, 1-10, 10.1038/s41419-021-03928-w.
- Aseel Marahleh; Hideki Kitaura; Fumitoshi Ohori; Akiko Kishikawa; Saika Ogawa; Wei-Ren Shen; Jiawei Qi; Takahiro Noguchi; Yasuhiko Nara; Itaru Mizoguchi; et al. TNF-α Directly Enhances Osteocyte RANKL Expression and Promotes Osteoclast Formation. Frontiers in Immunology 2019, 10, 2925, 10.3389/fimmu.2019.02925.
- Cheng-Ming Wei; Yi-Ji Su; Xiong Qin; Jia-Xin Ding; Qian Liu; Fang-Ming Song; Shao-Hui Zong; Jiake Xu; Bo Zhou; Jin-Min Zhao; et al. Monocrotaline Suppresses RANKL-Induced Osteoclastogenesis In Vitro and Prevents LPS-Induced Bone Loss In Vivo. Cellular Physiology and Biochemistry 2018, 48, 644-656, 10.1159/000491892.
- Steven Teitelbaum; F. Patrick Ross; Genetic regulation of osteoclast development and function. Nature Reviews Genetics 2003, 4, 638-649, 10.1038/nrg1122.
- Chengchao Song; Xiaobin Yang; Yongsheng Lei; Zhen Zhang; Wanli Smith; Jinglong Yan; Lingbo Kong; Evaluation of efficacy on RANKL induced osteoclast from RAW264.7 cells. Journal of Cellular Physiology 2018, 234, 11969-11975, 10.1002/jcp.27852.
- Sylvia Christakos; Puneet Dhawan; Angela Porta; Leila J. Mady; Tanya Seth; Vitamin D and intestinal calcium absorption. Molecular and Cellular Endocrinology 2011, 347, 25-29, 10.1016/j.mce.2011.05.038.
- Jianhong Gu; Xi-Shuai Tong; Guo-Hong Chen; Dong Wang; Yang Chen; Yan Yuan; Xue-Zhong Liu; Jian-Chun Bian; Zong-Ping Liu; Effects of 1α,25-(OH)2D3 on the formation and activity of osteoclasts in RAW264.7 cells. The Journal of Steroid Biochemistry and Molecular Biology 2015, 152, 25-33, 10.1016/j.jsbmb.2015.04.003.
- J. Wesley Pike; Sylvia Christakos; Biology and Mechanisms of Action of the Vitamin D Hormone. Endocrinology and Metabolism Clinics of North America 2017, 46, 815-843, 10.1016/j.ecl.2017.07.001.
- Tomoki Mori; Kanji Horibe; Masanori Koide; Shunsuke Uehara; Yoko Yamamoto; Shigeaki Kato; Hisataka Yasuda; Naoyuki Takahashi; Nobuyuki Udagawa; Yuko Nakamichi; et al. The Vitamin D Receptor in Osteoblast-Lineage Cells Is Essential for the Proresorptive Activity of 1α,25(OH)2D3 In Vivo. Endocrinology 2020, 161, bqaa178, 10.1210/endocr/bqaa178.
- Renata C. Pereira; Isidro B. Salusky; Richard E. Bowen; Earl G. Freymiller; Katherine Wesseling-Perry; Vitamin D sterols increase FGF23 expression by stimulating osteoblast and osteocyte maturation in CKD bone. Bone 2019, 127, 626-634, 10.1016/j.bone.2019.07.026.
- Naoyuki Takahashi; Nobuyuki Udagawa; Tatsuo Suda; Vitamin D endocrine system and osteoclasts. BoneKEy Reports 2014, 3, 495, 10.1038/bonekey.2013.229.
- Jianhong Gu; Xishuai Tong; Yang Chen; Chuang Zhang; Tianhong Ma; Saihui Li; Wenyan Min; Yan Yuan; Xuezhong Liu; Jianchun Bian; et al.Zongping Liu Vitamin D Inhibition of TRPV5 Expression During Osteoclast Differentiation. International Journal of Endocrinology and Metabolism 2019, 17, e91583, 10.5812/ijem.91583.
- Jumpei Teramachi; Yuko Hiruma; Seiichi Ishizuka; Hisako Ishizuka; Jacques P. Brown; Laëtitia Michou; Huiling Cao; Deborah L. Galson; Mark A Subler; Hua Zhou; et al.David W DempsterJolene J WindleG. David RoodmanNoriyoshi Kurihara Role of ATF7-TAF12 interactions in the vitamin D response hypersensitivity of osteoclast precursors in Paget's disease. Journal of Bone and Mineral Research 2013, 28, 1489-1500, 10.1002/jbmr.1884.
- M. Kogawa; D.M. Findlay; P.H. Anderson; G.J. Atkins; Modulation of osteoclastic migration by metabolism of 25(OH)-vitamin D3. The Journal of Steroid Biochemistry and Molecular Biology 2013, 136, 59-61, 10.1016/j.jsbmb.2012.09.008.
- Colnot, C.; Sidhu, S.S.; Poirier, F.; Balmain, N; Cellular and subcellular distribution of galectin-3 in the epiphyseal cartilage and bone of fetal and neonatal mice. Cell Mol Biol 1999, 45, 1191-1202.
- Jane E. Aubin; F. Liu; Luc Malaval; A.K. Gupta; Osteoblast and chondroblast differentiation. Bone 1995, 17, S77-S83, 10.1016/8756-3282(95)00183-e.
- Kosei Nakajima; Dhong Hyo Kho; Takashi Yanagawa; Yosuke Harazono; Victor Hogan; Wei Chen; Rouba Ali-Fehmi; Rohit Mehra; Avraham Raz; Galectin-3 Cleavage Alters Bone Remodeling: Different Outcomes in Breast and Prostate Cancer Skeletal Metastasis.. Cancer Research 2016, 76, 1391-402, 10.1158/0008-5472.CAN-15-1793.
- Gu, J.; Kong, Q.; Wang, D.; Tong, X.; Bian, J.; Liu, X.; Yuan, Y.; Liu, Z; Deferential protein expressions and bioinformatic analysis of OC fromation regulated by vitamin D. Chinese Journal of Veterinary Science (in chinese) 2019, 39, 2207-2214.
- Dominic Simon; Anja Derer; Fabian T. Andes; Patrick Lezuo; Aline Bozec; Georg Schett; Martin Herrmann; Ulrike Harre; Galectin-3 as a novel regulator of osteoblast-osteoclast interaction and bone homeostasis. Bone 2017, 105, 35-41, 10.1016/j.bone.2017.08.013.
- Gu, J.; Zhang, C.; Min, W.; ZHao, Y.; Li, S.; Liu, Z; Effects of 1α,25-(OH)2D3 on osteoclastogenesis and activity in mice. Chinese Journal of Veterinary Science (in chinese) 2019, 49, 593-600.
- Lacey, D.L.; Timms, E.; Tan, H.L.; Kelley, M.J.; Dunstan, C.R.; Burgess, T.; Elliott, R.; Colombero, A.; Elliott, G.; Scully, S.; et al.et al Osteoprotegerin ligand is a cytokine that regulates osteoclast differentiation and activation. Cell 1998, 93, 165-176.
- Paola Spessotto; Francesca Maria Rossi; Massimo Degan; Raffaele Di Francia; Roberto Perris; Alfonso Colombatti; Valter Gattei; Hyaluronan–CD44 interaction hampers migration of osteoclast-like cells by down-regulating MMP-9. Journal of Cell Biology 2002, 158, 1133-1144, 10.1083/jcb.200202120.
- Saki Nakagawa; Kazuhiro Omori; Masaaki Nakayama; Hiroki Mandai; Satoshi Yamamoto; Hiroya Kobayashi; Hidefumi Sako; Kyosuke Sakaida; Hiroshi Yoshimura; Satoki Ishii; et al.Soichiro IbaragiKimito HiraiKeisuke YamashiroTadashi YamamotoSeiji SugaShogo Takashiba The fungal metabolite (+)-terrein abrogates osteoclast differentiation via suppression of the RANKL signaling pathway through NFATc1. International Immunopharmacology 2020, 83, 106429, 10.1016/j.intimp.2020.106429.
- Takayanagi, H.; Kim, S.; Koga, T.; Nishina, H.; Isshiki, M.; Yoshida, H.; Saiura, A.; Isobe, M.; Yokochi, T.; Inoue, J.; et al.et al Induction and activation of the transcription factor NFATc1 (NFAT2) integrate RANKL signaling in terminal differentiation of osteoclasts. Dev Cell 2002, 3, 889-901.
- Masakazu Kogawa; Koji Hisatake; Gerald Atkins; David M. Findlay; Yuichiro Enoki; Tsuyoshi Sato; Peter C. Gray; Yukiko Kanesaki-Yatsuka; Paul Anderson; Seiki Wada; et al.Naoki KatoAya FukudaShigehiro KatayamaMasafumi TsujimotoTetsuya YodaTatsuo SudaYasushi OkazakiMasahito Matsumoto The Paired-box Homeodomain Transcription Factor Pax6 Binds to the Upstream Region of the TRAP Gene Promoter and Suppresses Receptor Activator of NF-κB Ligand (RANKL)-induced Osteoclast Differentiation. Journal of Biological Chemistry 2013, 288, 31299-31312, 10.1074/jbc.m113.461848.
- Denis Duplat; Marlène Gallet; Sophie Berland; Arul Marie; Lionel Dubost; Marthe Rousseau; Said Kamel; Christian Milet; Michel Brazier; Evelyne Lopez; et al.Laurent Bedouet The effect of molecules in mother-of-pearl on the decrease in bone resorption through the inhibition of osteoclast cathepsin K. Biomaterials 2007, 28, 4769-4778, 10.1016/j.biomaterials.2007.07.036.
- Vaishali Veldurthy; Ran Wei; Leyla Oz; Puneet Dhawan; Yong Heui Jeon; Sylvia Christakos; Vitamin D, calcium homeostasis and aging. Bone Research 2016, 4, 16041, 10.1038/boneres.2016.41.
- Riko Kitazawa; Kiyoshi Mori; Akira Yamaguchi; Takeshi Kondo; Sohei Kitazawa; Modulation of mouse RANKL gene expression by Runx2 and vitamin D3. Journal of Cellular Biochemistry 2008, 105, 1289-1297, 10.1002/jcb.21929.
- Dong Wang; Jian-Hong Gu; Yang Chen; Hong-Yan Zhao; Wei Liu; Rui-Long Song; Jian-Chun Bian; Xue-Zhong Liu; Yan Yuan; Zong-Ping Liu; et al. 1α,25-Dihydroxyvitamin D3 inhibits the differentiation and bone resorption by osteoclasts generated from Wistar rat bone marrow-derived macrophages. Experimental and Therapeutic Medicine 2015, 10, 1039-1044, 10.3892/etm.2015.2632.
- Sadaoki Sakai; Hironari Takaishi; Kenichiro Matsuzaki; Hironori Kaneko; Mitsuru Furukawa; Yoshiteru Miyauchi; Ayako Shiraishi; Keiji Saito; Akio Tanaka; Tadatsugu Taniguchi; et al.Toshio SudaTakeshi MiyamotoYoshiaki Toyama 1-Alpha, 25-dihydroxy vitamin D3 inhibits osteoclastogenesis through IFN-beta-dependent NFATc1 suppression. Journal of Bone and Mineral Metabolism 2009, 27, 643-652, 10.1007/s00774-009-0084-4.
- Junichi Kikuta; Shunsuke Kawamura; Fumie Okiji; Mai Shirazaki; Sadaoki Sakai; Hitoshi Saito; Masaru Ishii; Sphingosine-1-phosphate-mediated osteoclast precursor monocyte migration is a critical point of control in antibone-resorptive action of active vitamin D. Proceedings of the National Academy of Sciences 2013, 110, 7009-7013, 10.1073/pnas.1218799110.
- Gong, H.C.; Honjo, Y.; Nangia-Makker, P.; Hogan, V.; Mazurak, N.; Bresalier, R.S.; Raz, A; The NH2 terminus of galectin-3 governs cellular compartmentalization and functions in cancer cells. Cancer Res 1999, 59, 6239-6245.
- Milica Velickovic; Aleksandar Arsenijevic; Aleksandar Acovic; Dragana Arsenijevic; Jelena Milovanovic; Jelena Dimitrijevic; Zeljko Todorovic; Marija Milovanovic; Tatjana Kanjevac; Nebojsa Arsenijevic; et al. Galectin-3, Possible Role in Pathogenesis of Periodontal Diseases and Potential Therapeutic Target. Frontiers in Pharmacology 2021, 12, 638258, 10.3389/fphar.2021.638258.
- Huajun Tang; Peiyue Zhang; Lianlin Zeng; Yu Zhao; Libo Xie; Bo Chen; Mesenchymal stem cells ameliorate renal fibrosis by galectin-3/Akt/GSK3β/Snail signaling pathway in adenine-induced nephropathy rat. Stem Cell Research & Therapy 2021, 12, 1-22, 10.1186/s13287-021-02429-z.
- Guodong Fu; Olena Polyakova; Ronald Chazen; Jeremy Freeman; Ian Witterick; Diagnostic Value of Galectin-3 in Distinguishing Invasive Encapsulated Carcinoma from Noninvasive Follicular Thyroid Neoplasms with Papillary-Like Nuclear Features (NIFTP). Cancers 2021, 13, 2988, 10.3390/cancers13122988.
- Weizhen Jia; Lingyu Kong; Hiroyasu Kidoya; Hisamichi Naito; Fumitaka Muramatsu; Yumiko Hayashi; Han-Yun Hsieh; Daishi Yamakawa; Daniel K. Hsu; Fu-Tong Liu; et al.Nobuyuki Takakura Indispensable role of Galectin-3 in promoting quiescence of hematopoietic stem cells. Nature Communications 2021, 12, 1-17, 10.1038/s41467-021-22346-2.
- Carla Iacobini; Claudia Blasetti Fantauzzi; Rossella Bedini; Raffaella Pecci; Armando Bartolazzi; Bruno Amadio; Carlo Pesce; Giuseppe Pugliese; Stefano Menini; Galectin-3 is essential for proper bone cell differentiation and activity, bone remodeling and biomechanical competence in mice. Metabolism 2018, 83, 149-158, 10.1016/j.metabol.2018.02.001.
- Adriana Lepur; Michael C. Carlsson; Ruđer Novak; Jerka Dumić; Ulf J. Nilsson; Hakon Leffler; Galectin-3 endocytosis by carbohydrate independent and dependent pathways in different macrophage like cell types. Biochimica et Biophysica Acta (BBA) - General Subjects 2012, 1820, 804-818, 10.1016/j.bbagen.2012.02.018.
- Wei Liu; Chung Chi Le; Dong Wang; Di Ran; Yi Wang; Hongyan Zhao; Jianhong Gu; Hui Zou; Yan Yuan; Jianchun Bian; et al.Zongping Liu Ca2+/CaM/CaMK signaling is involved in cadmium-induced osteoclast differentiation. Toxicology 2020, 441, 152520, 10.1016/j.tox.2020.152520.
- Xishuai Tong; Chuang Zhang; Dong Wang; Ruilong Song; Yonggang Ma; Ying Cao; Hongyan Zhao; Jianchun Bian; Jianhong Gu; Zongping Liu; et al. Suppression of AMP‐activated protein kinase reverses osteoprotegerin‐induced inhibition of osteoclast differentiation by reducing autophagy. Cell Proliferation 2019, 53, e12714, 10.1111/cpr.12714.
- Xishuai Tong; Jianhong Gu; Miaomiao Chen; Tao Wang; Hui Zou; Ruilong Song; Hongyan Zhao; Jianchun Bian; Zongping Liu; p53 positively regulates osteoprotegerin-mediated inhibition of osteoclastogenesis by downregulating TSC2-induced autophagy in vitro. Differentiation 2020, 114, 58-66, 10.1016/j.diff.2020.06.002.
- Ahmed Hasbi; Melissa L. Perreault; Maurice Y. F. Shen; Theresa Fan; Tuan Nguyen; Mohammed Alijaniaram; Tomek J. Banasikowski; Anthony A. Grace; Brian F. O'dowd; Paul Fletcher; et al.Susan R. George Activation of Dopamine D1-D2 Receptor Complex Attenuates Cocaine Reward and Reinstatement of Cocaine-Seeking through Inhibition of DARPP-32, ERK, and ΔFosB. Frontiers in Pharmacology 2018, 8, 924, 10.3389/fphar.2017.00924.