Your browser does not fully support modern features. Please upgrade for a smoother experience.
Please note this is a comparison between Version 2 by Dean Liu and Version 1 by Lee Leanne Leung.
Arginine is a semi-essential amino acid with a complex metabolism pathway and diverse functionality, which spans well beyond its role in the immune system. Cancers that are ‘arginine auxotrophic’ rely on extracellular arginine as a crucial substrate for proliferation and growth. Capitalizing on this vulnerability, there are numerous clinical trials evaluating the therapeutic benefits of depleting arginine in multiple types of cancer, including those occurring in the head and neck. However, head and neck cancers are different and are nonauxotrophic for arginine. Here, wresearchers explored the intricacies of arginine metabolism in tongue cancer in order to better understand the therapeutic potential of this biological vulnerability.
- oral tongue squamous cancer
- head and neck cancer
- arginase 1
- arginine metabolism
1. Gene and Protein Expression of ARG1 in Oral Squamous Cell Carcinoma Cell Lines
Aggregated results from one previous report hinted that ARG1 protein expression was higher in head and neck tumor tissues compared with nontumor [12][1]. However, these findings are opposite to our more recently published data [13][2] and two independent datasets (GEO (U133Plus2 GPL570) and TCGA) (Figure 1a) [14,15][3][4]. To robustly verify the expression of ARG1 in oral squamous cell carcinoma cells, endogenous expression was measured in a range of cell lines (SCC9, SCC25 and Cal27). Compared with high endogenous expression of ARG1 in Huh7 control cells, we show that ARG1 was not detectable in oral squamous cell carcinoma (SCC9, SCC25 and Cal27) or noncancer keratinocyte (HaCaT) control cells (Figure 1b). These data also verify the successful transfection of ARG1 at the RNA level (Figure 1b).
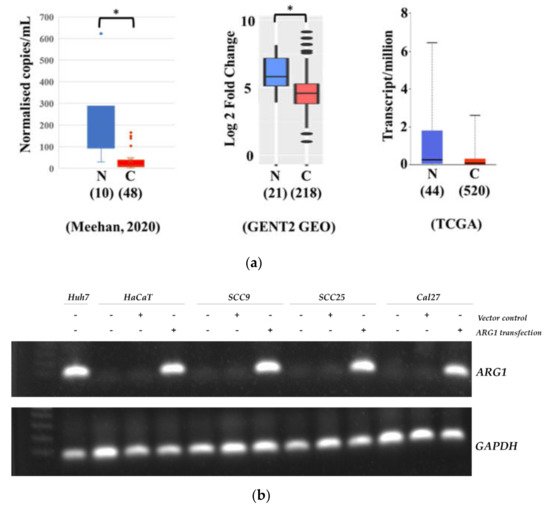
Figure 1. ARG1 expression in oral tongue cancer cell lines. (a) Box and Whisker plots showing reduced ARG1 expression in head and neck cancer relative to noncancer controls using previously published and freely accessible data. * p < 0.05 (b) Cal27, SCC25 and SCC9 oral tongue cancer cells and HaCaT keratinocytes were transfected with ARG1 or empty vector. Gene expression was measured by RT-PCR to confirm that transfection was successful. After transfection, the level of overexpression was similar to that observed in the positive control cells (Huh7).
2. ARG1 Expression Inhibits Oral Squamous Cell Carcinoma Cell Growth
Various functional assays were performed to study the effect of ARG1 overexpression. In general, the results show that ARG1 overexpression had an inhibitory effect on oral tongue cancer cell viability and proliferation (Figure 2). Colony formation was assessed using a plate colony formation assay with ARG1-transfected SCC25 and Cal27 cells and respective controls (Figure 2a). The number of colonies formed by ARG1-transfected SCC25, Cal27 and HaCaT cells were significantly lower than nontransfected cells (0.85-fold, p < 0.05 and 0.57-fold, p < 0.01, 0.36-fold, p < 0.01 relative to control, respectively). Collectively, the data show that ARG1 overexpression inhibited colony formation regardless of cell type. Cell viability was measured by the CCK-8 cell proliferation assay and standard trypan blue enumeration. The results showed that ARG1 overexpression had an inhibitory effect on proliferation (Figure 2b) and viability (Figure 2c) of oral cancer cells in a time-dependent manner as the cell numbers decreased over time. Collectively, these results suggest that ARG1 overexpression inhibits the growth of oral cancer cells in vitro.
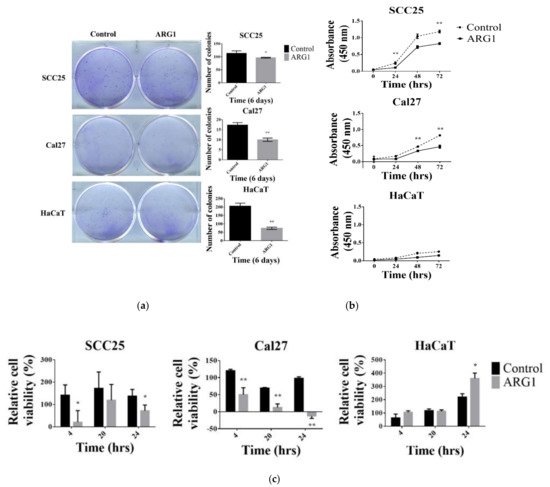
Figure 2. ARG1 expression inhibits oral tongue squamous cell carcinoma cell colony formation and cell viability. (a) Colony-forming assays were performed in six-well plates using SCC25 and Cal27 oral tongue cancer cells and HaCaT controls. Colonies were fixed and stained after 6 to 10 days and then counted using the COUNTPHICS plugin with ImageJ. Colony formation of SCC25, Cal27 and HaCaT cells was significantly reduced upon transfection with ARG1 relative to untransfected controls. (b) Cell proliferation of transfected and untransfected SCC25, Cal27 and HaCaT was performed in 96-well plates. After 24, 48 and 72 h, cell viability was measured by the CCK-8 assay. The average absorbance for 10 wells per group was calculated. Proliferation of SCC25 and Cal27 cells was significantly inhibited upon ARG1 transfection relative to untransfected controls. In contrast, no significant impact was observed for HaCaT cells relative to untransfected controls. (c) SCC9, SCC25 and Cal27 cells were cultured in 24-well plates. After cells were transfected with ARG1 or empty vector controls, cells were trypsinized at various time points (0 h, 4 h, 20 h and 24 h) and counted based on trypan blue (Gibco™) exclusion. Viability of SCC25 and Cal27 cells was significantly inhibited by ARG1 transfection in a time-dependent manner relative to empty vector controls. In general, ARG1 transfection did not impact the viability of HaCaT cells. However, after 24 h, ARG1 transfection was associated with an increase in HaCaT cell viability relative to empty vector controls. * p < 0.05, ** p < 0.001.
3. ARG1 Expression Inhibits Oral Squamous Cell Carcinoma Cell Migration and Invasion
The effect of ARG1 overexpression on the migratory ability of oral cancer cells in vitro was determined by a wound-healing assay. The wound-healing rate of ARG1-transfected SCC25 and Cal27 cells was significantly reduced (87%, 70%, 62.4%, p < 0.001 and 88.44%, 26.53%, p < 0.001) relative to control cells (Figure 3a). In comparison, the rate of wound closure was not significantly different between ARG1-transfected HaCaT cells and controls. The invasiveness of ARG1-transfected SCC25 and Cal27 was determined using a transwell migration assay. The data showed that the invasive capacity of SCC25 and Cal27 cells were significantly lower after ARG1 transfection (0.36-fold, p < 0.001 and 0.31-fold, p < 0.05 at 24 h relative to control, respectively). In comparison, there was a small but significant increase in migration of the ARG1-transfected HaCaT cells relative to control (1.3-fold, p < 0.05) (Figure 3b). Taken together, these data indicate that ARG1 overexpression inhibits the migration and the invasion of oral cancer cells in vitro.
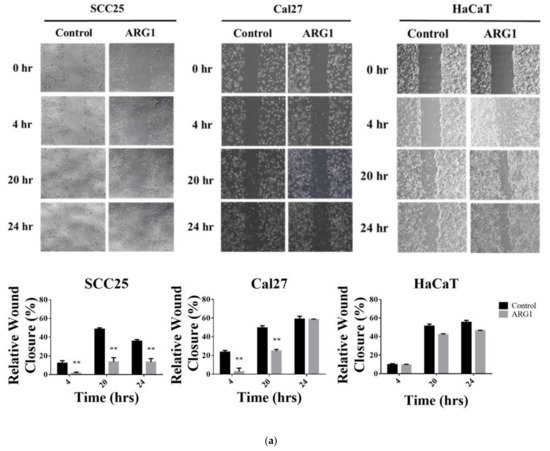
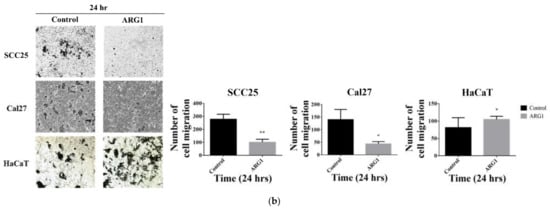
Figure 3. ARG1 expression inhibits oral tongue squamous cell carcinoma cell migration and invasion. (a) The wound-healing assay was performed using ARG1-transfected SCC25, Cal27 and HaCaT cells and the respective endogenous controls. Cells were seeded into 6-well plates and cultured until 80% confluent. Following this, a scratch was created, and nonadherent cells were removed. Cells were cultured for up to 24 h in serum-free medium, followed by imaging. Wound closure was measured at various time points (0 h, 4 h, 20 h and 24 h), and the healing rate was determined using ImageJ. Migration of SCC25 and Cal27 cells was significantly reduced upon transfection with ARG1 relative to untransfected controls. In contrast, ARG1 transfection had no significant impact on HaCaT cells relative to untransfected controls. (b) Cell migration was assessed using ARG1-transfected SCC25, Cal27 and HaCaT cells and the respective endogenous controls. Cells were seeded into 24-well plates containing 8 µm pore transwell upper chamber inserts (SPL Life Science). The upper chamber containing the cells was filled with serum-free medium, and complete medium was added into the lower chamber. After 24 h, cells were fixed and stained. Migrating cell colonies were counted with ImageJ using the Cell Counter plugin. Migration of SCC25 and Cal27 cells was significantly reduced upon transfection with ARG1 relative to untransfected controls. In contrast, ARG1 transfection had no significant impact on HaCaT cells relative to untransfected controls. * p < 0.05, ** p < 0.001.
4. Transcriptome Profiling in SCC25 Delineates the Antioncogenic Effect of ARG1-Treated Oral Squamous Cell Carcinoma Cells
RNA-sequencing was performed to explore the genes and associated networks that were impacted by deregulated ARG1 expression (Figure 4). We identified a total of 395 differentially expressed genes (DEGs) using an FDR-adjusted p < 0.05. Of these, 69 were upregulated, and 40 were downregulated in ARG1-transfected cells based on a log2 fold change threshold of >1 and <−1, respectively (Supplementary Materials Table S1). The top 20 DEGs with the greatest changes in expression are shown in Table 1 and Figure 4a,b. Consistent with experimental transfection, ARG1 was the most upregulated DEG with a 6.6-fold increase in expression. This was followed by 5.6-fold and 5.3-fold upregulation of LAT and C19orf38, respectively. In contrast, RXFP3 was the most downregulated gene (−4.9-fold), followed by RFPL3S and GP5 (−4.9-fold and −4.8-fold, respectively).
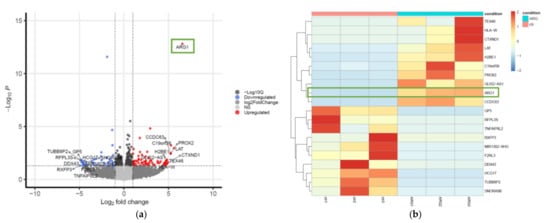
Figure 4. Volcano plot and heatmap representation of RNA-sequencing data. (a) The volcano plot was generated with the enhanced Volcano package in R using HISAT2-featureCounts-DESeq2 log fold change and p-value thresholds of −1 and 1 and 0.05, respectively. The orange color represents highly expressed genes, while the blue color represents weakly expressed genes. (b) Heatmap of the top 20 most deregulated genes in SCC25 cells with and without ARG1 overexpression. We observe two distinct clusters of significantly up- and downregulated genes that dichotomize cells based on ARG1 overexpression status.
Additional in silico analysis using UALCAN and the head and neck cancer TCGA dataset was used as an orthogonal method to support these data. We show that LAT expression is significantly upregulated in head and neck tumors compared with noncancer controls (Figure 5), a phenomenon that was recapitulated by our gene expression data. It is speculated that ARG1 transfection may drive a further increase in LAT expression, but further analyses are needed to quantitate this. In contrast, in silico analysis shows that CCDC63 expression is low and conserved between cancer and noncancer tissues (Figure 5). This contrasts with the results described in Table 1, where CCDC63 expression is significantly upregulated in oral cancer cells after ARG1 transfection. It is also showed that RXFP3 and RFPL3S expression is significantly higher in head and neck cancer tissues compared with noncancer controls (Figure 5). 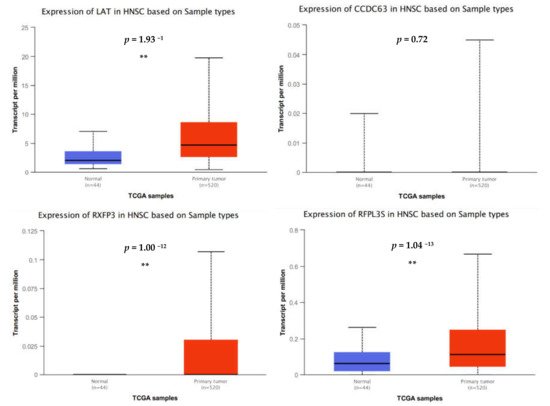
Figure 5. In silico analyses of deregulated genes. LAT, RXFP3 and RFPL3S are expressed at statistically significantly higher levels in head and neck cancer tissues relative to noncancer controls whereas CCDC63 expression is similar between cancer and noncancer. ** p < 0.001.
5. Ingenuity Pathway Analysis (IPA)
IPA, a web-based bioinformatics tool, was used to further analyze the enrichment of gene sets and functions in our RNA-seq data [16][5]. We identified activated HIFα (−log p-value = 2.6, Z-score = 1.67) and inhibited natural killer cell signaling (−log p-value = 2.7, Z-score = 1.67) as the most significant canonical pathways affected by DEGs in our dataset. A bar chart was constructed, and STRING analysis was performed to visualize these observations (Figure 6). Examination of the genes associated with these pathways revealed that most fell within the log2 fold change threshold (1 to −1) and were not significantly deregulated. Genes associated with HIFα signaling that were downregulated in response to ARG1 (AKT1, HSPA8 and RPS6KB2) have classical roles in promoting cell proliferation and growth (Figure 6a). In contrast, genes involved in the HIFα signaling that were upregulated in response to ARG1 (EDN1, IL6, NCF2, SERPINE1, SLC2A3 and VIM) were generally more pleiotropic and were associated with metabolism, epithelial-to-mesenchymal transition and angiogenesis (Figure 6b). Genes involved in the natural killer cell signaling pathway that were downregulated in response to ARG1 (AKT1, HSPA8, ITGB1 and NFATC3) have well-established roles in promoting cell proliferation and growth, as well as in the regulation of transcriptional activation (Figure 6c). In comparison, DEGs involved in the natural killer cell signaling pathway that were upregulated in response to ARG1 (WIPF1, LAT, HLA-B, HLA-C and HLA-F) have traditional roles in antigen presentation and mediation of T-cell receptor signaling (Figure 6c,d). Beyond the interaction with HIFα and natural killer cell signaling, ARG1 overexpression was also associated with upregulation of genes involved in regulating transcription, including prospero homeobox protein 2 (PROX2), histone H2B type 2-E1 (H2BE1) and GLIS family zinc finger 2 (GLIS2).

Figure 6. Visual representation of DEGs over- and underrepresented in the HIFα and natural killer cell signaling pathways, respectively. (a) Graphical representation of log2 fold change of DEGs that were overrepresented in the HIFα signaling pathway. (b) STRING diagram showing that overrepresented DEGs in the HIFα signaling pathway are known or predicted to interact based on various lines of evidence. (c) Graphical representation of log2 fold change of DEGs that were underexpressed in the natural killer cell signaling pathway. (d) STRING diagram showing that underrepresented DEGs in the natural killer cell signaling pathway form 2 interaction groups.
We also analyzed upstream regulators of DEGs by using the upstream regulator analysis tool in IPA (Supplementary Table S2). This tool associated the upstream regulators with downstream functions to generate regulator effects hypotheses with predicted activation of upstream regulators. Type I interferon family genes, IFNα2, IFNλ1 and IFNλ receptor 1, important regulators of innate antiviral and antibacterial immunity, were predicted to be positive regulators upon ARG1 overexpression. Similarly, MAP3K7 was predicted as another positive regulator and is an important mediator of cellular responses evoked by changes in the environment. It is noteworthy that IFNL1 was identified as the most important activated upstream regulator (p = 1.32 x 10⁻¹³) and is predicted to be responsible for the gene expression changes observed in the experimental dataset. Beyond this, IPA predicted that IFNL1 is most likely to be associated with elevated levels of IL-12 in the circulation and decreased viral replication (Figure 7). This prediction tool also revealed that IRGM and MAPK1 may be significant negative upstream regulators. IRGM is a putative GTPase involved in orchestrating an innate immune response and regulating proinflammatory cytokine production. MAPK1 is an essential component of the MAP kinase signal transduction pathway and mediates diverse biological functions such as cell growth, adhesion, survival and differentiation through the regulation of transcription, translation and cytoskeletal rearrangements.
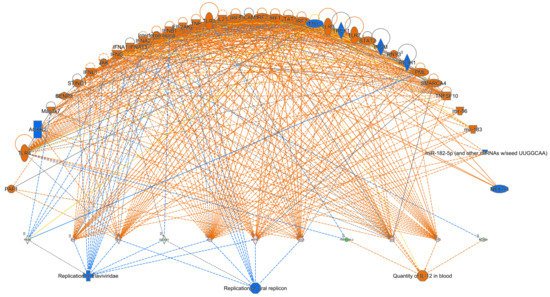
Figure 7. Representation of the top disease and function effects caused by predicted upstream regulators that are impacted by ARG1 overexpression. Blue and orange shapes represent negative and positive effects, respectively.
References
- Srivastava, S.; Ghosh, S.K. Modulation of L-Arginine-Arginase Metabolic Pathway Enzymes: Immunocytochemistry and mRNA Expression in Peripheral Blood and Tissue Levels in Head and Neck Squamous Cell Carcinomas in North East India. Asian Pac. J. Cancer Prev. 2015, 16, 7031–7038.
- Meehan, K.; Leslie, C.; Lucas, M.; Jacques, A.; Mirzai, B.; Lim, J.; Bulsara, M.; Khan, Y.; Wong, N.C.; Solomon, B.; et al. Characterization of the immune profile of oral tongue squamous cell carcinomas with advancing disease. Cancer Med. 2020, 9, 4791–4807.
- Chandrashekar, D.S.; Bashel, B.; Balasubramanya, S.A.H.; Creighton, C.J.; Ponce-Rodriguez, I.; Chakravarthi, B.; Varambally, S. UALCAN: A Portal for Facilitating Tumor Subgroup Gene Expression and Survival Analyses. Neoplasia 2017, 19, 649–658.
- Park, S.J.; Yoon, B.H.; Kim, S.K.; Kim, S.Y. GENT2: An updated gene expression database for normal and tumor tissues. BMC Med. Genom. 2019, 12, 101.
- Vishnubalaji, R.; Sasidharan Nair, V.; Ouararhni, K.; Elkord, E.; Alajez, N.M. Integrated Transcriptome and Pathway Analyses Revealed Multiple Activated Pathways in Breast Cancer. Front. Oncol. 2019, 9, 910.
More